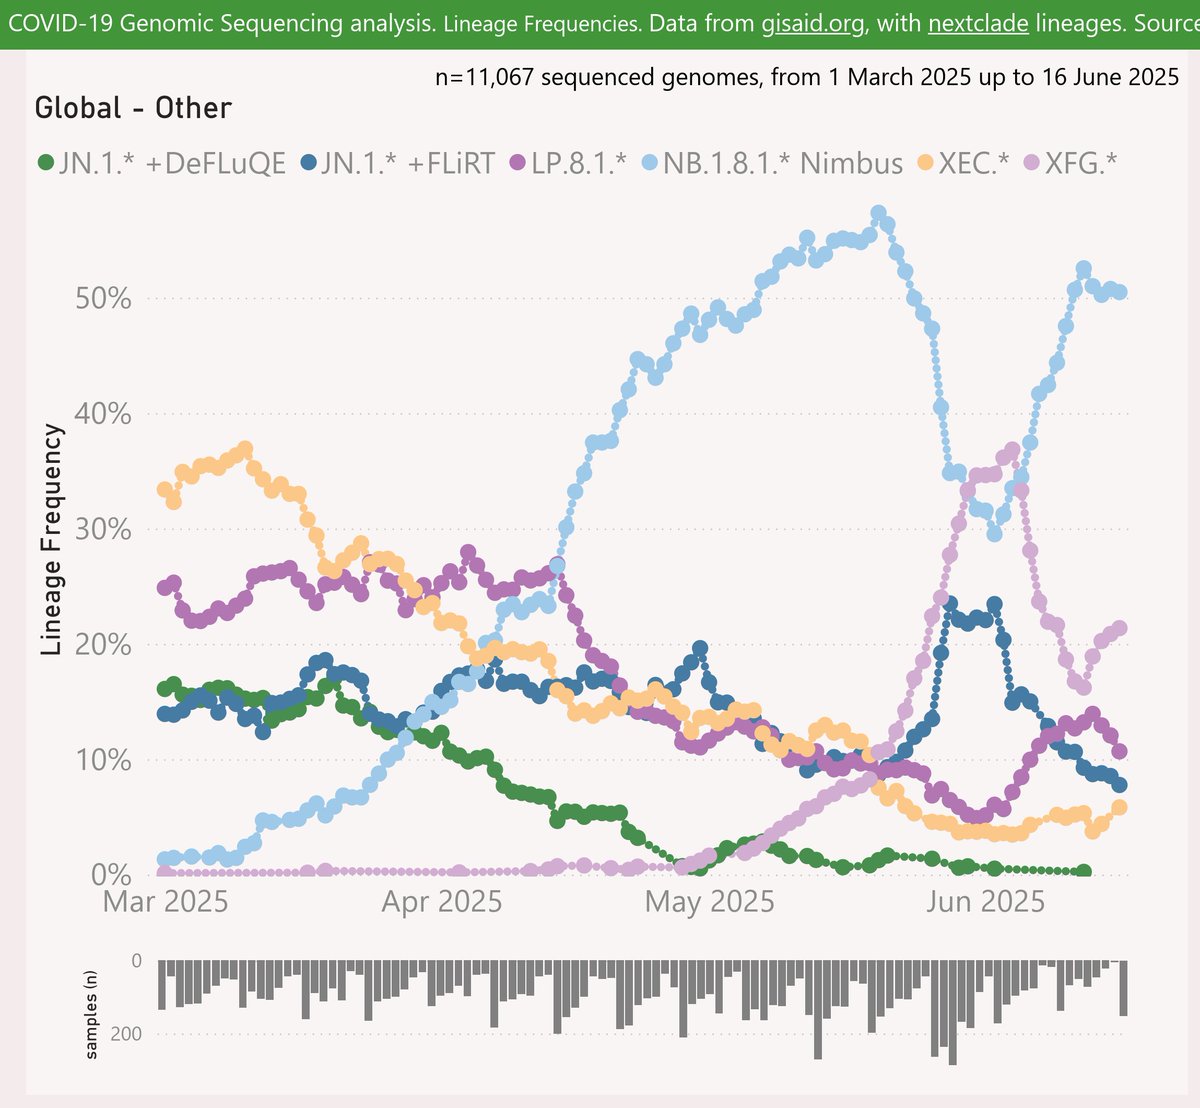
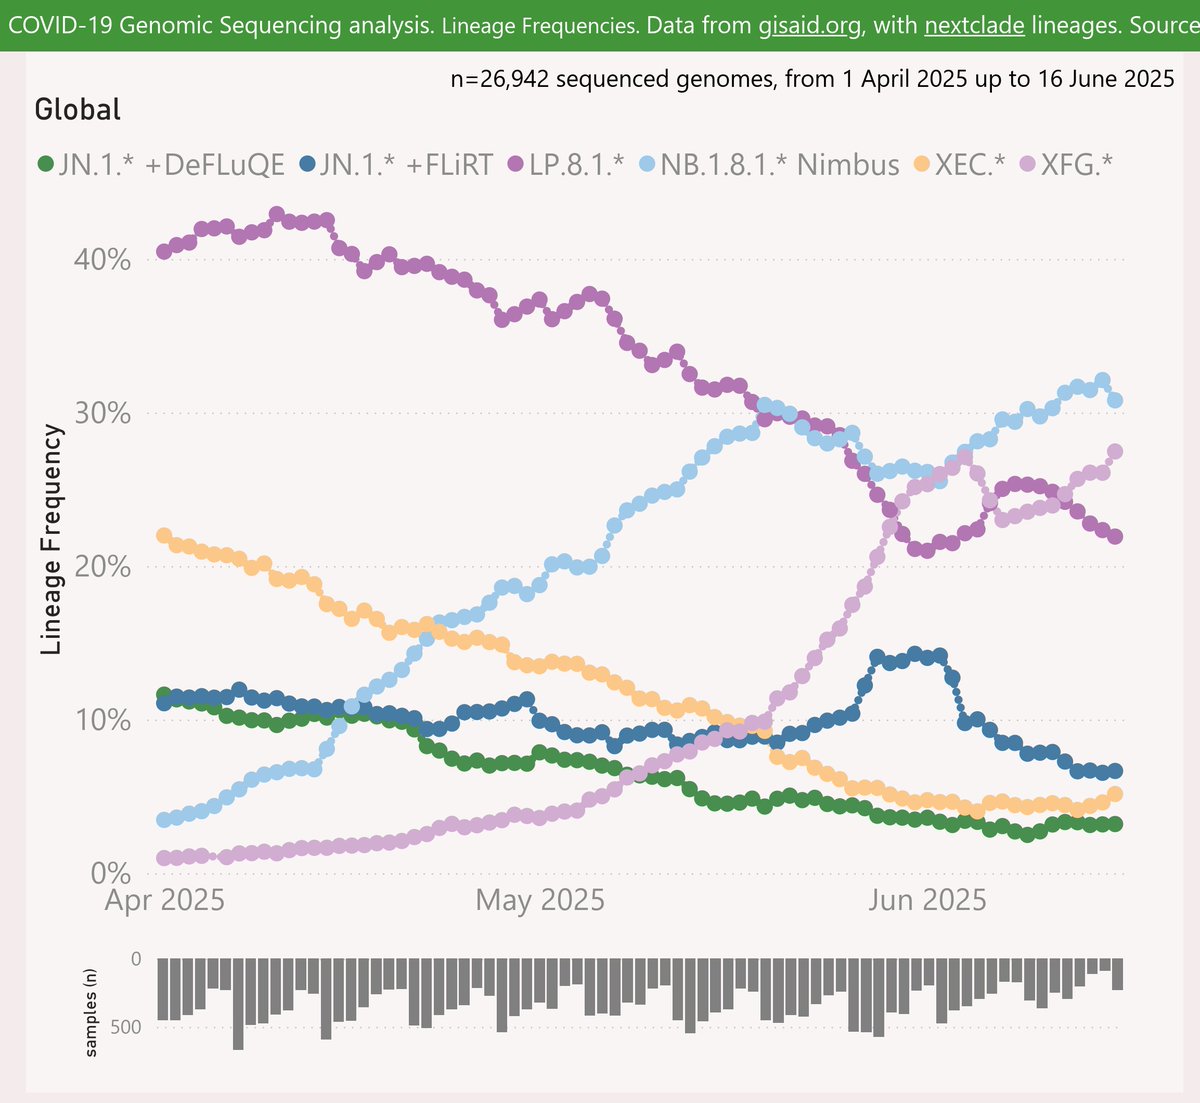
Here's the latest variant picture with a global scope, to late June.
The NB.1.8.1 "Nimbus" and XFG.* "Stratus" variants are battling for dominance in an unclear picture.
XFG.* "Stratus" looks to have the best growth rate.
#COVID19 #Global #NB_1_8_1 #Nimbus #XFG #Stratus
🧵
The NB.1.8.1 "Nimbus" and XFG.* "Stratus" variants are battling for dominance in an unclear picture.
XFG.* "Stratus" looks to have the best growth rate.
#COVID19 #Global #NB_1_8_1 #Nimbus #XFG #Stratus
🧵

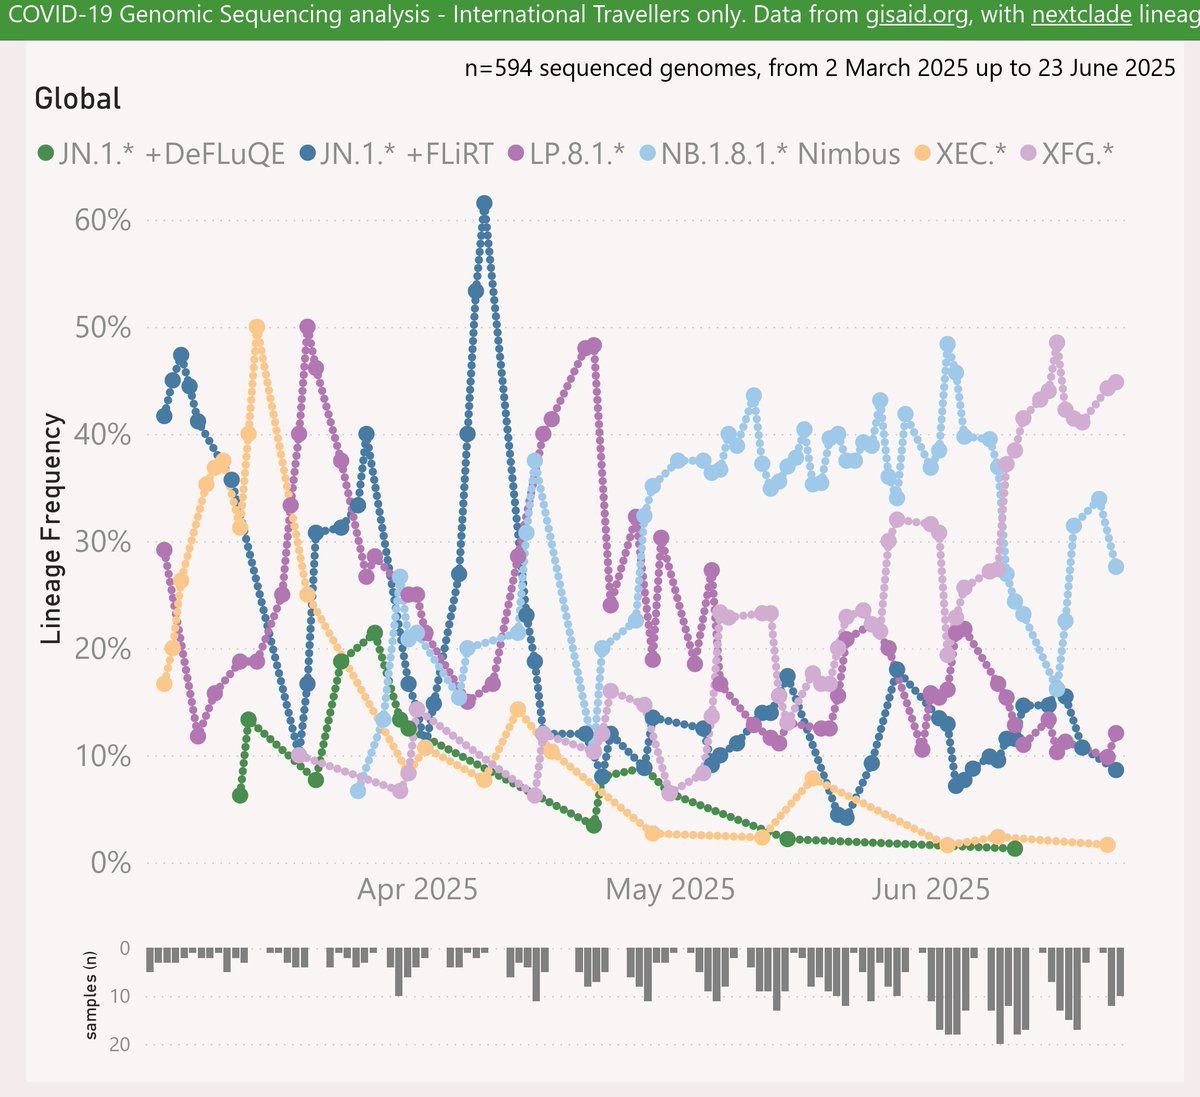
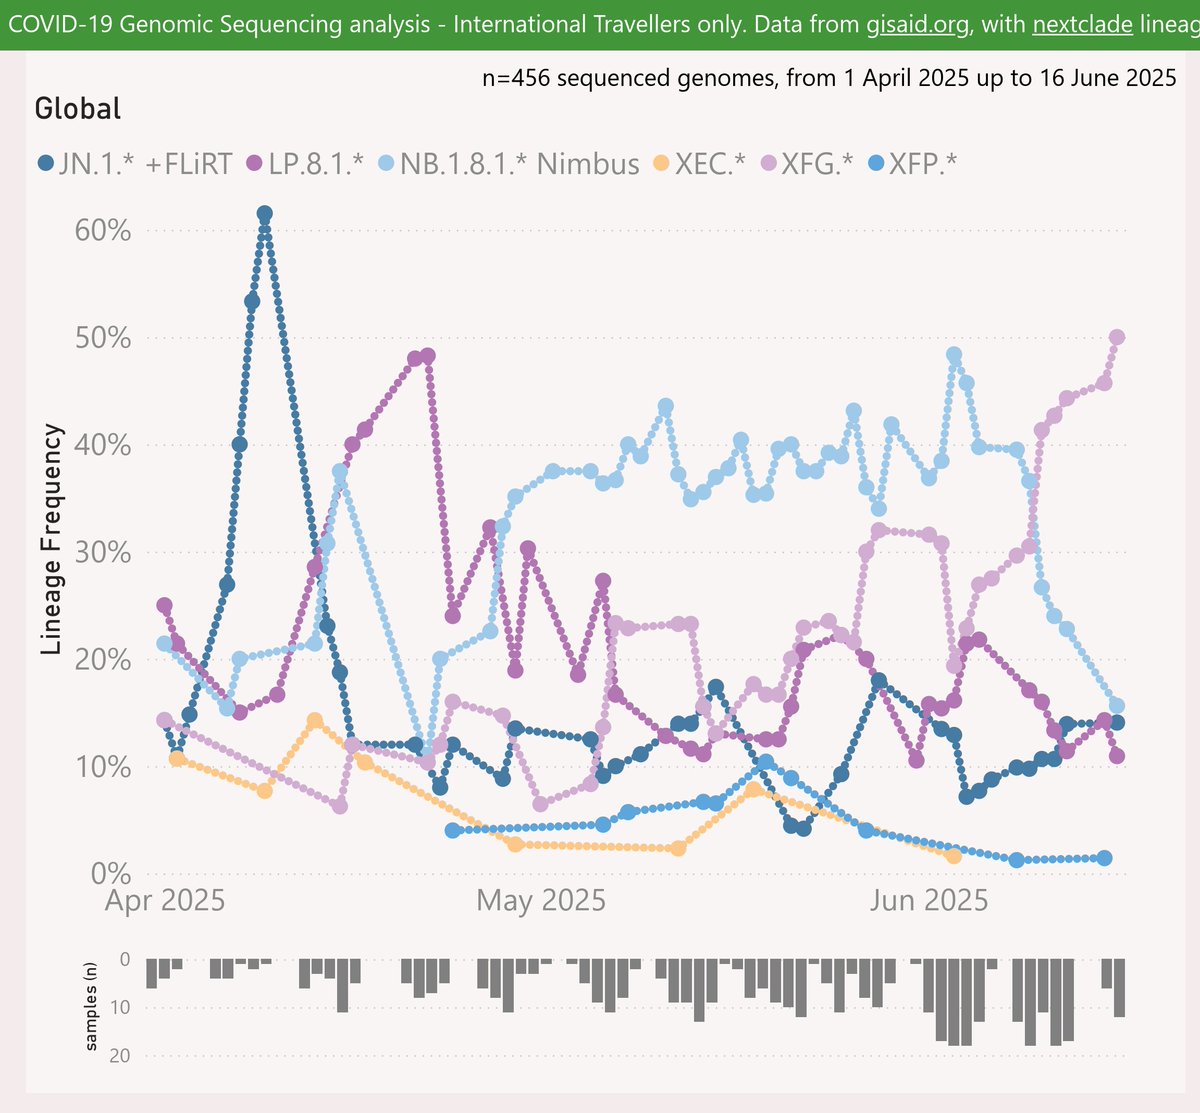
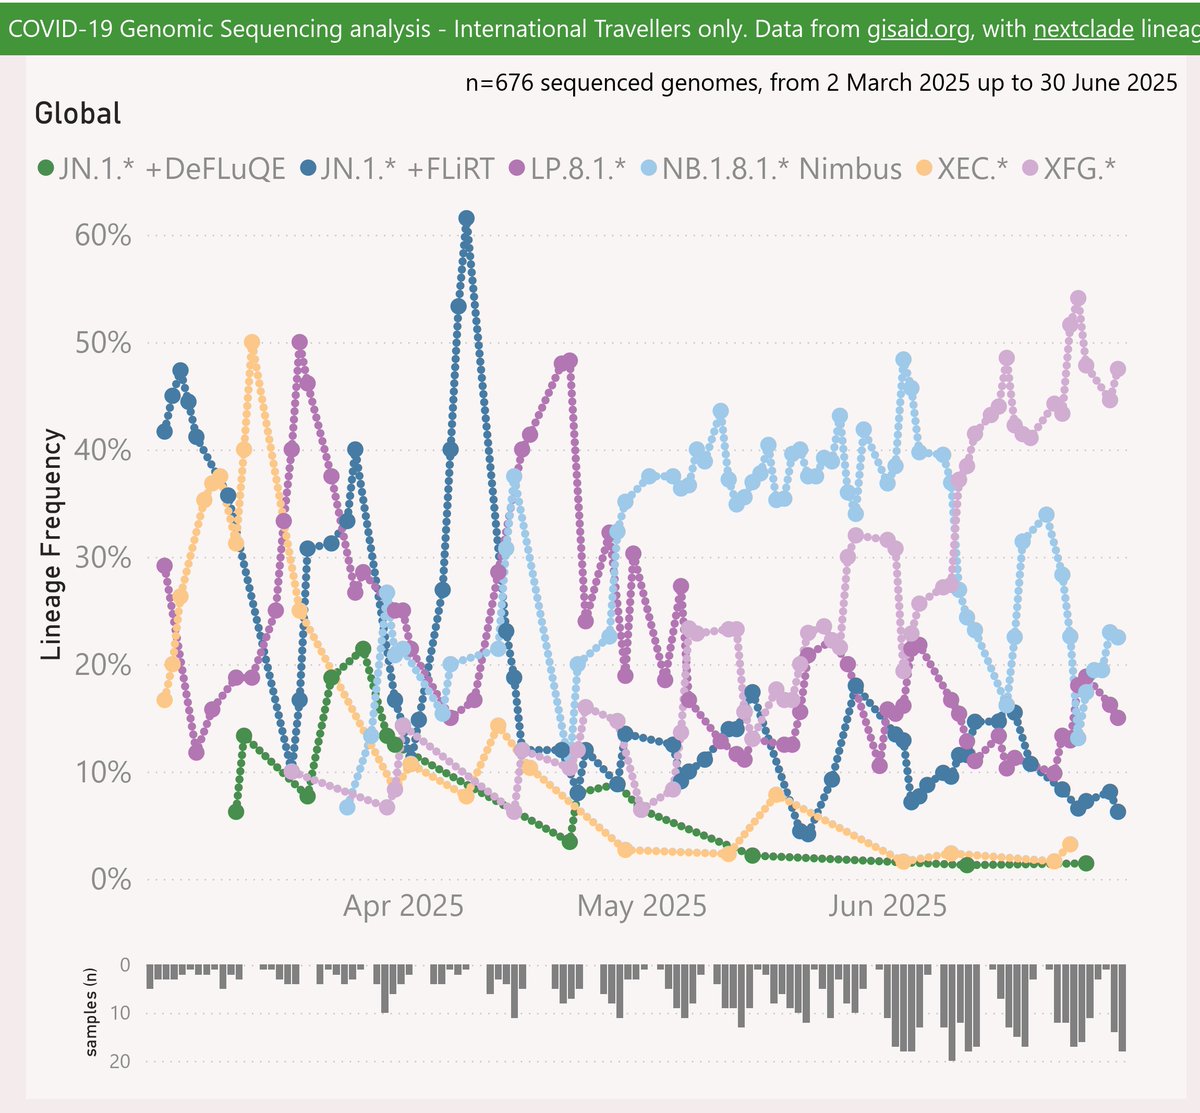
Here are the trends across all the International Traveller samples. From that perspective, XFG.* "Stratus" is dominant at 48%.
This dataset (mostly arrivals in the US and Japan) is arguably more random, as it is not skewed by sequencing volumes.
🧵
This dataset (mostly arrivals in the US and Japan) is arguably more random, as it is not skewed by sequencing volumes.
🧵
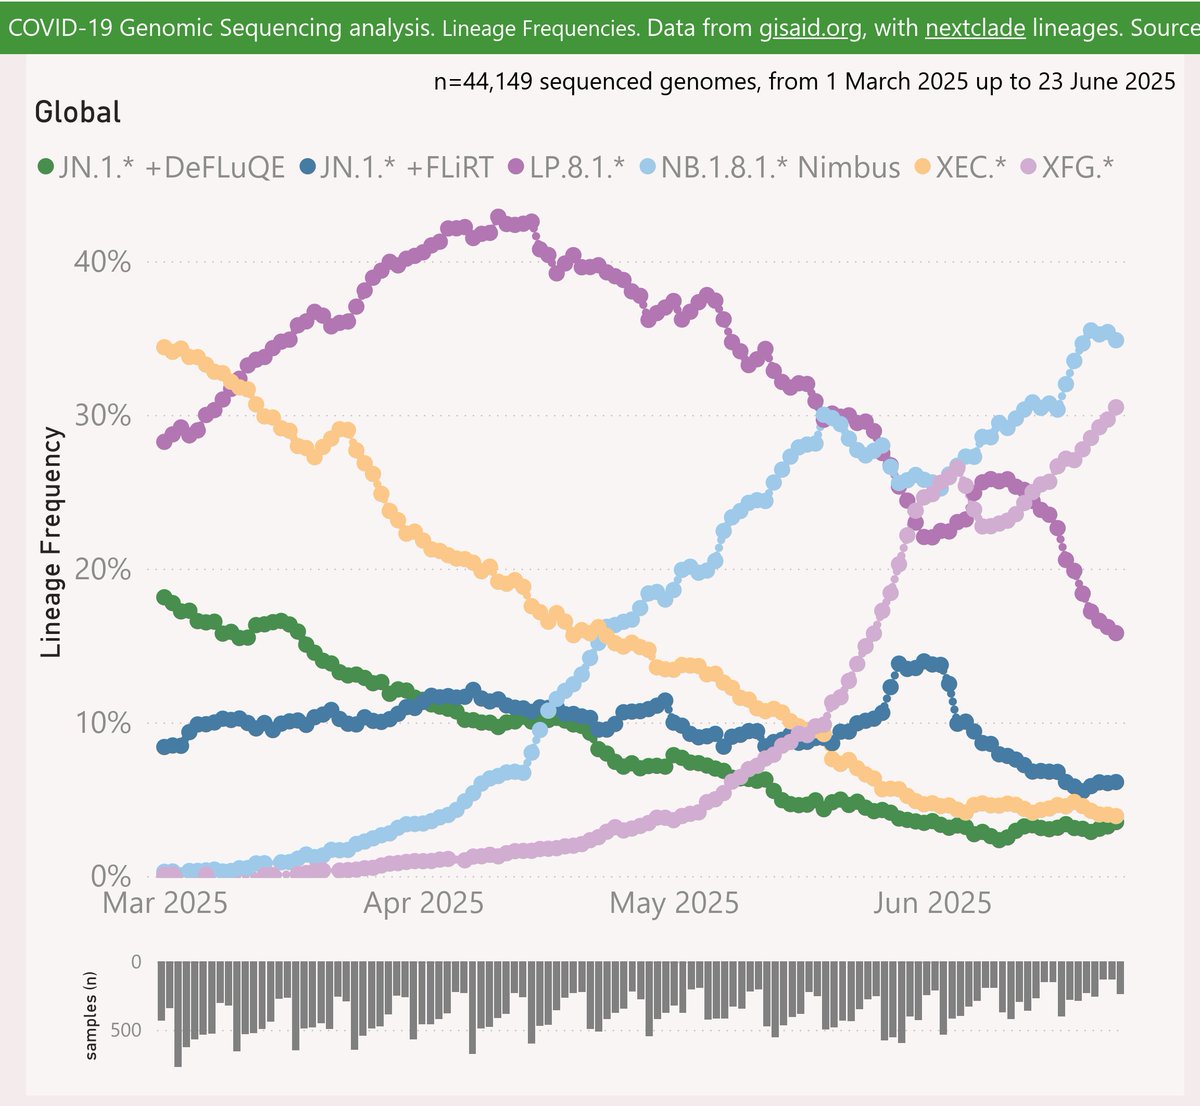
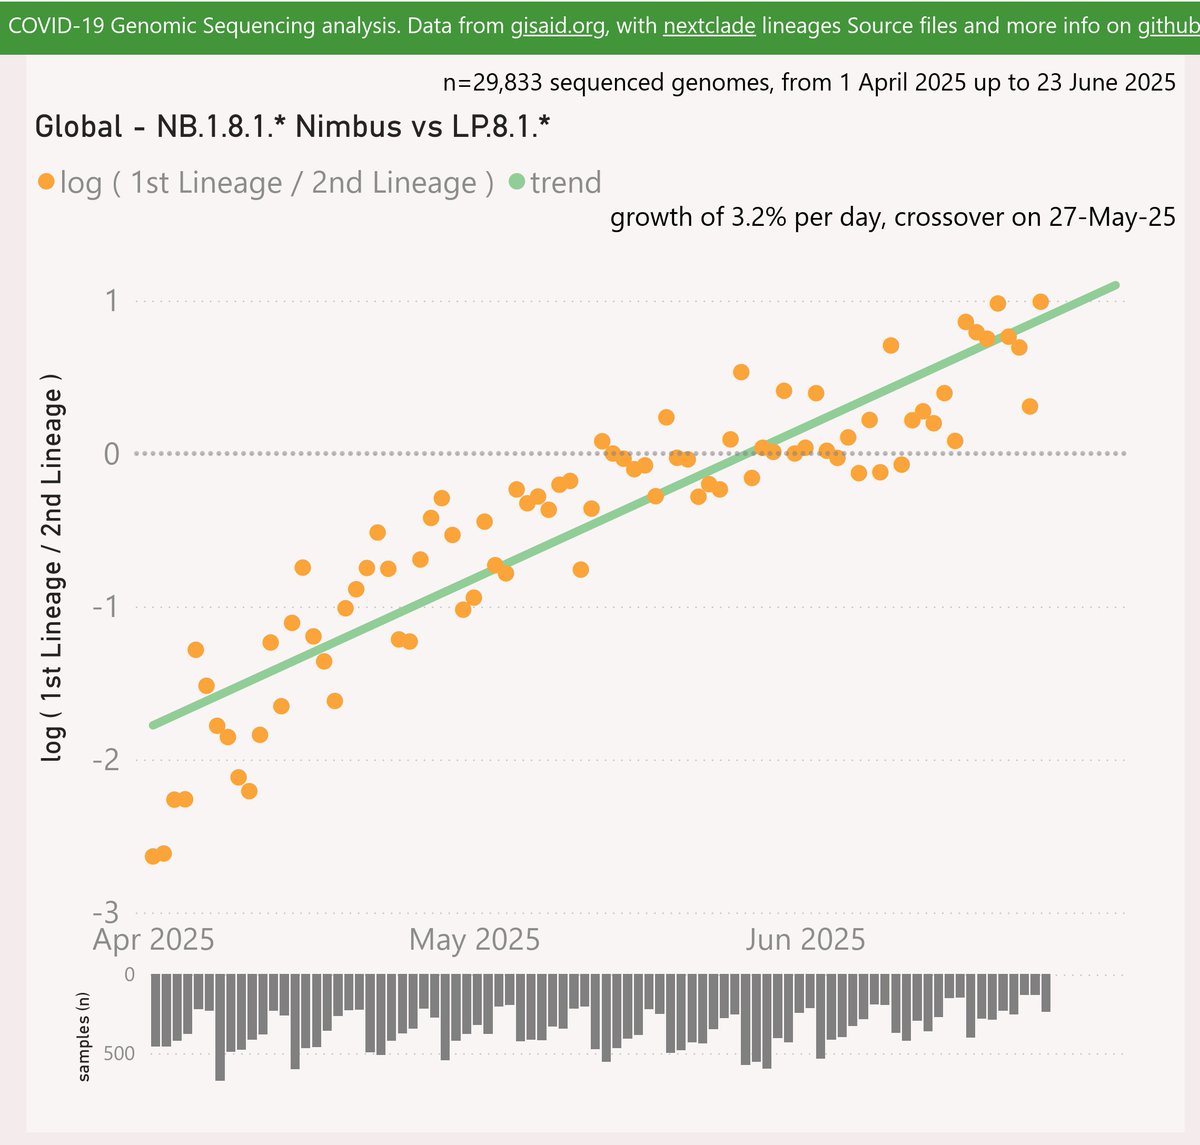
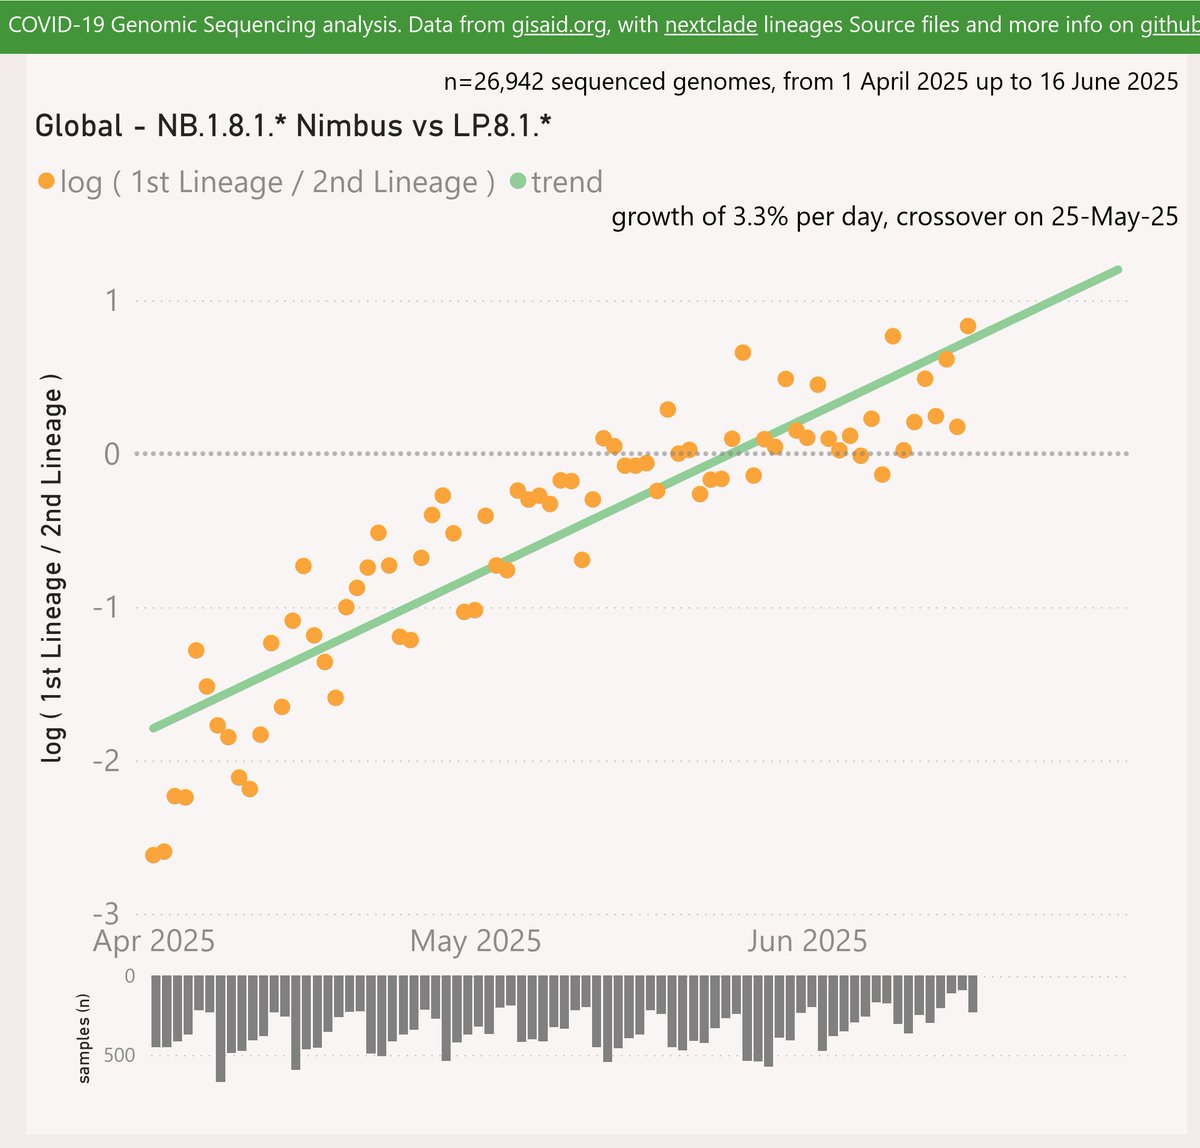
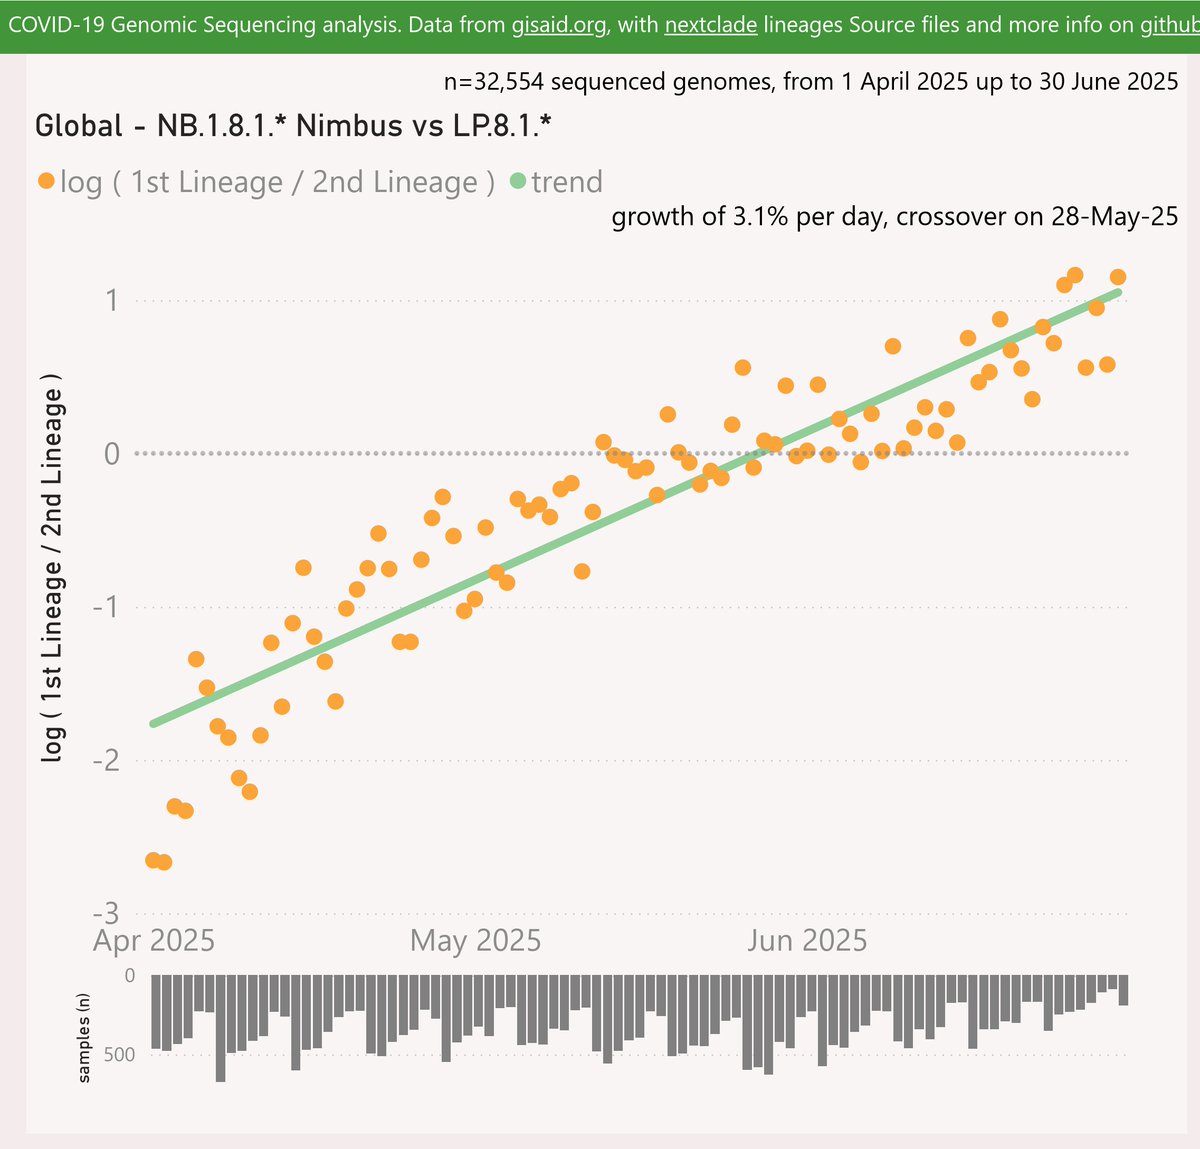
Globally, the NB.1.8.1 "Nimbus" variant is showing a steady growth advantage of 3.1% per day (22% per week) over the LP.8.1.* variant, with a crossover in late May.
🧵
🧵
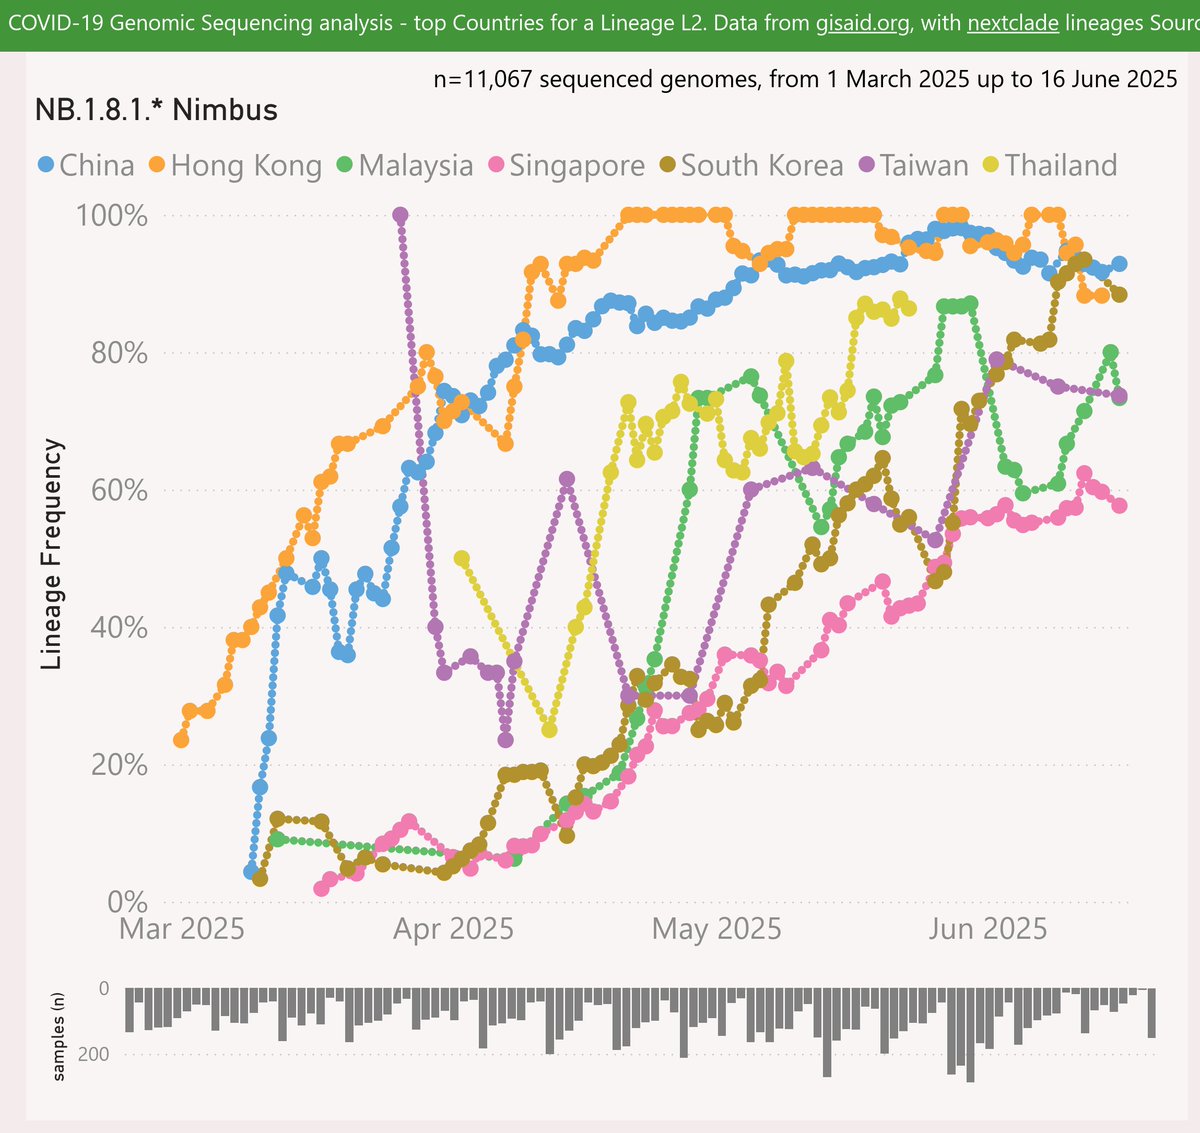
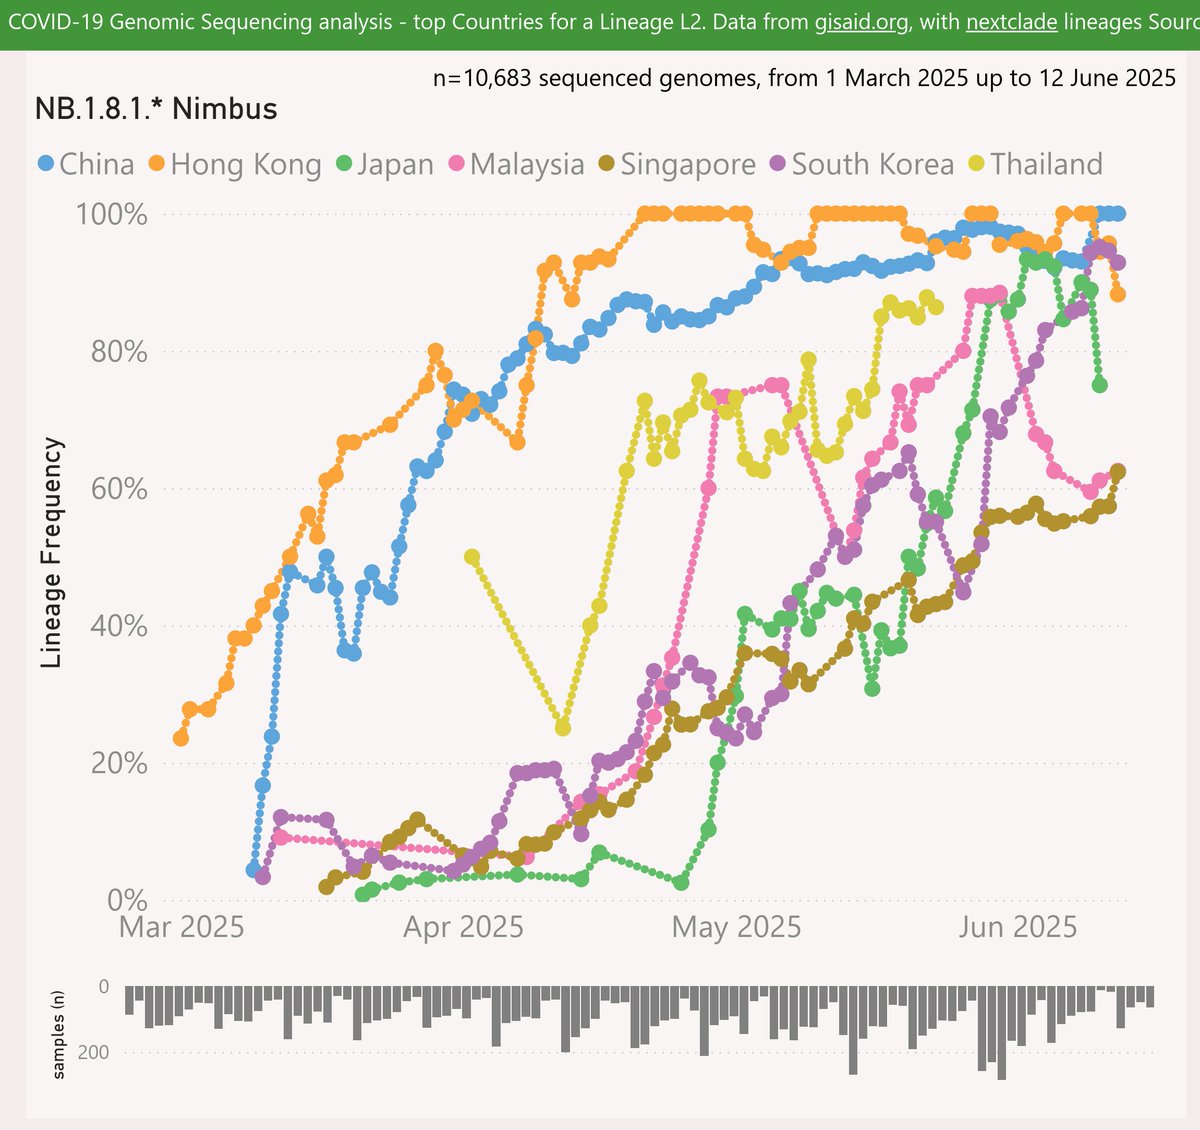
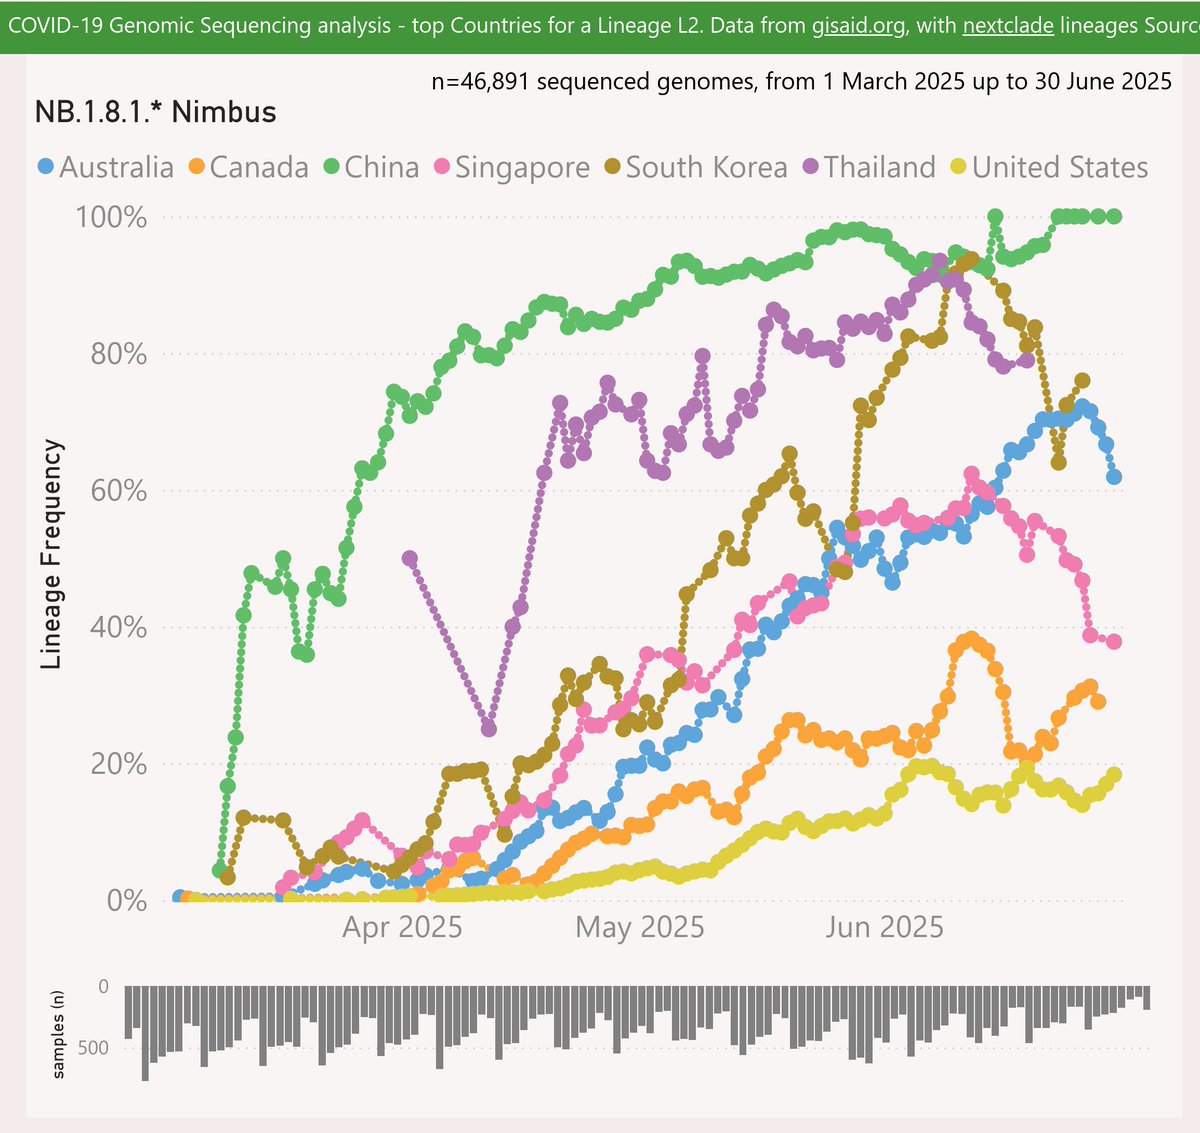
Here are the leading countries reporting NB.1.8.1 "Nimbus". There seem to be 3 tracks:
- China, Thailand and South Korea are reporting a clean sweep or close to it.
- Singapore and Australia in a mid-range
- growth in the US, UK and Canada has been lower at 20-30%.
🧵
- China, Thailand and South Korea are reporting a clean sweep or close to it.
- Singapore and Australia in a mid-range
- growth in the US, UK and Canada has been lower at 20-30%.
🧵
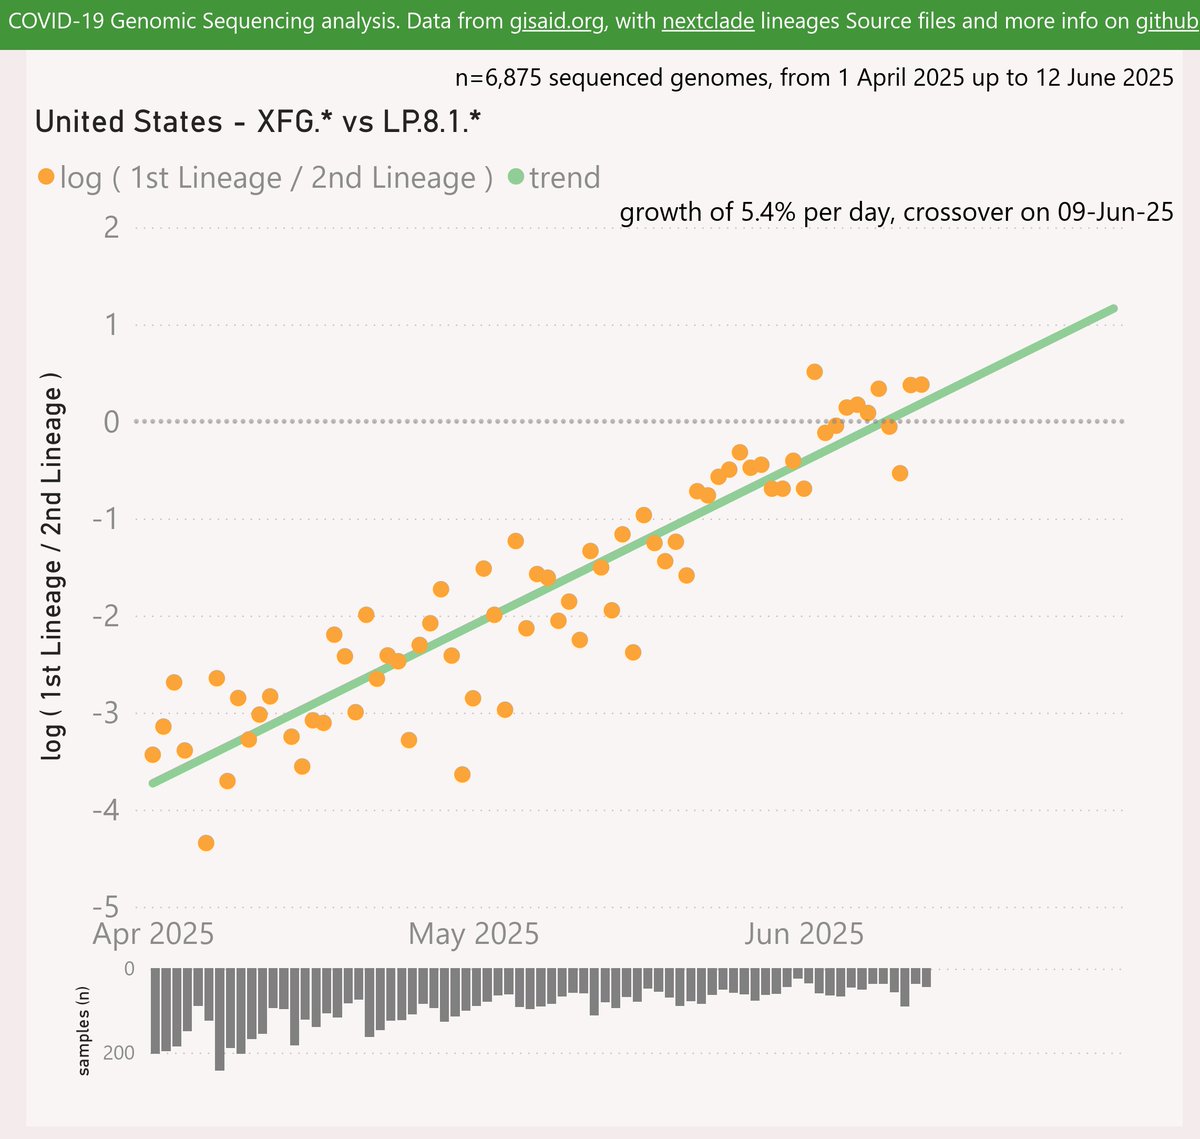
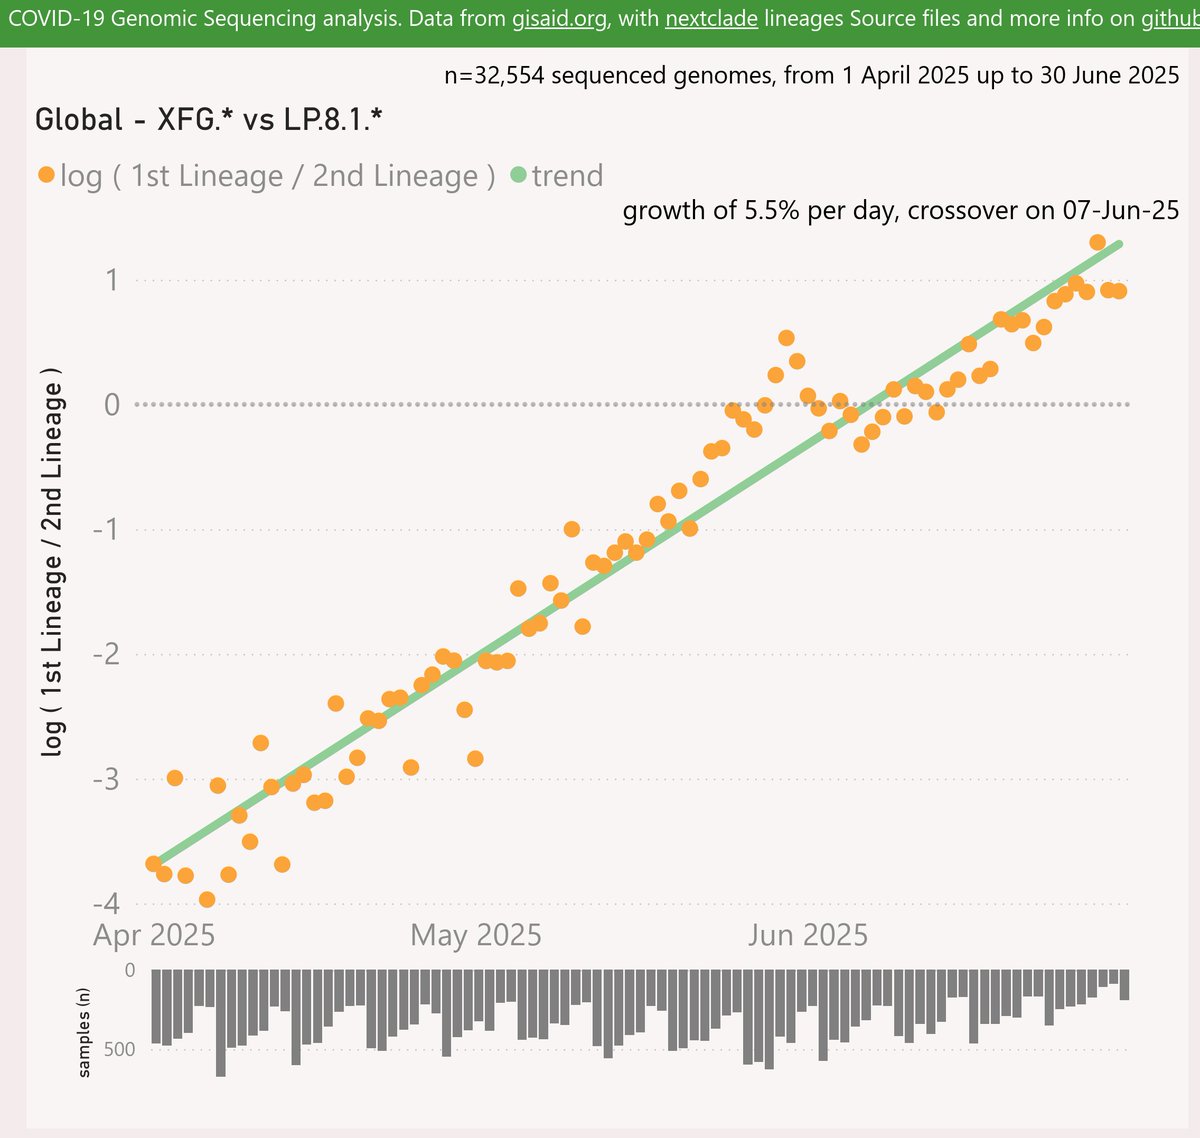
Globally, the XFG.* "Stratus" variant is showing a stronger growth advantage of 5.5% per day (39% per week) over the LP.8.1.* variant. That shows a crossover in early June.
🧵
🧵
Here are the leading countries reporting XFG.* "Stratus". It reached 77% in India, before falling to finish at 54%. It has also shown sustained growth to around 55% in the US, with the other leading countries on a very similar trajectory.
🧵
🧵

This adds further weight to the case for Stratus over Nimbus. It suggests a double-wave could be in store for those countries who have already had mid-level Nimbus waves e.g. Singapore and Australia.
🧵
🧵
• • •
Missing some Tweet in this thread? You can try to
force a refresh