
1. PMC COVlD Dashboard, July 21, 2025 (U.S.)
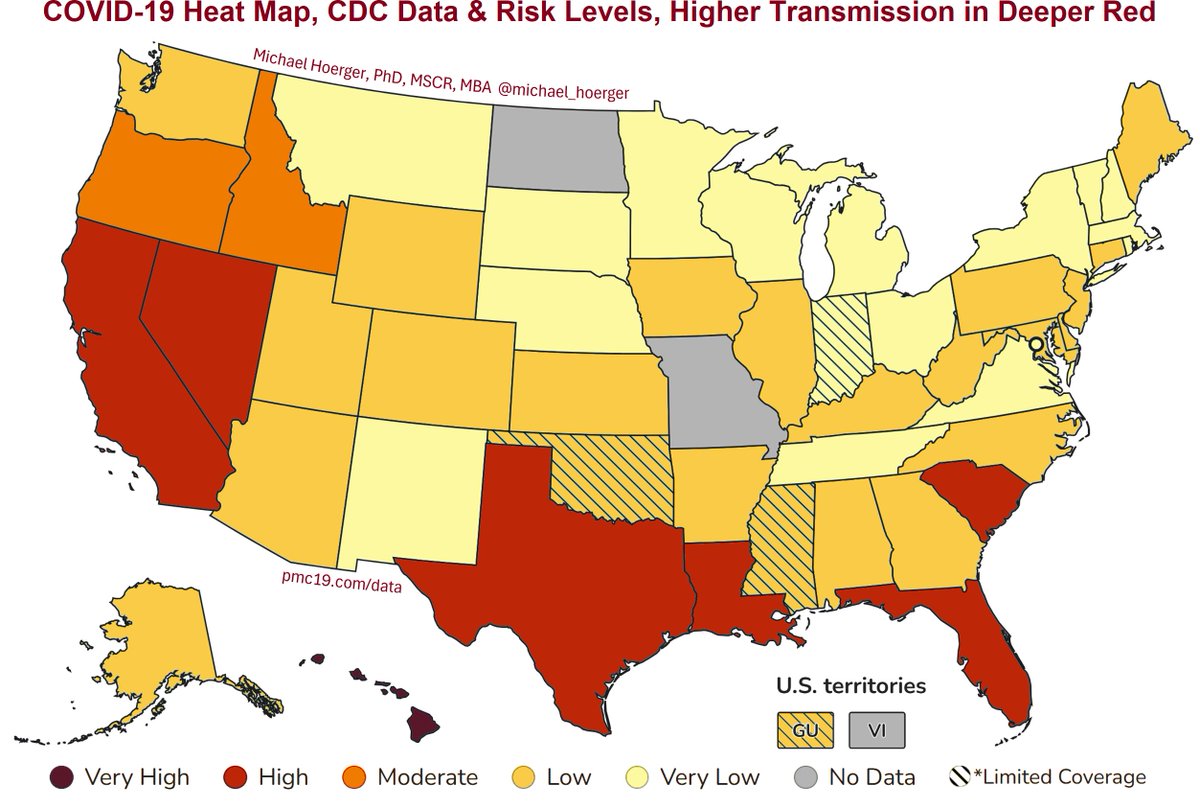
COVlD is surging in 7 states, according to the CDC.
🔹Hawai'i (Very High)
🔹California (High)
🔹Nevada (High)
🔹Texas (High)
🔹Louisiana (High)
🔹Florida (High)
🔹South Carolina (High)
COVlD is surging in 7 states, according to the CDC.
🔹Hawai'i (Very High)
🔹California (High)
🔹Nevada (High)
🔹Texas (High)
🔹Louisiana (High)
🔹Florida (High)
🔹South Carolina (High)
2. PMC COVlD Dashboard, July 21, 2025 (U.S.)
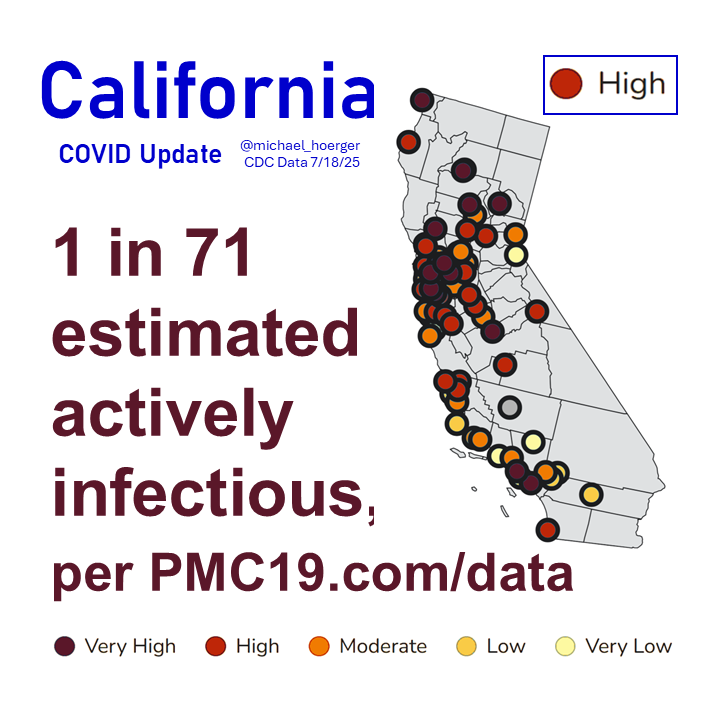
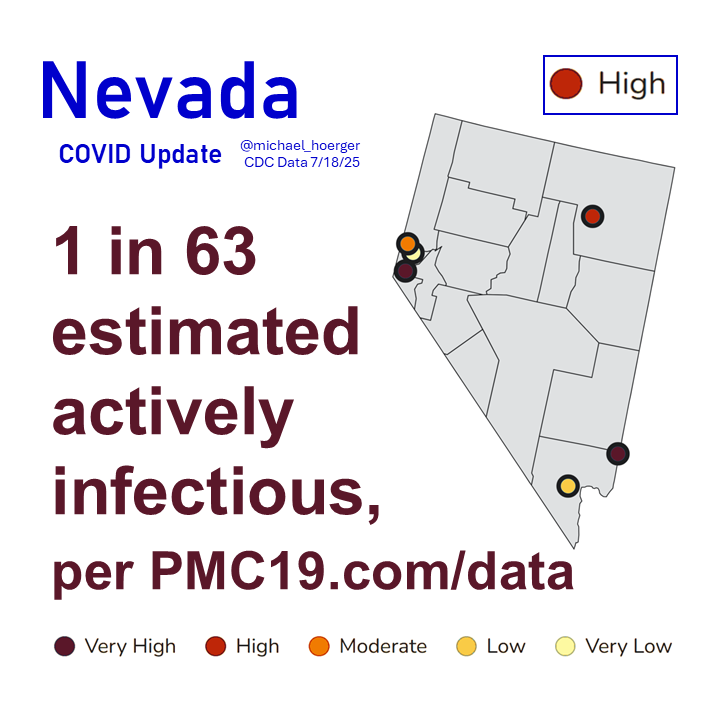
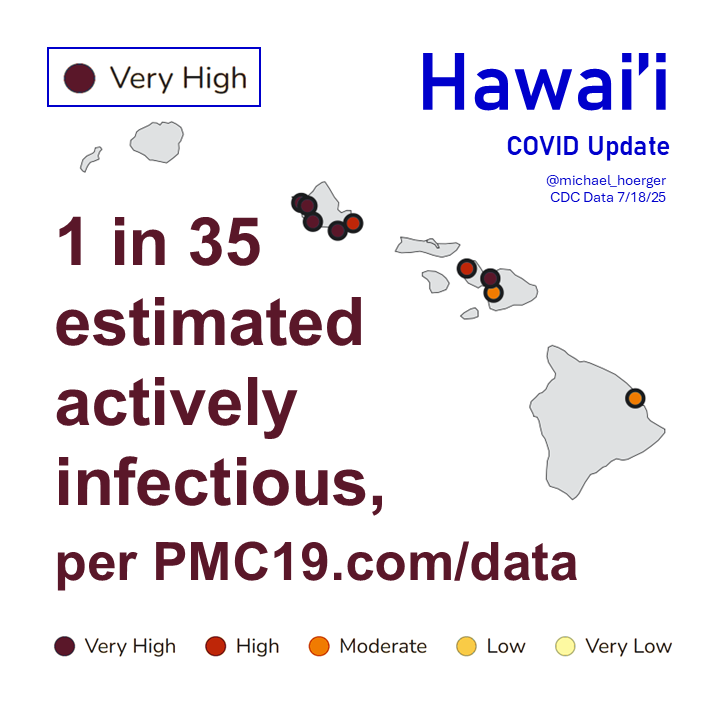
Western surge:
🔹California: 1 in 63 actively infectious, much higher in LA & Bay areas
🔹Hawai'i: 1 in 35 actively infectious
🔹Nevada: 1 in 63 actively infectious
These are wastewater derived estimates, not from individual tests
Western surge:
🔹California: 1 in 63 actively infectious, much higher in LA & Bay areas
🔹Hawai'i: 1 in 35 actively infectious
🔹Nevada: 1 in 63 actively infectious
These are wastewater derived estimates, not from individual tests
3. PMC COVlD Dashboard, July 21, 2025 (U.S.)
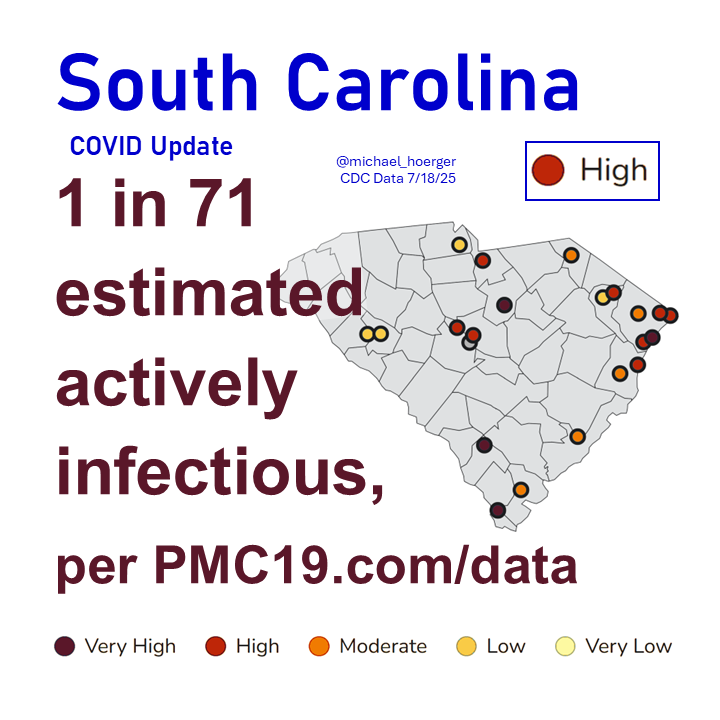
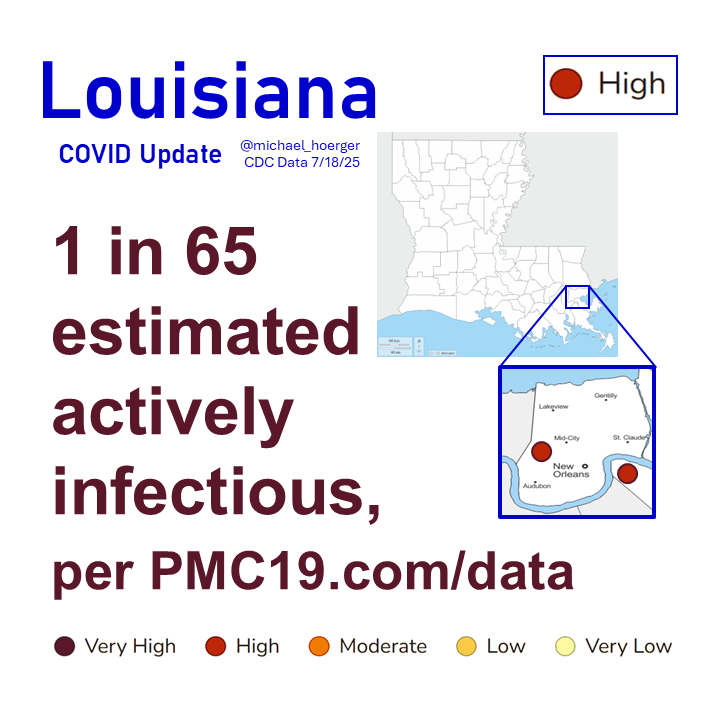
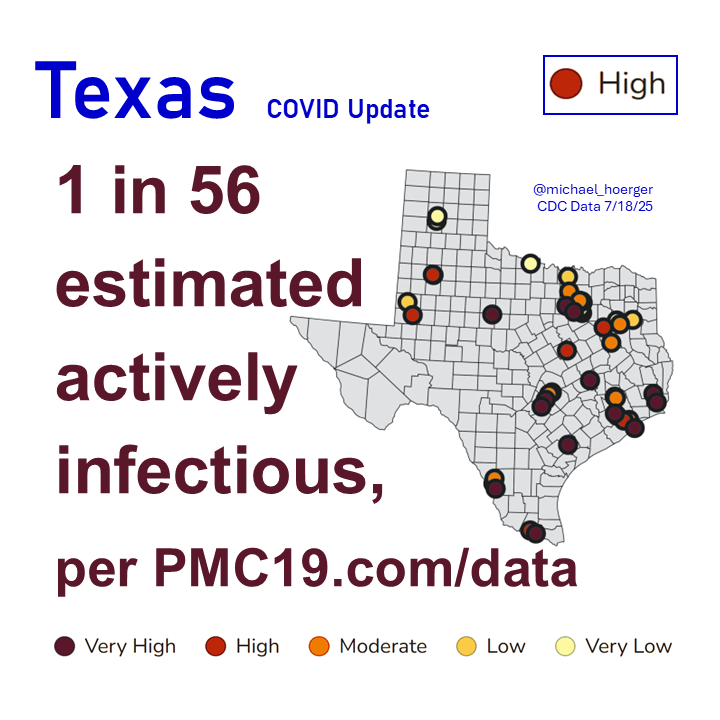
Southern surge:
🔹Texas: 1 in 56
🔹Louisiana (New Orleans): 1 in 65
🔹Florida: 1 in 66
🔹South Carolina: 1 in 71
Again, wastewater estimates (wise indicator), not individual testing (low-quality data).
Southern surge:
🔹Texas: 1 in 56
🔹Louisiana (New Orleans): 1 in 65
🔹Florida: 1 in 66
🔹South Carolina: 1 in 71
Again, wastewater estimates (wise indicator), not individual testing (low-quality data).

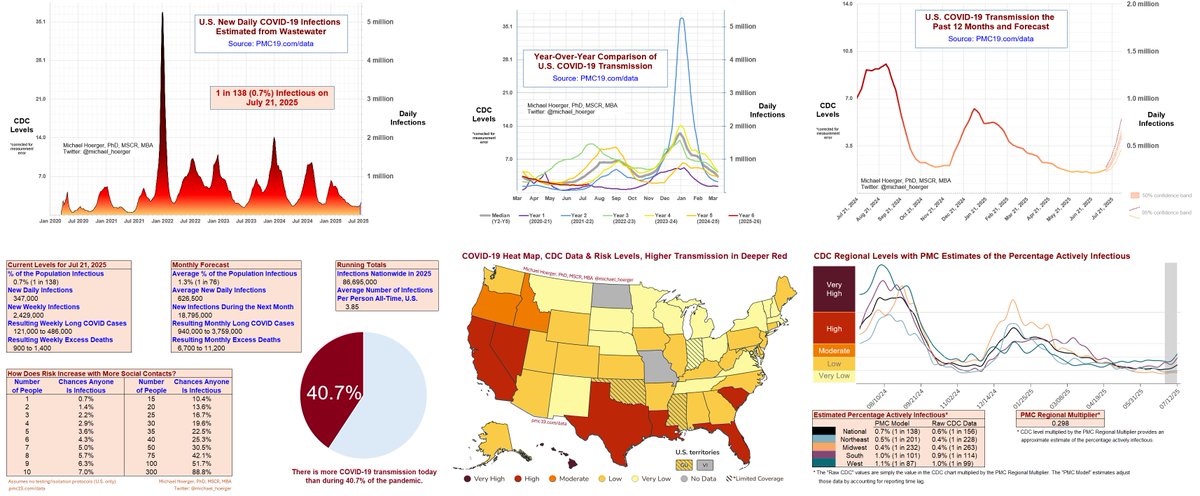
4. PMC COVlD Dashboard, July 21, 2025 (U.S.)
Is it an aberration that transmission is picking up faster in the South and West?
NO.
Same regional pattern in 2024. Same pattern in 2023.
Is it an aberration that transmission is picking up faster in the South and West?
NO.
Same regional pattern in 2024. Same pattern in 2023.
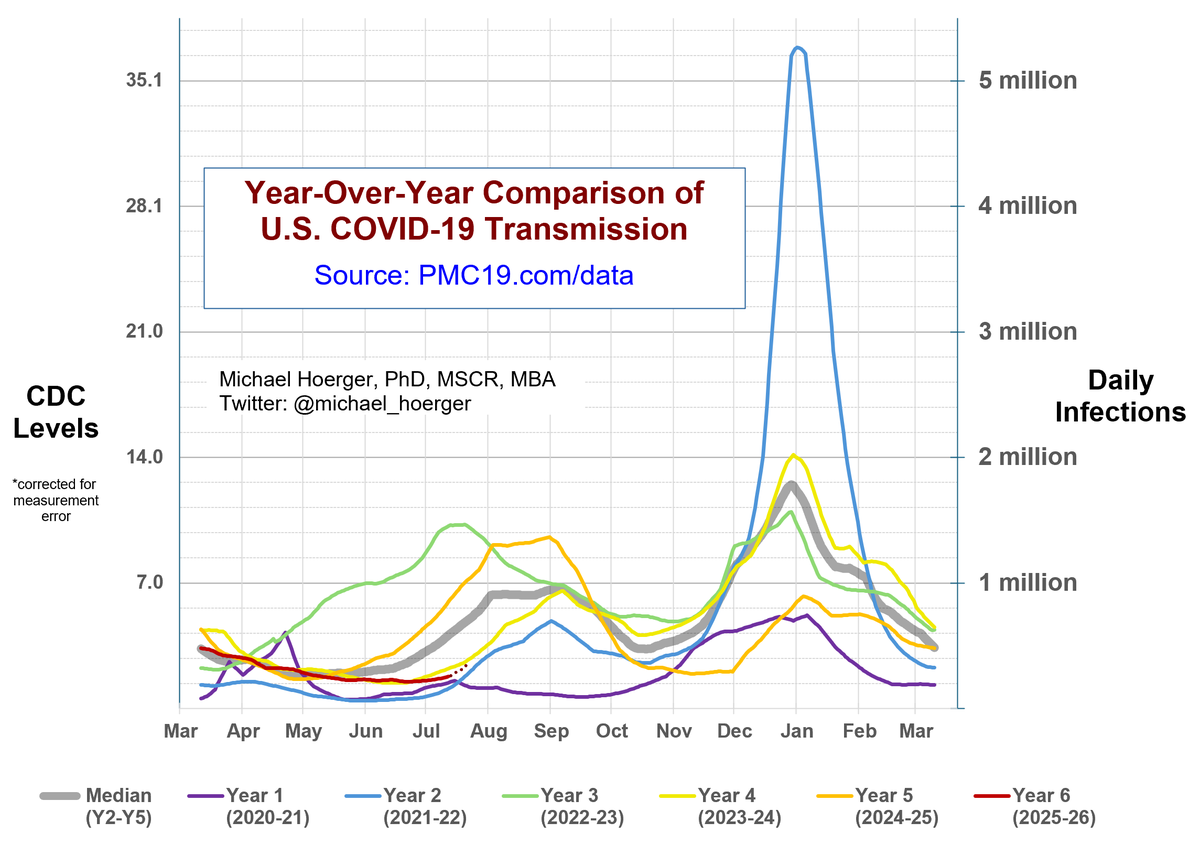
5. PMC COVlD Dashboard, July 21, 2025 (U.S.)
Nationally, current transmission (red line) closely tracks that of 2 years ago (yellow line).
If we were extraordinarily lucky, perhaps it will shift lower, like the blue line. But that was still the terrible Delta wave.
Nationally, current transmission (red line) closely tracks that of 2 years ago (yellow line).
If we were extraordinarily lucky, perhaps it will shift lower, like the blue line. But that was still the terrible Delta wave.
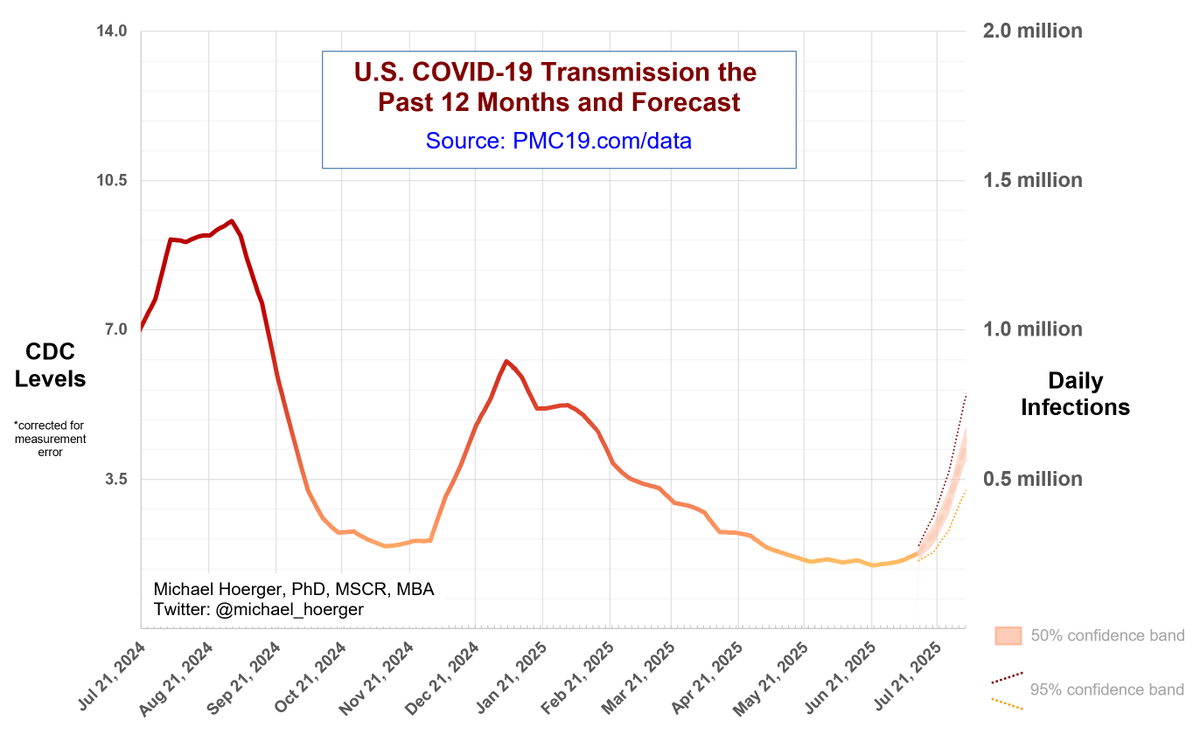
6. PMC COVlD Dashboard, July 21, 2025 (U.S.)
If all continues as anticipated, we will pass 500,000 new daily infections (NDIs) in a week but won't know that for 2 weeks because of reporting lags.
Expect the Midwest and Northeast to pick up soon if following annual trends.
If all continues as anticipated, we will pass 500,000 new daily infections (NDIs) in a week but won't know that for 2 weeks because of reporting lags.
Expect the Midwest and Northeast to pick up soon if following annual trends.
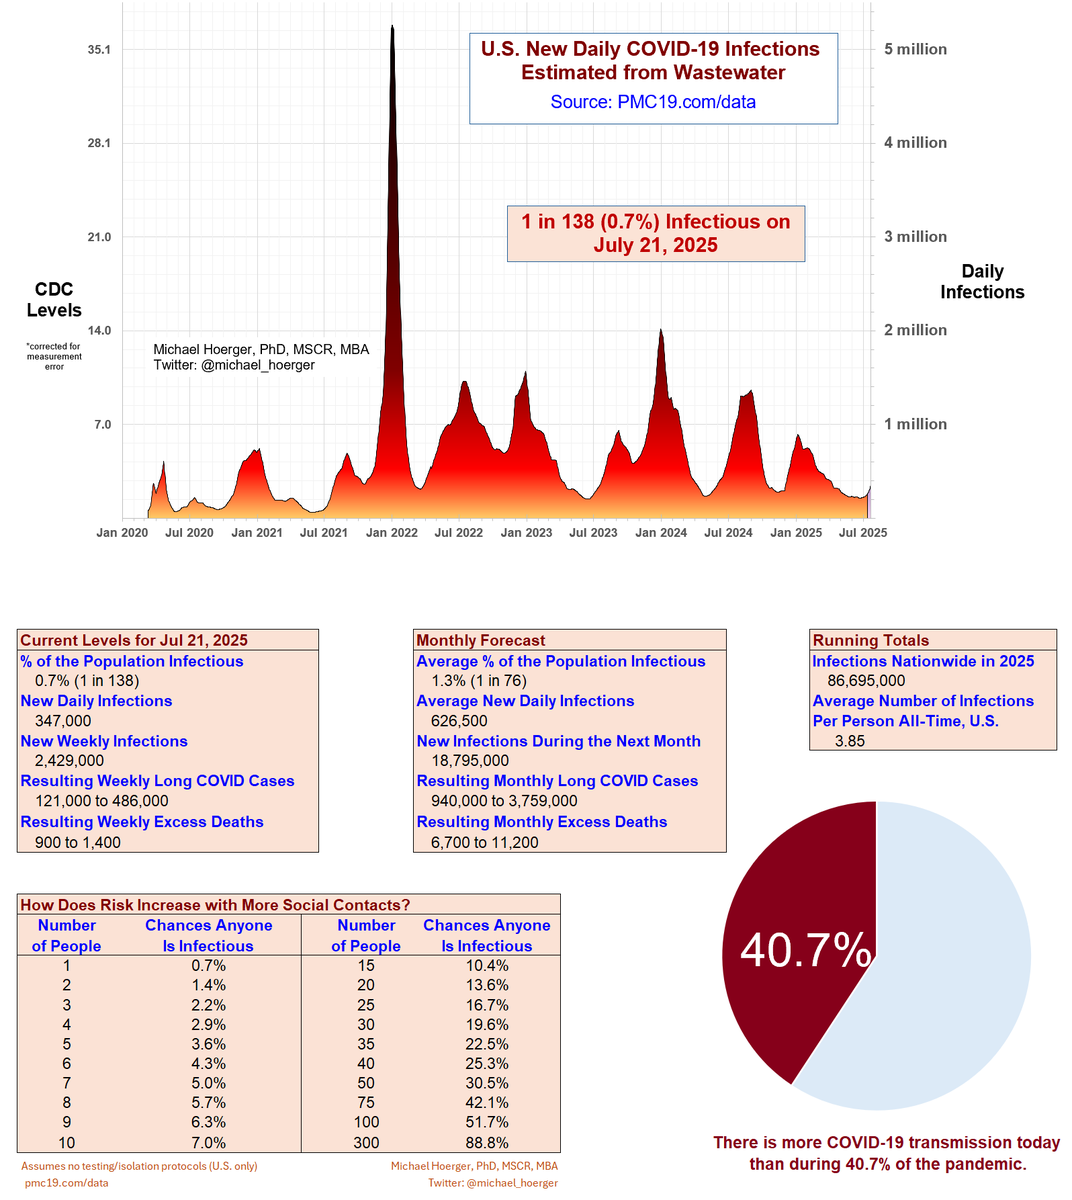
7. PMC COVlD Dashboard, July 21, 2025 (U.S.)
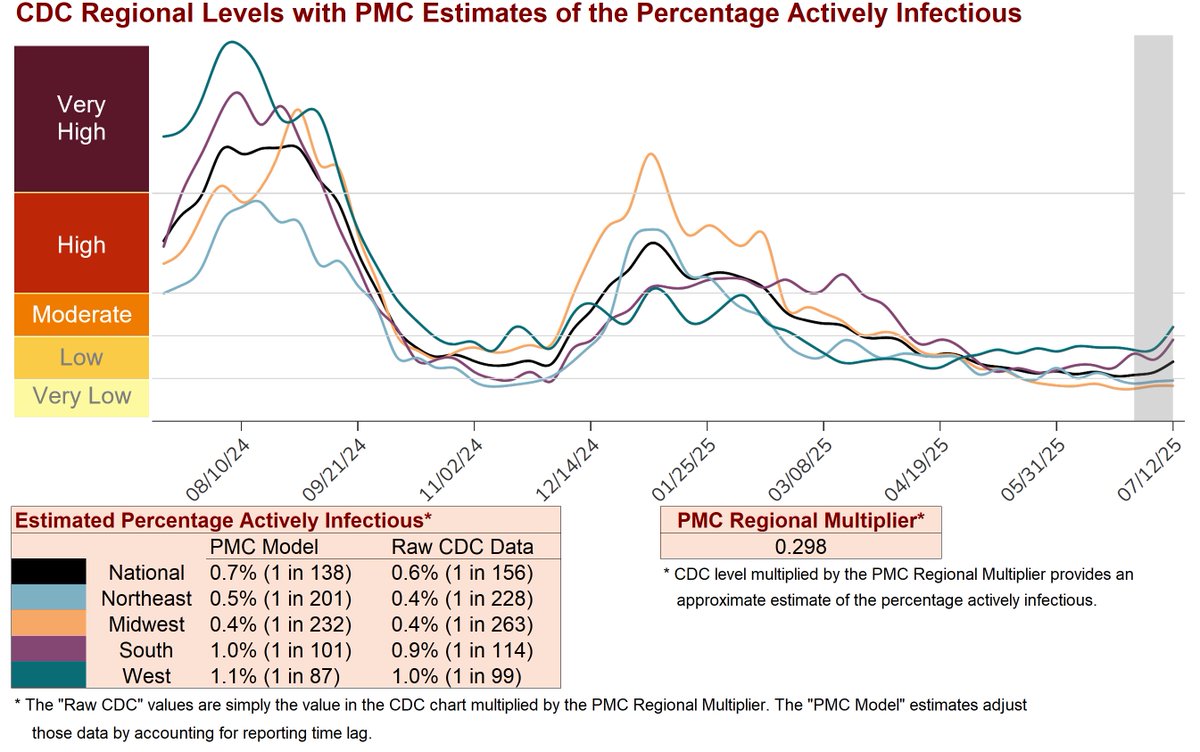
1 in 138 Americans are actively infectious.
That's 2.4 million infections per week, expected to result in 900-1,400 excess deaths.
1 in 138 Americans are actively infectious.
That's 2.4 million infections per week, expected to result in 900-1,400 excess deaths.
8. PMC COVlD Dashboard, July 21, 2025 (U.S.)
Here's a primer on how to get a better sense of what's happening in individual U.S. states. The video is also posted on the dashboard website.
Here's a primer on how to get a better sense of what's happening in individual U.S. states. The video is also posted on the dashboard website.
https://x.com/michael_hoerger/status/1937367671298838978
9. PMC COVlD Dashboard, July 21, 2025 (U.S.)
We have compiled an international directory of high-quality surveillance data. Waves are happening worldwide, but the timing varies based on patterns of NPI mitigation, vaccination, infection, & climate.
We have compiled an international directory of high-quality surveillance data. Waves are happening worldwide, but the timing varies based on patterns of NPI mitigation, vaccination, infection, & climate.
https://x.com/michael_hoerger/status/1940262075068301339
10. PMC COVlD Dashboard, July 21, 2025 (U.S.)
The TODAY Show tracks the PMC Dashboard and recommends wearing N95 masks. I agree.
The TODAY Show tracks the PMC Dashboard and recommends wearing N95 masks. I agree.
https://x.com/michael_hoerger/status/1946788991455379943
11. PMC COVlD Dashboard, July 21, 2025 (U.S.)
In case you missed it, Dr. Malek made an excellent primer on the current medical evidence on COVID that is designed for clinicians.
This is 1,000x better than any Continuing Education (CE) video.
In case you missed it, Dr. Malek made an excellent primer on the current medical evidence on COVID that is designed for clinicians.
This is 1,000x better than any Continuing Education (CE) video.
https://x.com/N95Anaesthetist/status/1936727929297510811
12. PMC COVlD Dashboard, July 21, 2025 (U.S.)
Find the full dashboard at
We've included some of the state-level figures this week. Please share across platforms. It's okay to do so faster/better than me, and much appreciated. pmc19.com/data/
Find the full dashboard at
We've included some of the state-level figures this week. Please share across platforms. It's okay to do so faster/better than me, and much appreciated. pmc19.com/data/
• • •
Missing some Tweet in this thread? You can try to
force a refresh


