Fibonacci Retracement – The Most Misused but Powerful Tool in Trading 🧵
You’ve seen the golden levels:
📍 0.618
📍 0.5
📍 0.382
But do you really know how Smart Money uses Fibonacci?
In this thread:
✅ Fibonacci basics
✅ Secret levels
✅ Entry + SL + Target rules
✅ Swing & Intraday trades
✅ With Order Blocks, OBs & VWAP
👇
#niftycrash
You’ve seen the golden levels:
📍 0.618
📍 0.5
📍 0.382
But do you really know how Smart Money uses Fibonacci?
In this thread:
✅ Fibonacci basics
✅ Secret levels
✅ Entry + SL + Target rules
✅ Swing & Intraday trades
✅ With Order Blocks, OBs & VWAP
👇
#niftycrash
1) What is Fibonacci Retracement?
Fibonacci is based on natural ratios (like 0.618) found everywhere — plants, galaxies, and the markets.
In trading:
We use it to find potential pullback zones within a move.
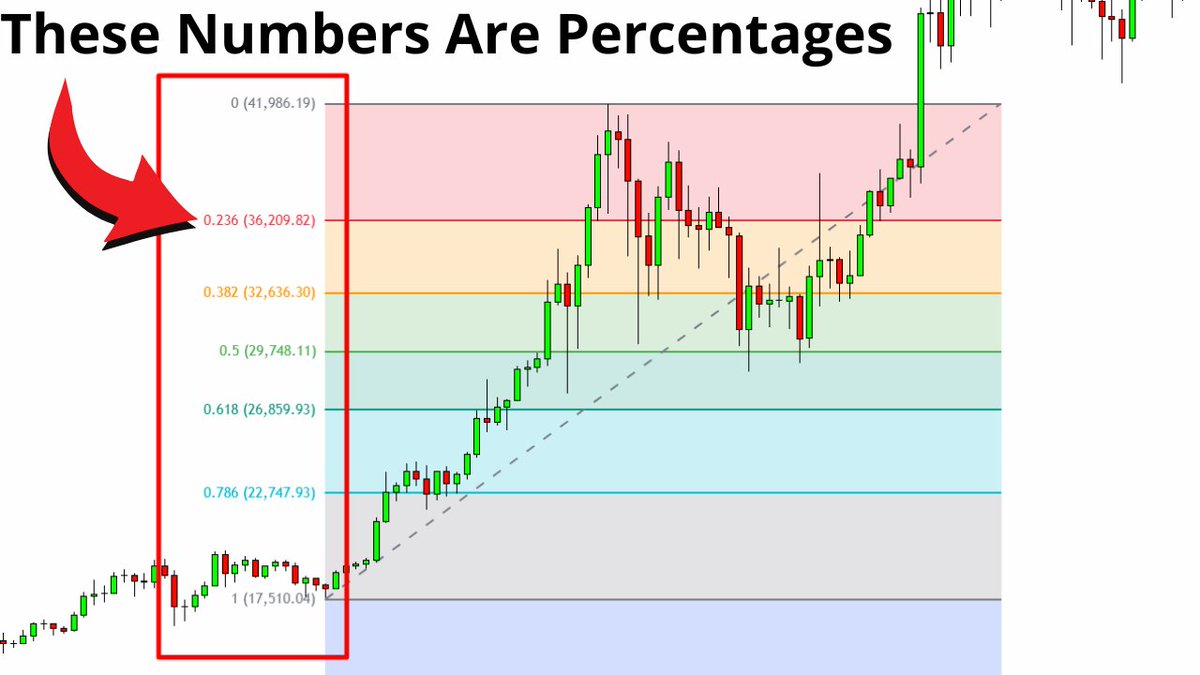
📌 Key Levels:
0.236 → Weak pullback
0.382 → First bounce
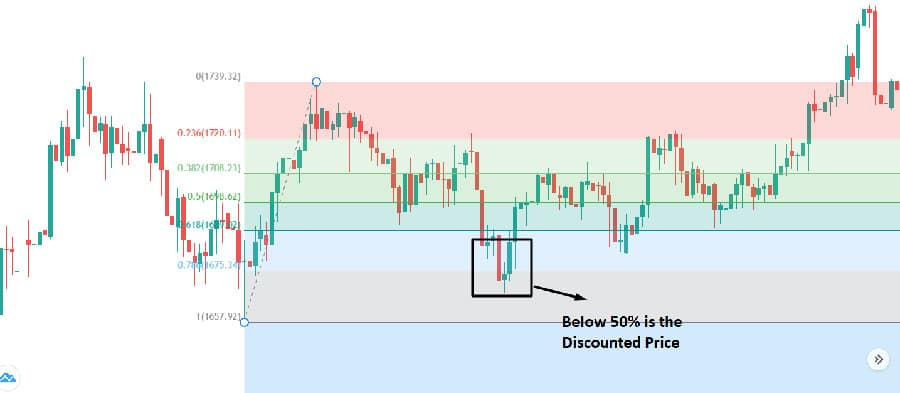
0.5 → Neutral zone (not a true Fib level, but used)
0.618 → Golden retracement
0.786 → Deep retracement (Smart Money favorite)
Fibonacci is based on natural ratios (like 0.618) found everywhere — plants, galaxies, and the markets.
In trading:
We use it to find potential pullback zones within a move.
📌 Key Levels:
0.236 → Weak pullback
0.382 → First bounce
0.5 → Neutral zone (not a true Fib level, but used)
0.618 → Golden retracement
0.786 → Deep retracement (Smart Money favorite)
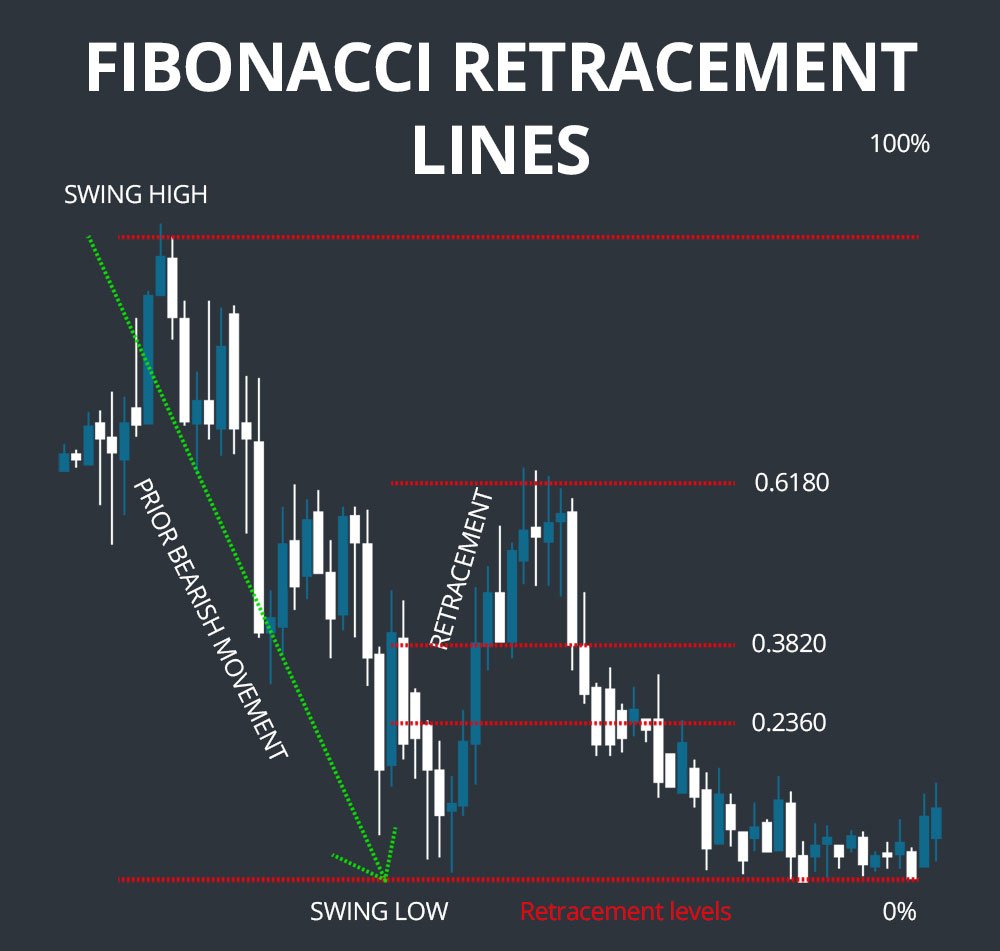
2) How to Plot Fibonacci (Correctly)
❌ Most plot it from random highs/lows.
✅ Here’s the correct way:
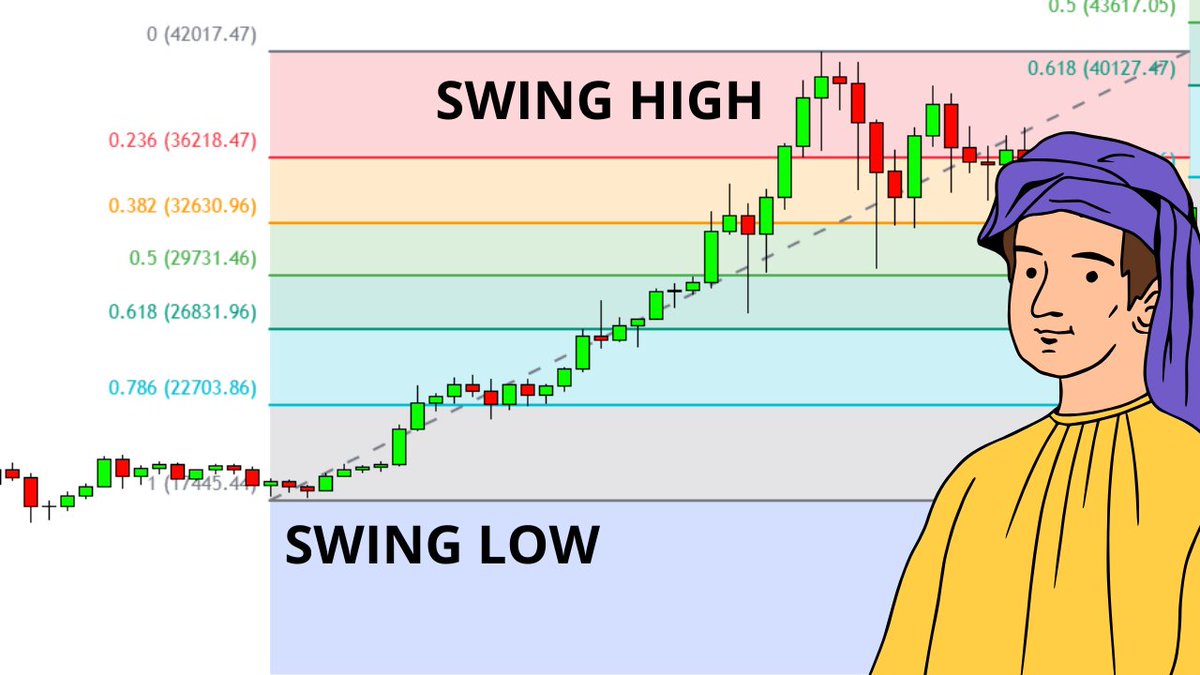
📍 Identify an impulsive move (clear trend leg)
📍 Plot Fib from swing low to swing high (in uptrend)
📍 Or swing high to swing low (in downtrend)
💥 Plot from body-to-body for Smart Money accuracy (not wick)
❌ Most plot it from random highs/lows.
✅ Here’s the correct way:
📍 Identify an impulsive move (clear trend leg)
📍 Plot Fib from swing low to swing high (in uptrend)
📍 Or swing high to swing low (in downtrend)
💥 Plot from body-to-body for Smart Money accuracy (not wick)
3) How Smart Money Uses Fibonacci
Institutions don’t enter at 0.236 or 0.382.
They wait for:
✅ 0.618–0.786 retracement
✅ OB or FVG near that zone
✅ Liquidity sweep below structure
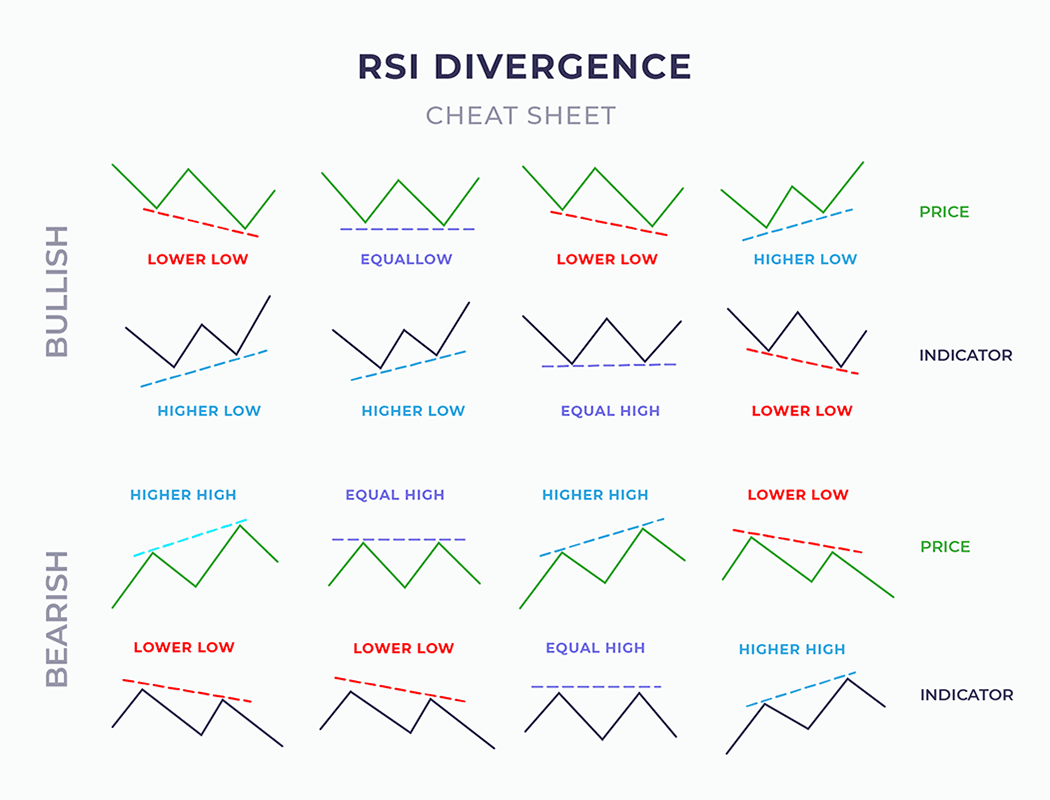
✅ RSI/Volume divergence
✅ Engulfing or trap candle
📍 Then they enter → ride it to new highs/lows.
Institutions don’t enter at 0.236 or 0.382.
They wait for:
✅ 0.618–0.786 retracement
✅ OB or FVG near that zone
✅ Liquidity sweep below structure
✅ RSI/Volume divergence
✅ Engulfing or trap candle
📍 Then they enter → ride it to new highs/lows.
4) Entry Strategy 1: The Golden Entry
📌 Price pulls back to 0.618–0.786 Fib zone
📌 OB or FVG aligns with it
📌 Forms bullish engulfing or rejection wick
🎯 Entry: After confirmation candle
❌ SL: Below 0.786 or trap wick
🎯 Target: 0.0 Fib (swing high) → then Fib extension 1.272, 1.618
💥 Works beautifully for swing trades
📌 Price pulls back to 0.618–0.786 Fib zone
📌 OB or FVG aligns with it
📌 Forms bullish engulfing or rejection wick
🎯 Entry: After confirmation candle
❌ SL: Below 0.786 or trap wick
🎯 Target: 0.0 Fib (swing high) → then Fib extension 1.272, 1.618
💥 Works beautifully for swing trades

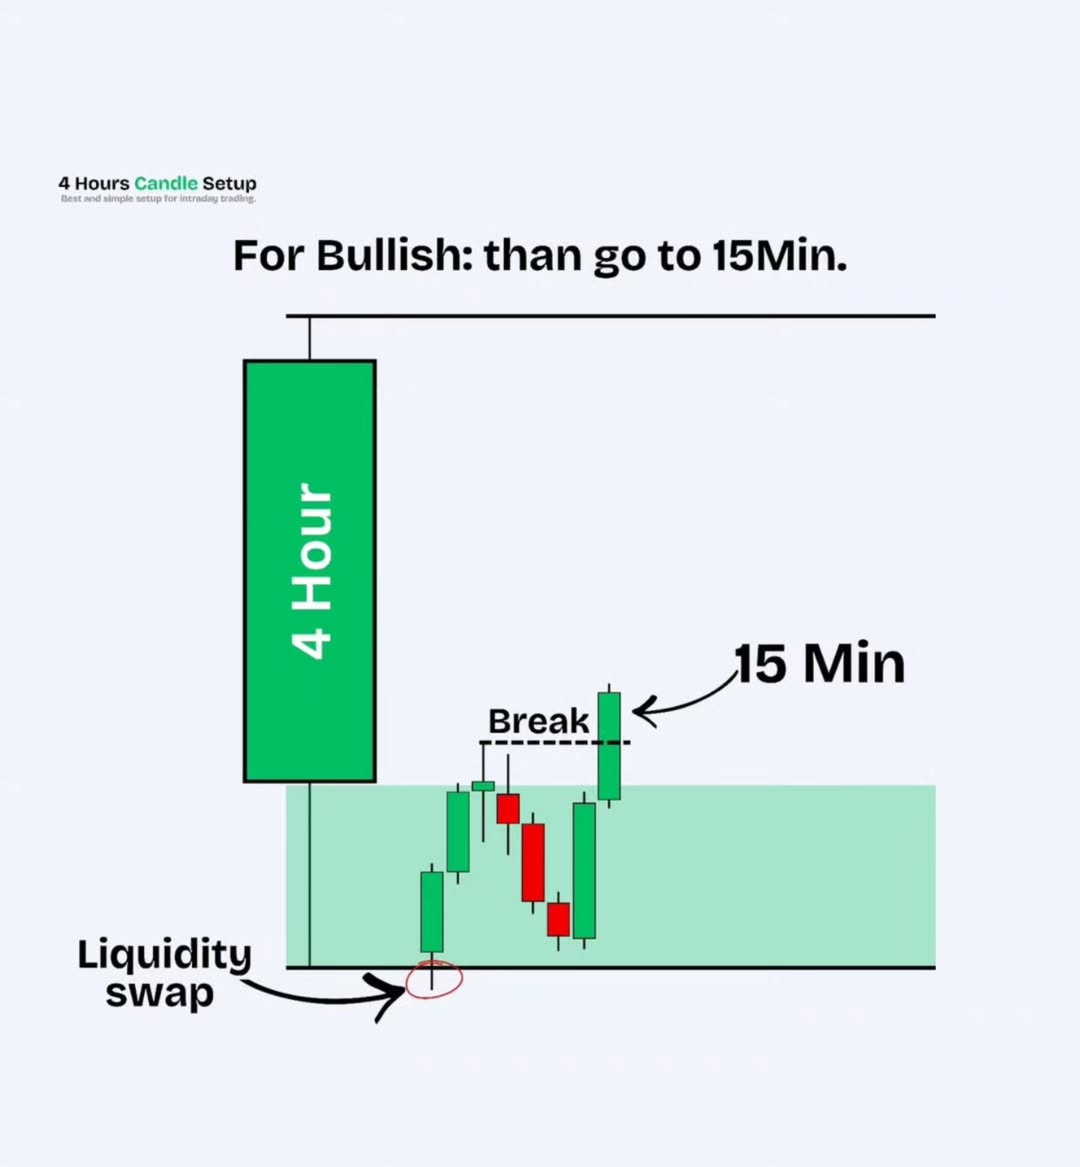
5) Entry Strategy 2: Fib + OB Combo (Intraday)
✅ Mark 15m impulsive leg
✅ Plot Fib on that leg
✅ Drop to 5m or 3m
✅ Look for OB inside 0.618–0.786
✅ Wait for rejection wick or CHoCH
🎯 Buy CE or long futures
❌ SL: Below OB
🎯 Target: Back to swing high → then extension
💡 Great for BankNifty intraday plays
✅ Mark 15m impulsive leg
✅ Plot Fib on that leg
✅ Drop to 5m or 3m
✅ Look for OB inside 0.618–0.786
✅ Wait for rejection wick or CHoCH
🎯 Buy CE or long futures
❌ SL: Below OB
🎯 Target: Back to swing high → then extension
💡 Great for BankNifty intraday plays
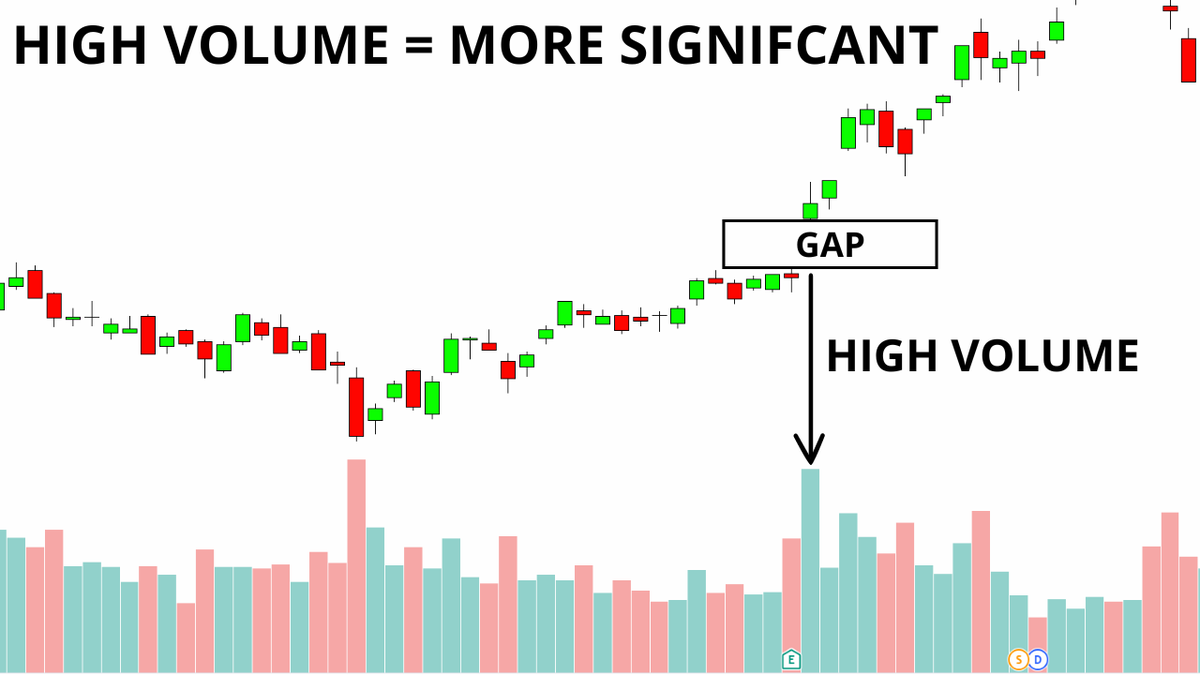
6) Entry Strategy 3: Fib + VWAP + Volume
📌 Price retraces to 0.618
📌 VWAP support nearby
📌 Volume spike on green candle
📌 RSI crosses 40–50 zone
🎯 Buy CE option
❌ SL: Below VWAP
🎯 Target: Fib 0.0 + 1.272
⚠️ Avoid entry if volume is weak or VWAP is broken
📌 Price retraces to 0.618
📌 VWAP support nearby
📌 Volume spike on green candle
📌 RSI crosses 40–50 zone
🎯 Buy CE option
❌ SL: Below VWAP
🎯 Target: Fib 0.0 + 1.272
⚠️ Avoid entry if volume is weak or VWAP is broken
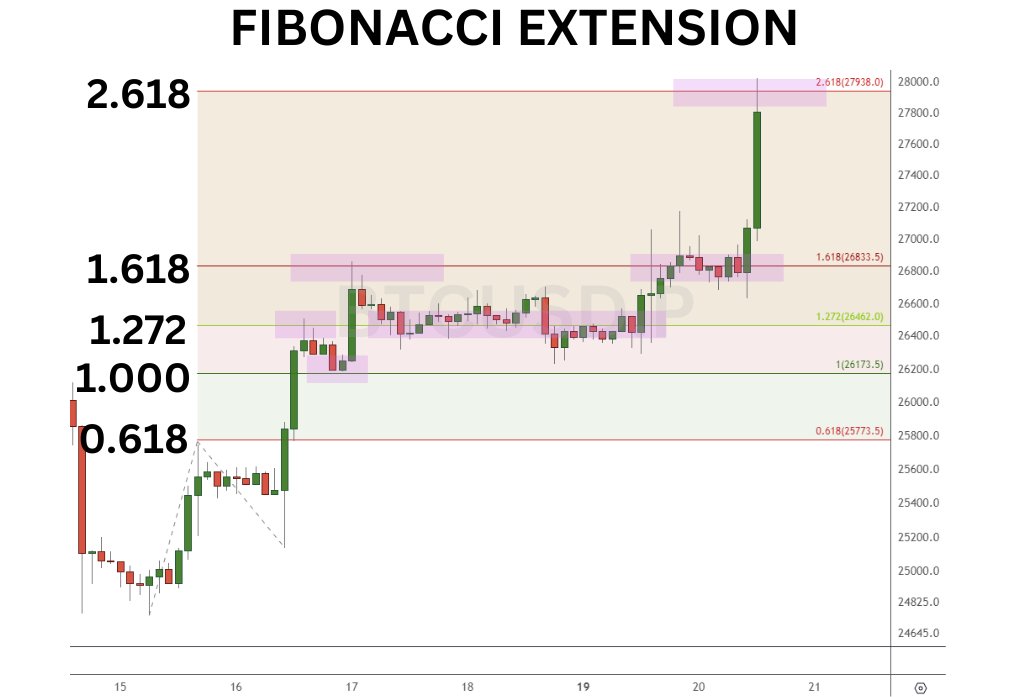
7) Targets Using Fibonacci Extensions
Once price moves past previous high/low (0.0 level), use:
📍 1.272 → conservative target
📍 1.618 → golden target
📍 2.0 → max extension (rare but explosive)
💡 Use these levels for exit planning in options or futures.
Once price moves past previous high/low (0.0 level), use:
📍 1.272 → conservative target
📍 1.618 → golden target
📍 2.0 → max extension (rare but explosive)
💡 Use these levels for exit planning in options or futures.
8) Example – BankNifty 15m Chart
Impulsive rally: 49,500 to 50,100
Pullback to 49,650 (Fib 0.618)
OB + bullish engulfing + VWAP hold
Buy 49,800 CE @ ₹120
Target hit at 50,100 (0.0) → then 1.272 at 50,300 ✅
RR: 1:3+ in < 1.5 hours 🔥
Impulsive rally: 49,500 to 50,100
Pullback to 49,650 (Fib 0.618)
OB + bullish engulfing + VWAP hold
Buy 49,800 CE @ ₹120
Target hit at 50,100 (0.0) → then 1.272 at 50,300 ✅
RR: 1:3+ in < 1.5 hours 🔥
9) Pro Tips for Using Fibonacci
✅ Align Fib levels with:
Order Blocks
Fair Value Gaps
VWAP
CPR
RSI Divergence
✅ Don’t enter blindly at Fib zones
→ Wait for confirmation
✅ Plot Fib on HTF (15m, 1H) and enter on LTF (5m, 3m)
✅ Align Fib levels with:
Order Blocks
Fair Value Gaps
VWAP
CPR
RSI Divergence
✅ Don’t enter blindly at Fib zones
→ Wait for confirmation
✅ Plot Fib on HTF (15m, 1H) and enter on LTF (5m, 3m)
10) Secret Level Most Traders Ignore: 0.705
📌 Hidden institutional level between 0.618 & 0.786
📌 Price often reacts better at 0.705 than 0.618
📌 Smart Money enters here when OB sits exactly at 70.5%
🎯 Try it in your charts — sniper entries await 😎
📌 Hidden institutional level between 0.618 & 0.786
📌 Price often reacts better at 0.705 than 0.618
📌 Smart Money enters here when OB sits exactly at 70.5%
🎯 Try it in your charts — sniper entries await 😎
• • •
Missing some Tweet in this thread? You can try to
force a refresh