Gaps, High Total Volume, High and Low TRIN readings, and short term Breadth Surges can signal at both market bottoms and tops. (See academia.edu/18668085/Bound… miltonberg.com
In our recent reports we have listed extremely low TRIN levels as well as potential exhaustive upside gaps as signs of an impending market peak.
The S&P 500 and NASDAQ closed at new all-time highs. Yet, the S&P 600 declined -1.58% on the day. 3-day NASDAQ volume was highest in history. (We exclude option expiration days and rebalancing days from the data). 5-day NASDAQ volume was highest in history.
NASDAQ has traded above its 5-day average for 23 consecutive days. NASDAQ TRIN closed at a near historic low 0.22. This is the 3rd lowest reading in history.
High volume is an important signal of a turning point. For example in 1987 two weeks and -1.03% before the final peak, the S&P 500 and NASDAQ both generated record volume.
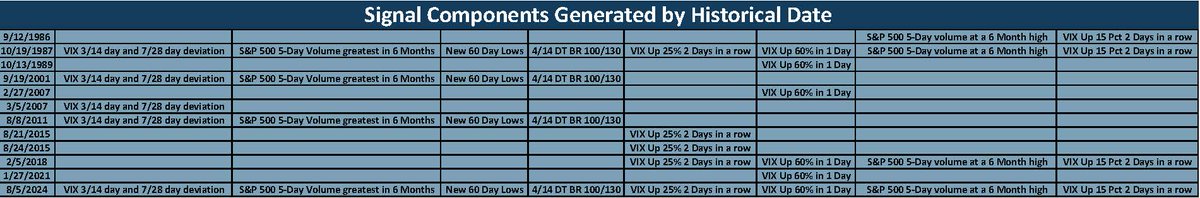
When high volume is generated in combination with standard market indicators it often generates precise and robust signals.
There has never been a day in history when NASDAQ 3-day and 5-day volume were at records and VIX deviation from its 20 day average was as low as it was yesterday.
There has never been a day in history when NASDAQ traded above its 5-day average for 23 days and TRIN traded at 0.30 or lower.
There has never been a day in history when NASDAQ traded above its 5-day average for 23 days and 3-day volume or 5-day was at a record.
On January 27, 2021, NASDAQ 5-day volume was greatest in 200 days, and NASDAQ TRIN closed below 0.30. The speculative mania then in effect peaked two-weeks later on February 12 when the infamous ARKK (ARK Innovative ETF) peaked and declined -81.07%.
Renaissance IPO Equity ETF peaked as well and declined -68.76%. (The broad market continued higher.)
Again, January 7, 2025, NASDAQ 5-day volume was greatest in 200 days, NASDAQ TRIN closed below 0.30, NASDAQ had peaked on December 16 and was churning at the top. It held near the high until February 19 and then declined in its Bear market.
NASDAQ has gained 17 of 21 days. NDX is at an all-time high. Similar action, on June 13, 1990, January 14, 1994, July 31, 1997, July 15, 1998, August 28, 2018 and July 10, 2024 were followed by declines in the S&P 500 of -19.03%, -7.57%, -8.10%, -18.51%, -18.85% and -7.94%.
The combination of record volume, low TRIN, gaps into a high, divergences at the highs VIX deviation, upside streaks double tops (BKX on a long term basis S&P 500 and NASDAQ on a 5-7 month basis), which may suggest caution
Our trading model for our retail newsletter has been positioned 100% long VOO since April 8. Our institutional Clients have been offered more nuanced long, leveraged long and sector exposure.
• • •
Missing some Tweet in this thread? You can try to
force a refresh
This is excerpted from today's institutional report. We are positioned 145.12% long equities. The S&P 500 and NASDAQ closed at new highs.miltonberg.com
The S&P 500 closed at 6173.07. Based on the data in our projections table which lists 43 buy signals generated in April and May, the S&P 500 median of the minimum projections by April 7, 2026 are 6400.57 and 6505.49.
These levels represent additional gains of +3.68% and +5.38%. Based on the data in our projections table the S&P 500 median of the median projections are 7135.82 and 7042.87. These levels represent additional gains of +15.59% and +14.09%.
Institutional Investors and Family offices only, contact us on our website. We are again open to new subscribers. Feel Free to Re-Tweet.miltonberg.com
This is an excerpt of our latest research report. We publish similar data 3-9 times a week depending on the market environment. Our model stock portfolio is available upon request.
We remain positioned +33.25% long equities. The "Technical's at the High" data suggests an extremely vulnerable market. However, the strong and robust buy signals generated in November still remain valid.
This will be our last post for a while. Here our our latest thoughts.
We have not yet seen further confirmation that the August 5 buy indications based on oversold lows will hold.
Declines to intraday lows of NDX -15.61% and SOX -27.65% are sufficient to generate a tradable low.
With a series of Montgomery turn cycle dates beginning on August 15, we are expecting heightened volatilitymiltonberg.com
The action since the July 16 top is inconsistent with action in the past which lead to an accelerating declines. Volume has risen too quickly, and VIX has expanded too dramatically.
Measured sentiment has declined to multi year lows, and sharp rates of change to the downside have occurred too early in the move. However, long term sentiment and valuation measures allow for negative surprises. Additionally deflationary forces are evident.
Bullish Get-Ready-to-Buy Signals
When the indicators currently in place have been generated in the past, a market correction was near its end. The latest swift market correction may have generated a tradable low.
Unlike the signals generated in late October, the current bullish indications are most consistent with market gains of +7-15% rather than the +20-+30% generated off the October lows.
Today’s strong gains are occurring on Day-4 off a low. August 5 intraday low was reversed at the open, and the low print in the S&P 500 and NASDAQ occurred at the 9:30am opening print, it is proper to consider August 5 as Day-1 of a rally attempt.
My report for today begins as follows. After preparing this report, we discovered that a significant portion of the record NASDAQ volume was caused by CKRN, a penny meme stock which traded 3 billion shares yesterday. This report may therefore prove immaterial.
The market has been producing exceptionally rare and potentially powerful signals. Whether these signals lead to a market peak or to upside acceleration is not clear, as we shall demonstrate.
We see a high probability of greater than random upside or downside volatility ahead. Based on recent indicator action, there is clearly non-random action ahead of us.
Composite volume on NASDAQ has been greatest in more than 1000 days.
Despite the S&P 500 rising by +6.86% over 19 days from its recent -5.46% correction low, our models have not indicated that this is a sustainable and continuing market rally.miltonberg.com
Indexes that closed at 52-week highs, did so on upside gaps and extraordinarily heavy volume. As noted in previous reports, gaps and high volume are not randomly distributed. When gaps and volume
occur into or out of a market low, it adds probability to a bullish outcome.
When gaps and volume
occur into or out of a market low, it adds probability to a bullish outcome. Those same indicators,
after a long and sustained market advance, may suggest a final surge and upside capitulation
before a reversal.