MB Advisors Institutional Research
info@miltonberg.com
https://t.co/DLmwNx0gBU
"Milton Berg's
Guide to Technical Analysis and the Stock Market"
Target 2025
11 subscribers
Jul 25, 2025 • 14 tweets • 3 min read
Gaps, High Total Volume, High and Low TRIN readings, and short term Breadth Surges can signal at both market bottoms and tops. (See academia.edu/18668085/Bound… miltonberg.com
In our recent reports we have listed extremely low TRIN levels as well as potential exhaustive upside gaps as signs of an impending market peak.
Jun 30, 2025 • 12 tweets • 2 min read
This is excerpted from today's institutional report. We are positioned 145.12% long equities. The S&P 500 and NASDAQ closed at new highs.miltonberg.com
The S&P 500 closed at 6173.07. Based on the data in our projections table which lists 43 buy signals generated in April and May, the S&P 500 median of the minimum projections by April 7, 2026 are 6400.57 and 6505.49.
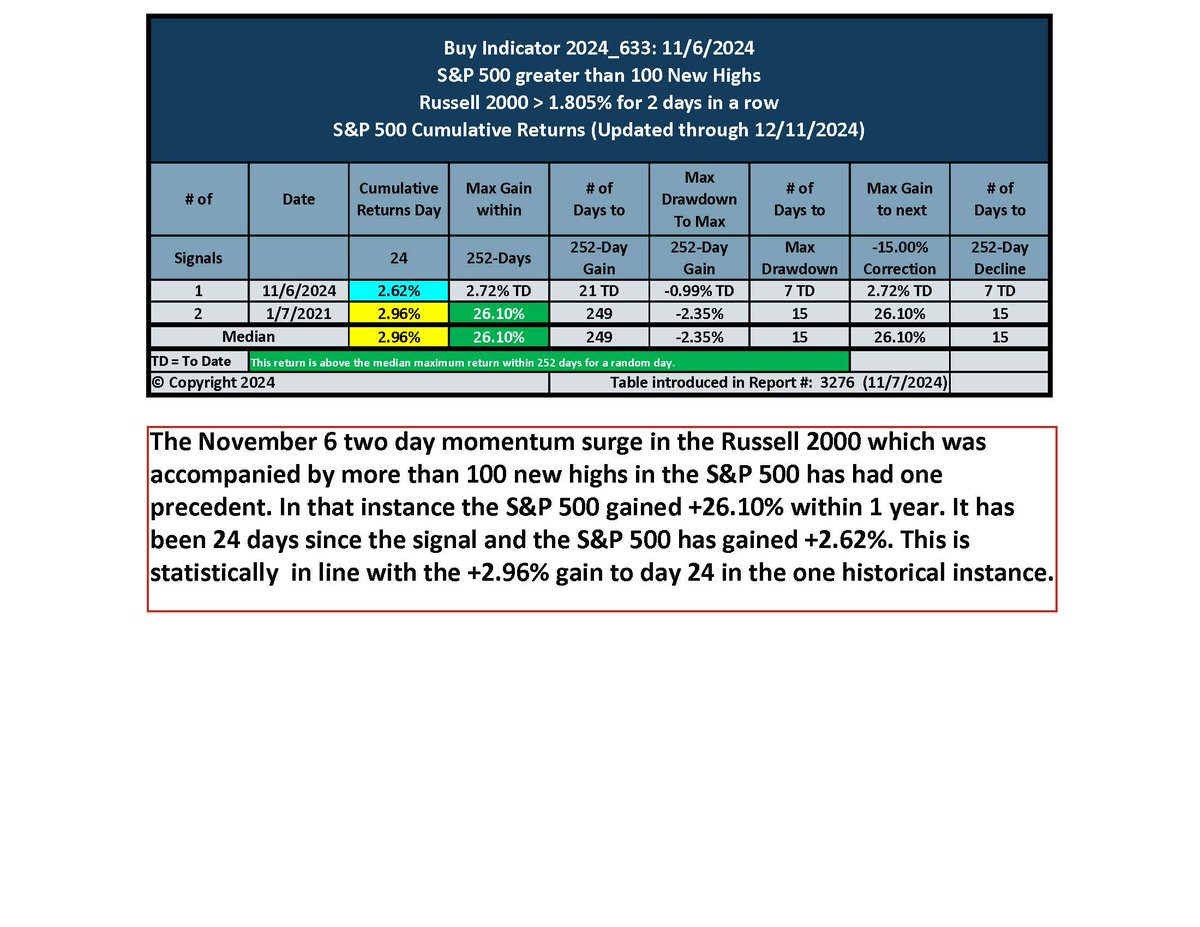
Dec 12, 2024 • 20 tweets • 8 min read
Institutional Investors and Family offices only, contact us on our website. We are again open to new subscribers. Feel Free to Re-Tweet.miltonberg.com
This is an excerpt of our latest research report. We publish similar data 3-9 times a week depending on the market environment. Our model stock portfolio is available upon request.
Aug 12, 2024 • 7 tweets • 2 min read
This will be our last post for a while. Here our our latest thoughts.
We have not yet seen further confirmation that the August 5 buy indications based on oversold lows will hold.
Declines to intraday lows of NDX -15.61% and SOX -27.65% are sufficient to generate a tradable low.
With a series of Montgomery turn cycle dates beginning on August 15, we are expecting heightened volatilitymiltonberg.com
The action since the July 16 top is inconsistent with action in the past which lead to an accelerating declines. Volume has risen too quickly, and VIX has expanded too dramatically.
Aug 8, 2024 • 6 tweets • 1 min read
Bullish Get-Ready-to-Buy Signals
When the indicators currently in place have been generated in the past, a market correction was near its end. The latest swift market correction may have generated a tradable low.
Unlike the signals generated in late October, the current bullish indications are most consistent with market gains of +7-15% rather than the +20-+30% generated off the October lows.
May 17, 2024 • 9 tweets • 2 min read
My report for today begins as follows. After preparing this report, we discovered that a significant portion of the record NASDAQ volume was caused by CKRN, a penny meme stock which traded 3 billion shares yesterday. This report may therefore prove immaterial.
The market has been producing exceptionally rare and potentially powerful signals. Whether these signals lead to a market peak or to upside acceleration is not clear, as we shall demonstrate.
May 16, 2024 • 25 tweets • 4 min read
Despite the S&P 500 rising by +6.86% over 19 days from its recent -5.46% correction low, our models have not indicated that this is a sustainable and continuing market rally.miltonberg.com
Indexes that closed at 52-week highs, did so on upside gaps and extraordinarily heavy volume. As noted in previous reports, gaps and high volume are not randomly distributed. When gaps and volume
occur into or out of a market low, it adds probability to a bullish outcome.
Apr 16, 2023 • 6 tweets • 1 min read
The underlying market appears stronger than the weighted averages. On March 31, 5-day A/D was
greatest in over a year. A trade above the March or April highs would confirm the bullish message
of this 5-day Breadth Thrust.
The 5-day Breadth Thrust occurred in an environment of high volume as NYSE 5-day volume was greatest in >375 days within 20 days of the Breadth Thrust. In 3 of four
instances in the past gains within 12 months of +26%, +30%, +20% and +47% followed this signal.
Apr 16, 2023 • 7 tweets • 2 min read
Gold is traded lower on Friday. It had broken below both its April 5 and March 20 Cycle date peaks. The intraday decline decline of -2.75% was greatest since the -2.98% decline on Day-1 past its February 2 intraday peak.
Spot Gold at Thursday's peak of $2048.74 was within 1.29% of
its all-time high print of $2075.47 on August 7, 2020.
Consolidations and pullbacks near a previous
high are expected.
Apr 14, 2023 • 10 tweets • 2 min read
The S&P 500 ended a corrective decline of -7.75% on March 13.
On March 14 in Report NO. 2875, we stated the following: 1. The 3-day put-to-call ratio is at an extreme 2. The percentage of stocks closing below their 10-day averages reversed from an oversold extreme.
3. 3-day volume on the S&P 400 Mid-Cap index is at a 500 day high 4. 95% of the S&P 600 closed below their 10-day average 5. VIX gained >35% over a 3-day period
6.These oversold readings are a good prelude to a potential low
Aug 17, 2022 • 7 tweets • 2 min read
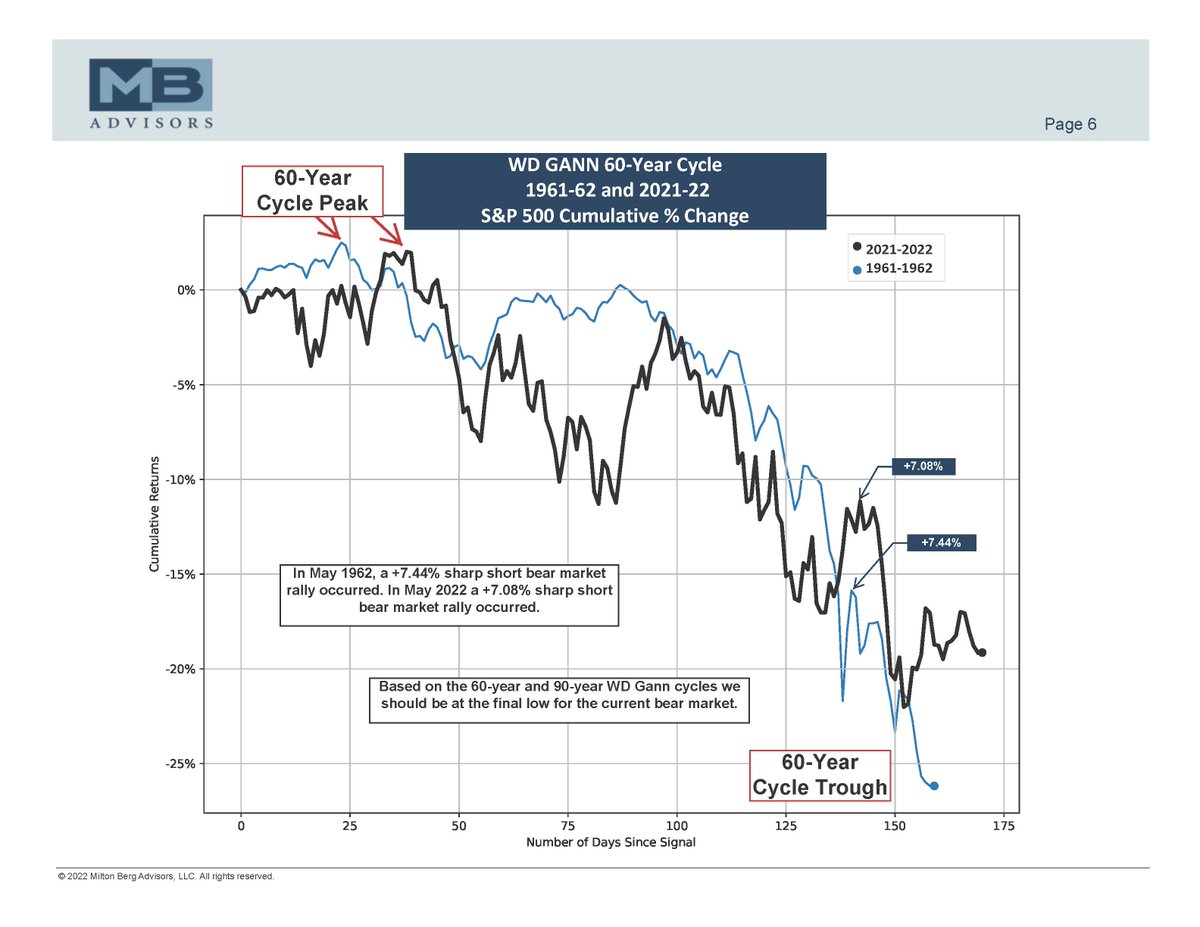
The Great Bear market of 1929-1932 (Dow Jones Industrials -89.19%) ended on July 8, 1932. A WD Gann bear market bottom is predicted 90 years later, plus or minus 2 months. Based on the WD Gann 90-year cycle, a low was expected between June and August 2022.
The latest low for the current bear market was on June 16. Note that a rally peak occurred on November 9, 1931. In 2021, Russell 2000 peaked on November 8, NASDAQ peaked on November 19 and the S&P 500 peaked on January 3, all within the 90-year cycle window.
Aug 16, 2022 • 7 tweets • 1 min read
If this were a Bear Market Rally then the S&P 500 gain of +17.19% off the decline of -23.55% would be the GREATEST bear market rally ever after an interim bear market decline of -27.77% or less
If this were a Bear Market Rally then the NASDAQ gain of +22.52% off the decline of -33.70% would be the GREATEST bear market rally ever in NASDAQ after an interim bear market decline of -37% or less