Mastering Bollinger Bands – From Beginner to Pro 🧵
You’ve seen the upper & lower bands on charts…
But did you know Bollinger Bands can reveal:
✅ Volatility traps
✅ Breakout zones
✅ Smart Money entries
✅ Mean reversion setups
✅ Options scalping triggers?
Let’s break it all down 👇
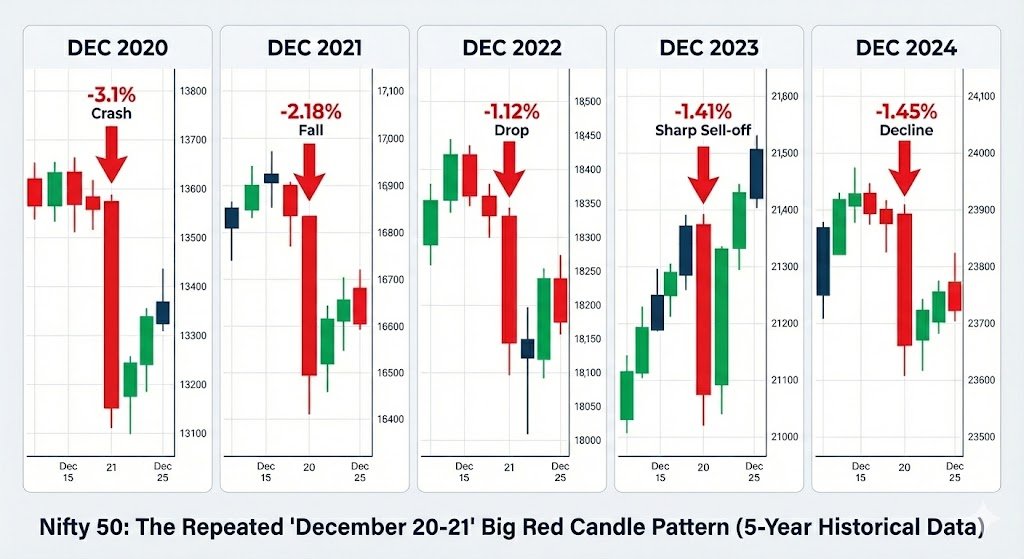
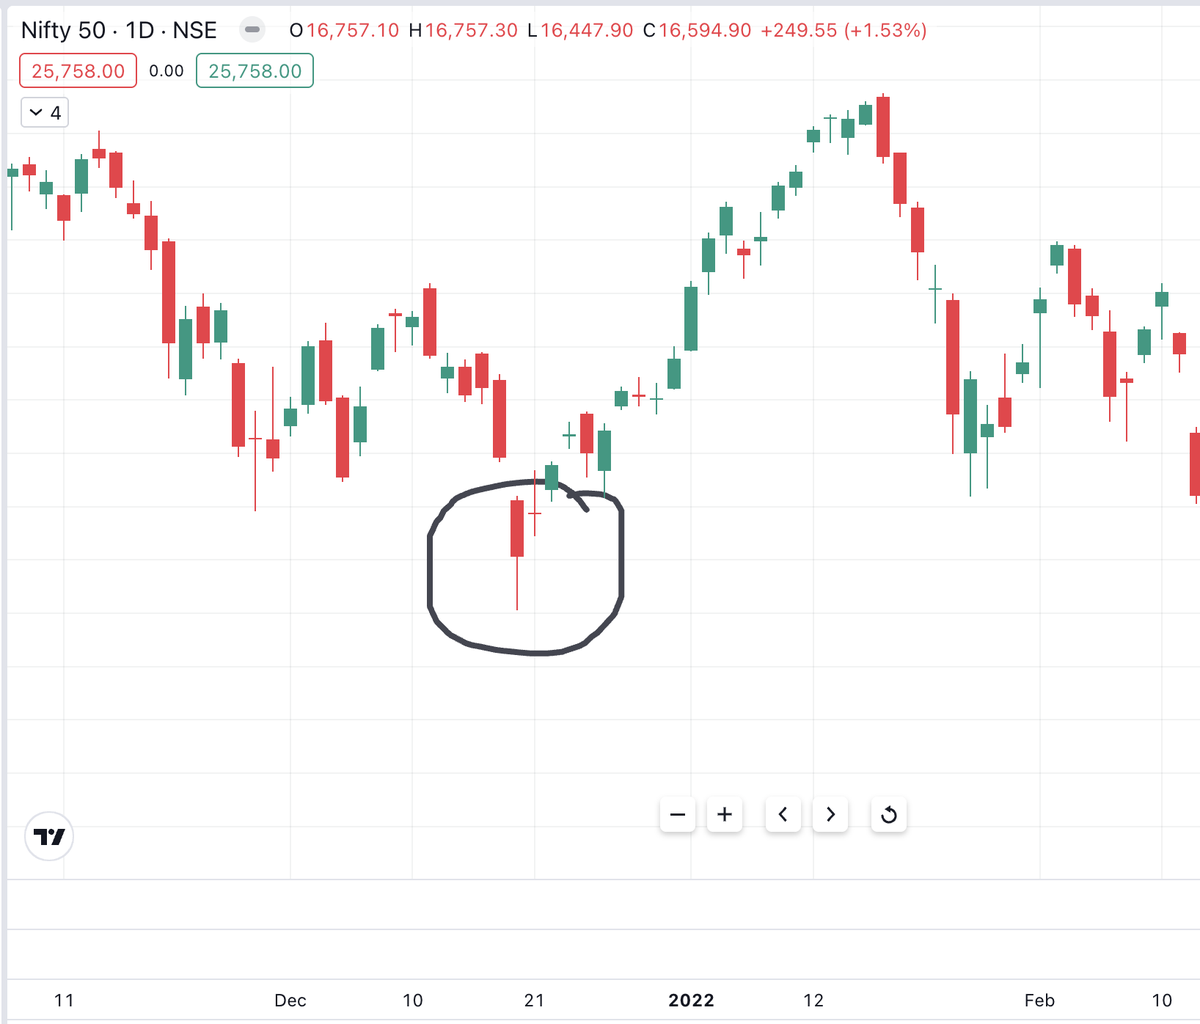
#niftycrash
You’ve seen the upper & lower bands on charts…
But did you know Bollinger Bands can reveal:
✅ Volatility traps
✅ Breakout zones
✅ Smart Money entries
✅ Mean reversion setups
✅ Options scalping triggers?
Let’s break it all down 👇
#niftycrash
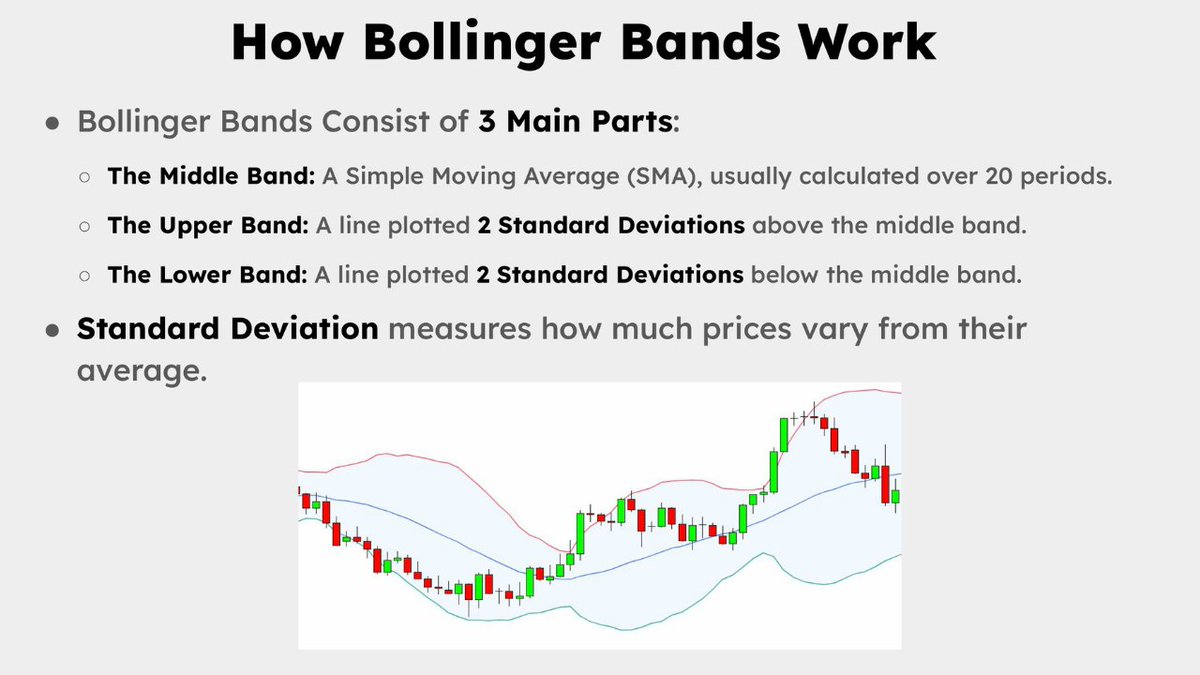
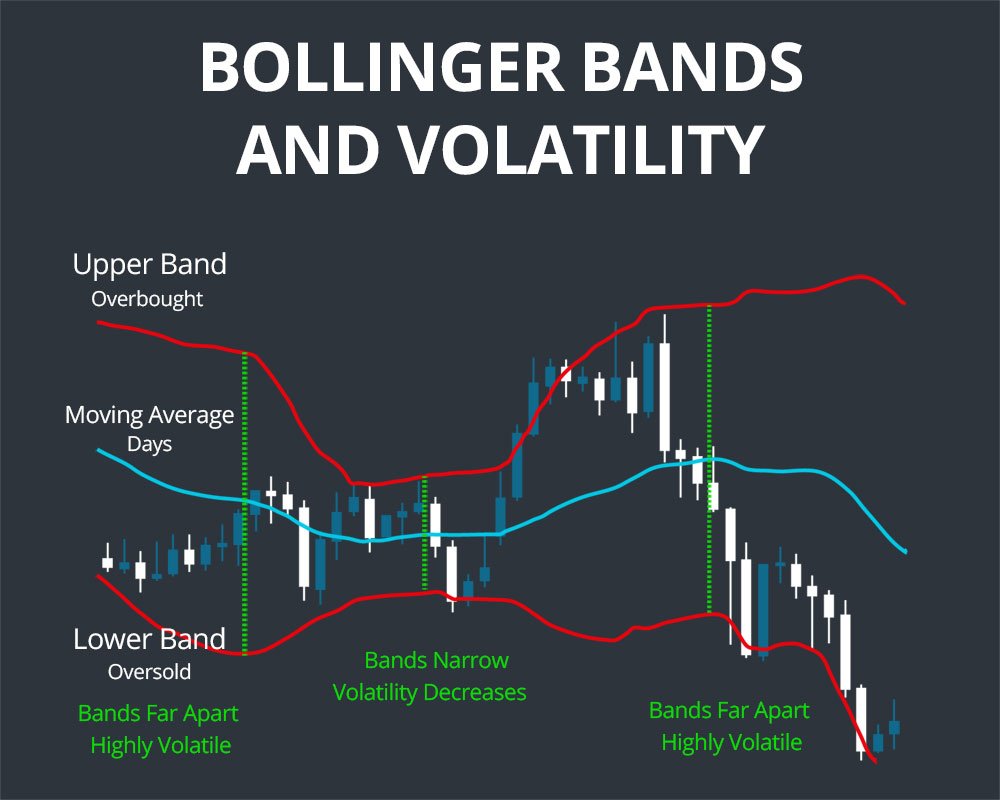
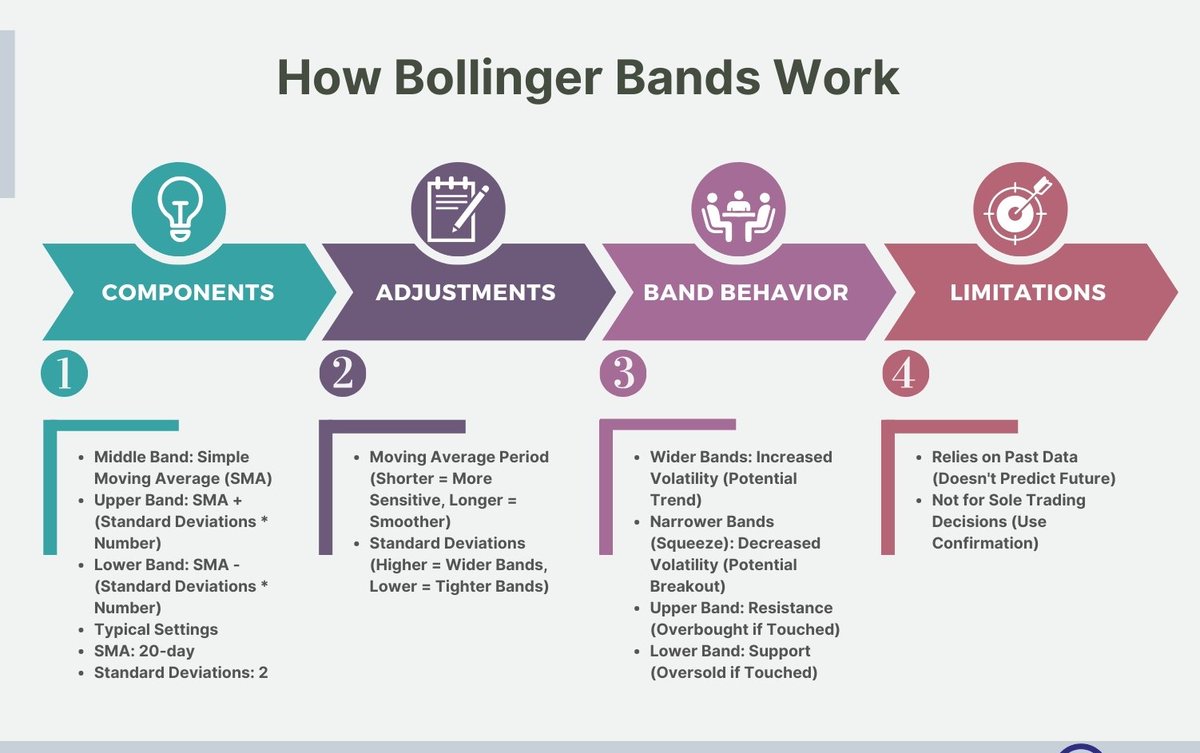
1) What Are Bollinger Bands?
Bollinger Bands consist of 3 lines:
Middle Band: 20-period Simple Moving Average (SMA)
Upper Band: SMA + 2 standard deviations
Lower Band: SMA - 2 standard deviations
📌 They show volatility & extremes in price
Think of them as volatility boundaries
Bollinger Bands consist of 3 lines:
Middle Band: 20-period Simple Moving Average (SMA)
Upper Band: SMA + 2 standard deviations
Lower Band: SMA - 2 standard deviations
📌 They show volatility & extremes in price
Think of them as volatility boundaries
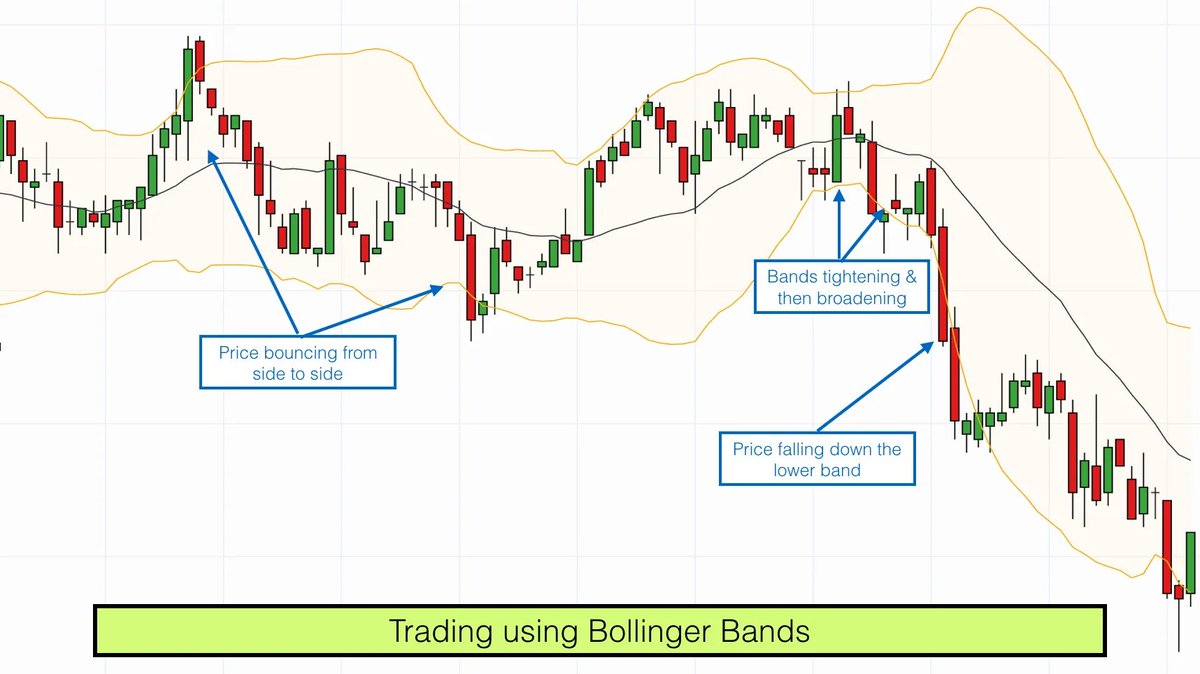
2) Core Concepts
🔹 Price expands outside bands = volatility breakout
🔹 Price compresses between bands = low volatility
🔹 Price returns to middle band = mean reversion
🔹 Bands squeeze tight = explosive move coming
🔹 Bands wide apart = reversal zone incoming
🔹 Price expands outside bands = volatility breakout
🔹 Price compresses between bands = low volatility
🔹 Price returns to middle band = mean reversion
🔹 Bands squeeze tight = explosive move coming
🔹 Bands wide apart = reversal zone incoming
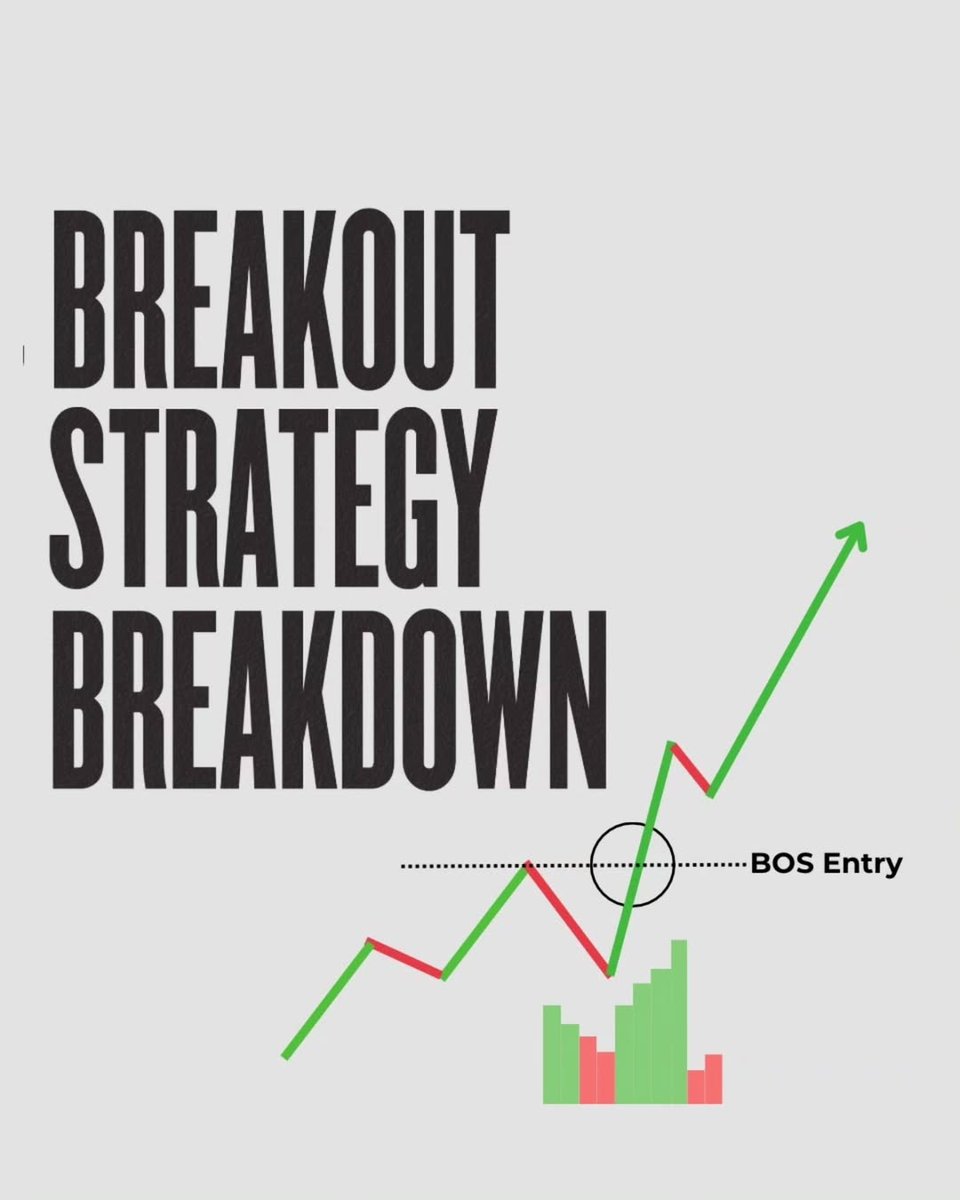
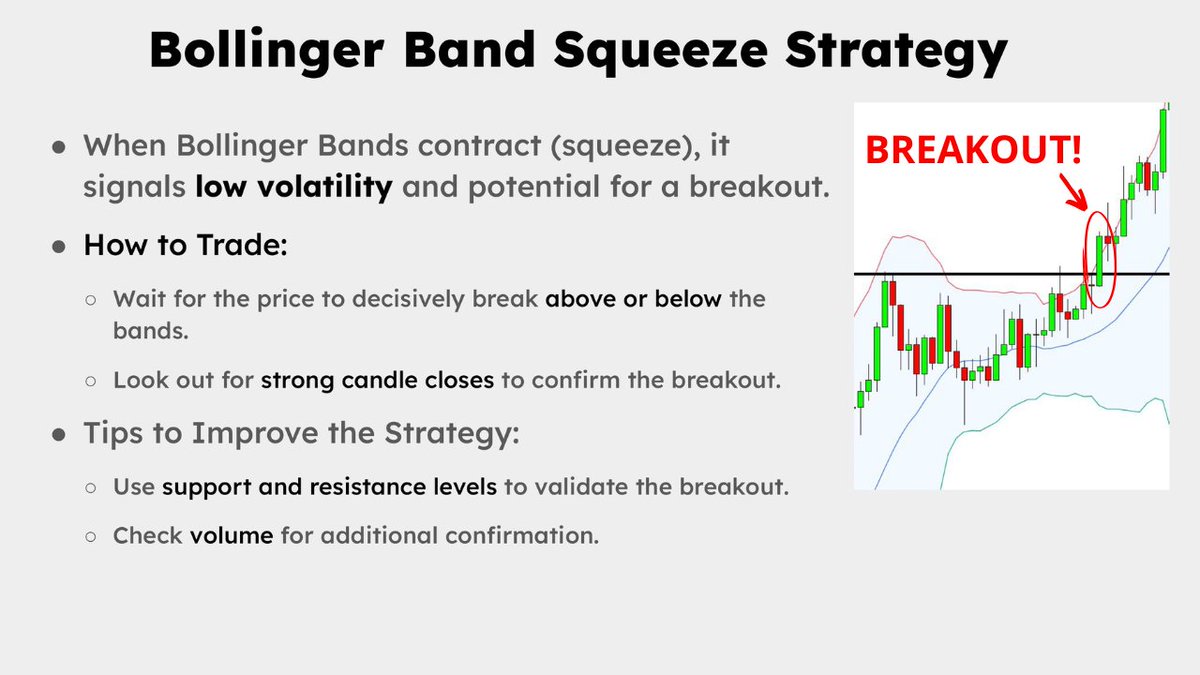
3) Strategy 1 – The Squeeze Breakout (Volatility Trap)
📌 When bands tighten → wait for breakout
✅ Look for volume spike
✅ Combine with FVG/OB zone
✅ Watch for Break of Structure (BOS)
🎯 Entry: On breakout candle
❌ SL: Opposite side of breakout candle
🎯 Target: 1.5× band width
⚡ Best on 15m / 1H timeframes
💥 Great for options scalping
📌 When bands tighten → wait for breakout
✅ Look for volume spike
✅ Combine with FVG/OB zone
✅ Watch for Break of Structure (BOS)
🎯 Entry: On breakout candle
❌ SL: Opposite side of breakout candle
🎯 Target: 1.5× band width
⚡ Best on 15m / 1H timeframes
💥 Great for options scalping
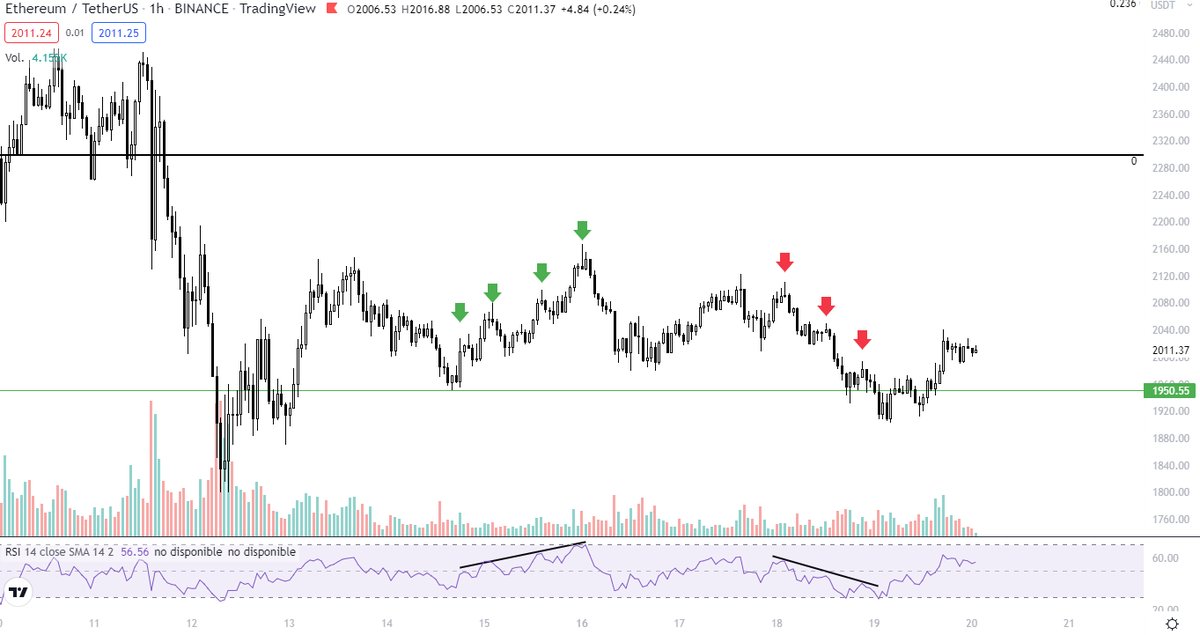
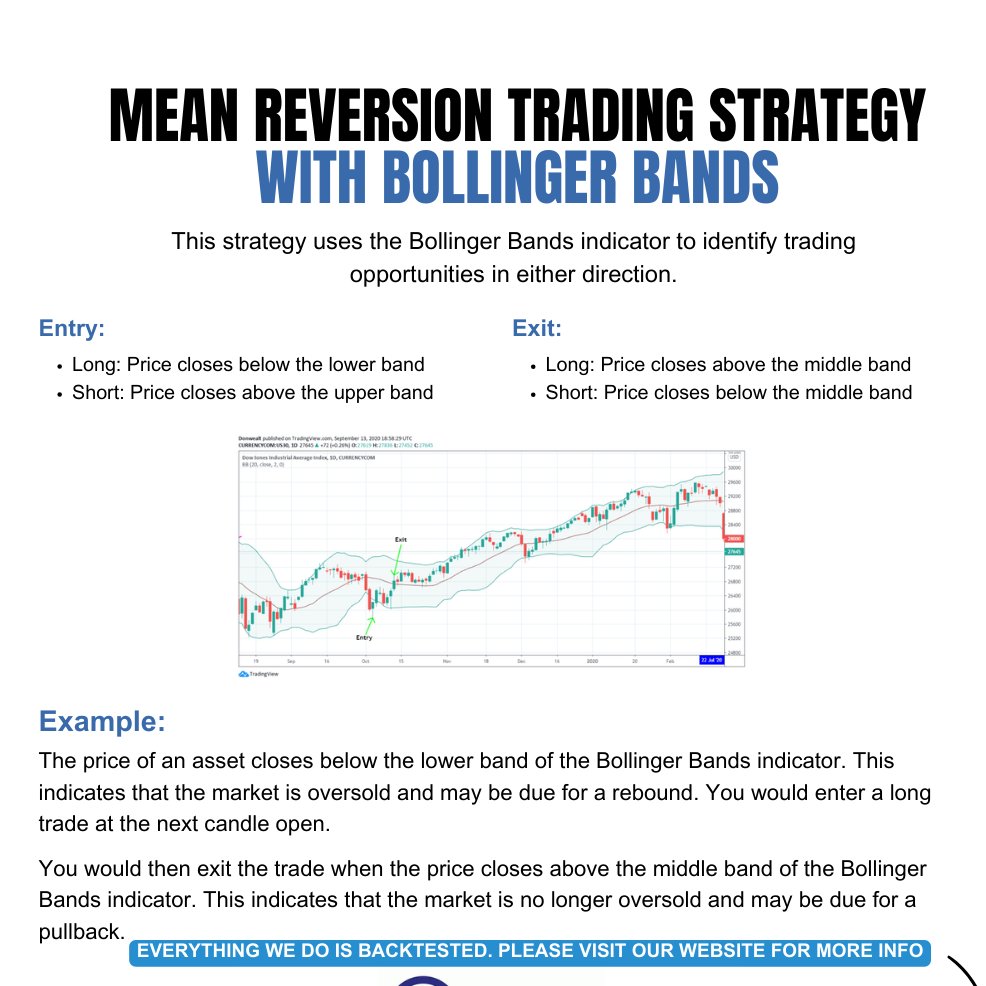
4) Strategy 2 – Reversion to Mean (Fade Extremes)
📌 When price hits upper band + RSI overbought
→ Look for bearish engulfing / rejection
→ Expect pullback to middle band
🎯 Entry: On confirmation candle
❌ SL: Above wick or band
🎯 Target: Middle band (20 SMA)
📌 Reverse setup for lower band + RSI oversold
⚠️ Avoid during trending markets
📌 When price hits upper band + RSI overbought
→ Look for bearish engulfing / rejection
→ Expect pullback to middle band
🎯 Entry: On confirmation candle
❌ SL: Above wick or band
🎯 Target: Middle band (20 SMA)
📌 Reverse setup for lower band + RSI oversold
⚠️ Avoid during trending markets
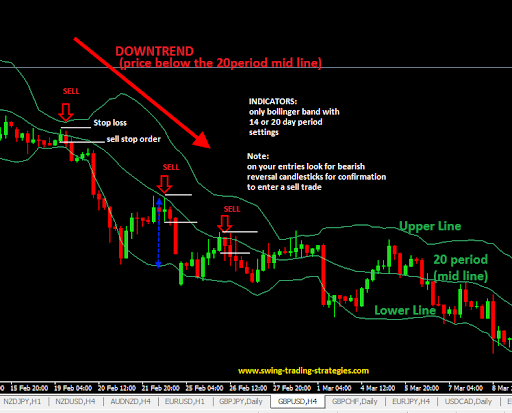
5) Strategy 3 – Riding the Band (Trend Continuation)
📌 Strong trending market
→ Price walks the upper/lower band
→ Band starts expanding
→ Pullbacks hold at middle band (20 SMA)
🎯 Entry: On pullback to middle band
❌ SL: Below recent swing
🎯 Target: Continue with trend until band flattens
✅ Combine with Supertrend or ADX
📌 Strong trending market
→ Price walks the upper/lower band
→ Band starts expanding
→ Pullbacks hold at middle band (20 SMA)
🎯 Entry: On pullback to middle band
❌ SL: Below recent swing
🎯 Target: Continue with trend until band flattens
✅ Combine with Supertrend or ADX
6) Strategy 4 – Double Tap Rejection
📌 Price hits upper band twice → forms double top
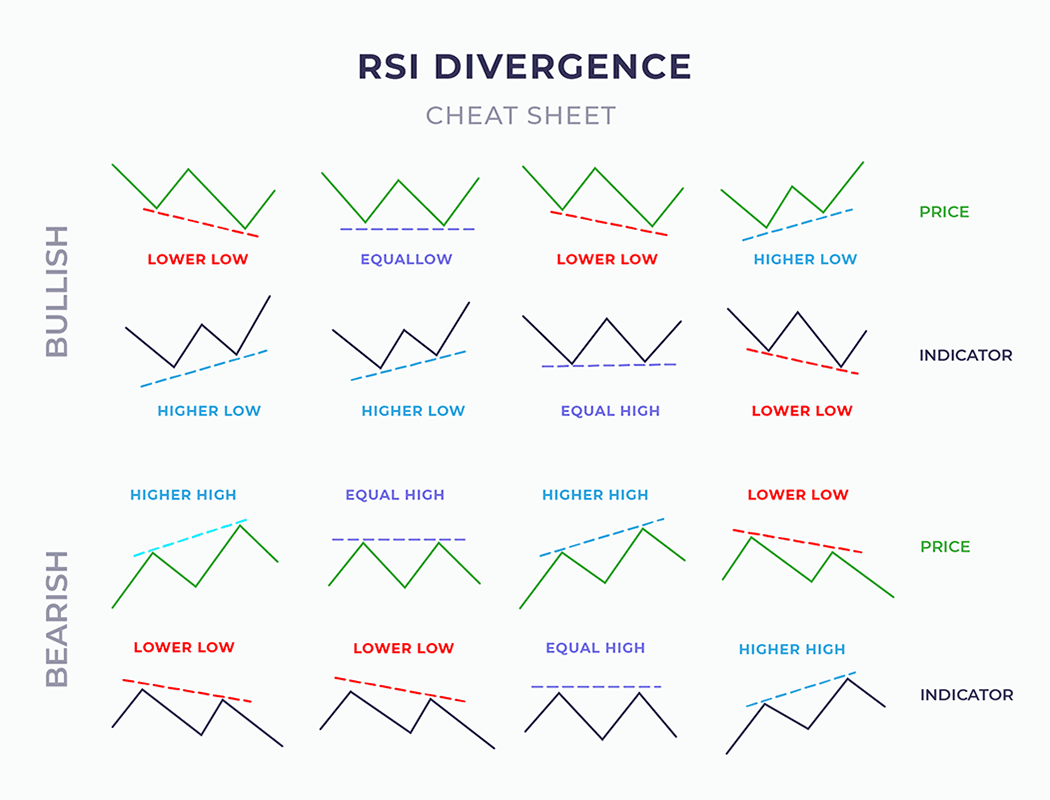
✅ Volume divergence / RSI divergence
✅ OB near second touch
🎯 Entry: On bearish engulfing
❌ SL: Above wick
🎯 Target: Middle band → lower band
💡 Combine with Smart Money concept (liquidity sweep)
📌 Price hits upper band twice → forms double top
✅ Volume divergence / RSI divergence
✅ OB near second touch
🎯 Entry: On bearish engulfing
❌ SL: Above wick
🎯 Target: Middle band → lower band
💡 Combine with Smart Money concept (liquidity sweep)
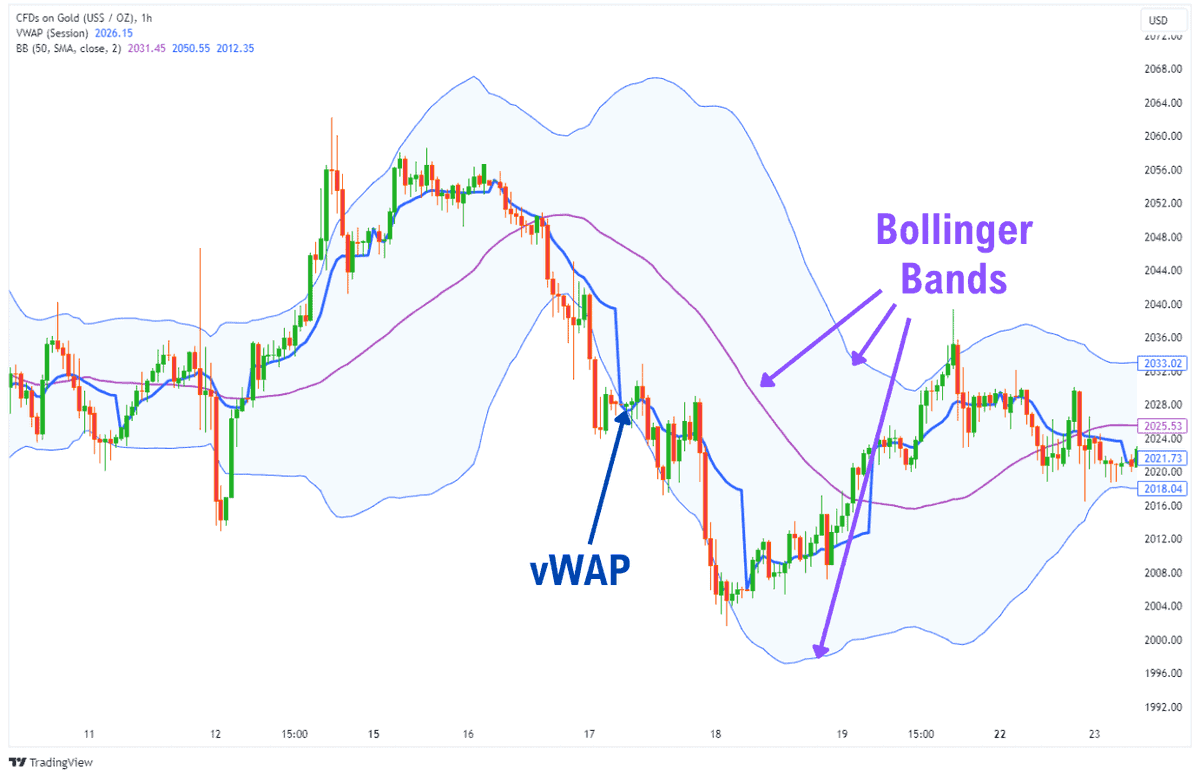
7) Bollinger Band + VWAP Combo (Intraday Edge)
✅ Price hits lower band
✅ VWAP is flat or slightly upward
✅ Strong wick rejection
✅ Volume spike
🎯 Buy CE / long future
❌ SL: Below wick
🎯 Target: VWAP → upper band
💥 Perfect for 5m scalping in Nifty / BankNifty
✅ Price hits lower band
✅ VWAP is flat or slightly upward
✅ Strong wick rejection
✅ Volume spike
🎯 Buy CE / long future
❌ SL: Below wick
🎯 Target: VWAP → upper band
💥 Perfect for 5m scalping in Nifty / BankNifty
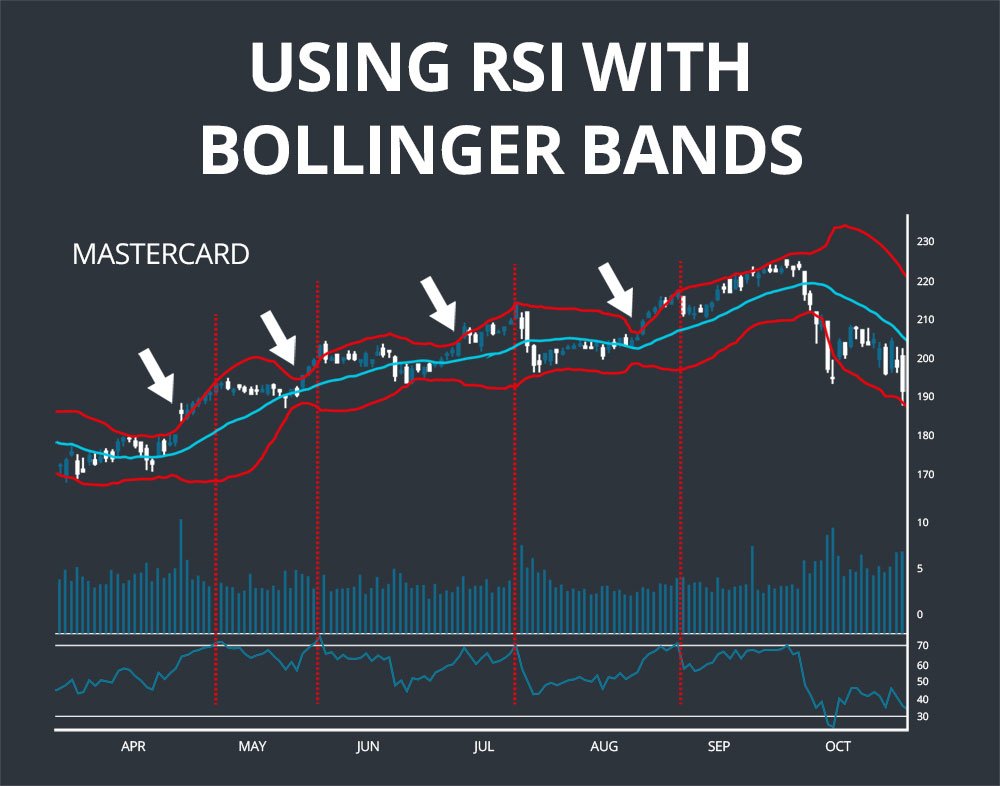
8) Bollinger Band + RSI Combo
🧠 One of the strongest confluence strategies:
📌 Price at upper band
📌 RSI divergence
📌 FVG / OB zone nearby
🎯 Entry: On candle rejection
❌ SL: Above wick
🎯 Target: 20 SMA or lower band
🟢 Use this for smart mean-reversion trades
🧠 One of the strongest confluence strategies:
📌 Price at upper band
📌 RSI divergence
📌 FVG / OB zone nearby
🎯 Entry: On candle rejection
❌ SL: Above wick
🎯 Target: 20 SMA or lower band
🟢 Use this for smart mean-reversion trades
9) When Bollinger Bands FAIL
❌ Don’t fade a breakout in a trending market
❌ Don’t use without confirmation
❌ Avoid band signals during news events
❌ Never rely only on price touching band
📌 Bands are context-driven → not magic
❌ Don’t fade a breakout in a trending market
❌ Don’t use without confirmation
❌ Avoid band signals during news events
❌ Never rely only on price touching band
📌 Bands are context-driven → not magic
• • •
Missing some Tweet in this thread? You can try to
force a refresh