Recently, I posted a link to an article discussing how well masks work at limiting airborne disease transmission. Gillian read the link and asked the following question.
This gets to a critical issue I thought I’d discuss.
This gets to a critical issue I thought I’d discuss.
https://x.com/jillneimark/status/1949089765166321959
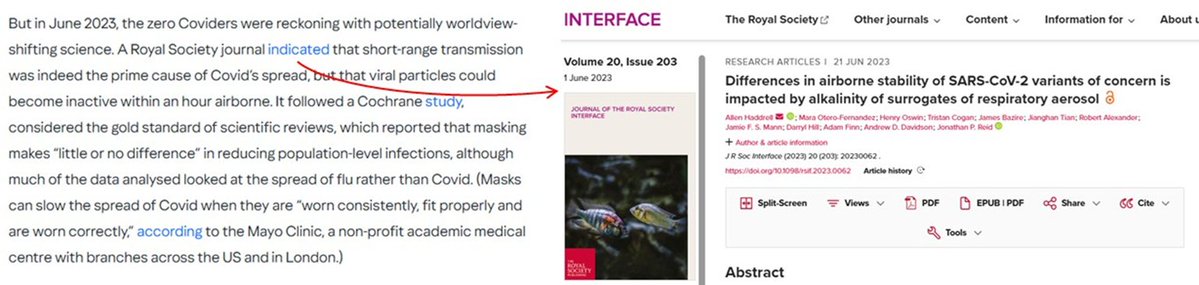
Alright, so the specific quote being highlighted is below. Now, this may seem alarming to many people.
To be clear, the author is saying that they estimate the number of infectious aerosol an infected person exhalesis extremely low.
To be clear, the author is saying that they estimate the number of infectious aerosol an infected person exhalesis extremely low.

In this thread I’m going to discuss the multiple issues around initial exhaled viral load.
I’ll go into how it’s measured, what its value means in terms of mitigation, and I’ll discuss how propagandists use this information to mislead people.
I’ll go into how it’s measured, what its value means in terms of mitigation, and I’ll discuss how propagandists use this information to mislead people.

Alright, the way in which the authors in the original article estimated the amount of infectious virus per exhalation is as follows. First, they collect as much (if not all) of the exhaled aerosol a person exhales over a set period of time.
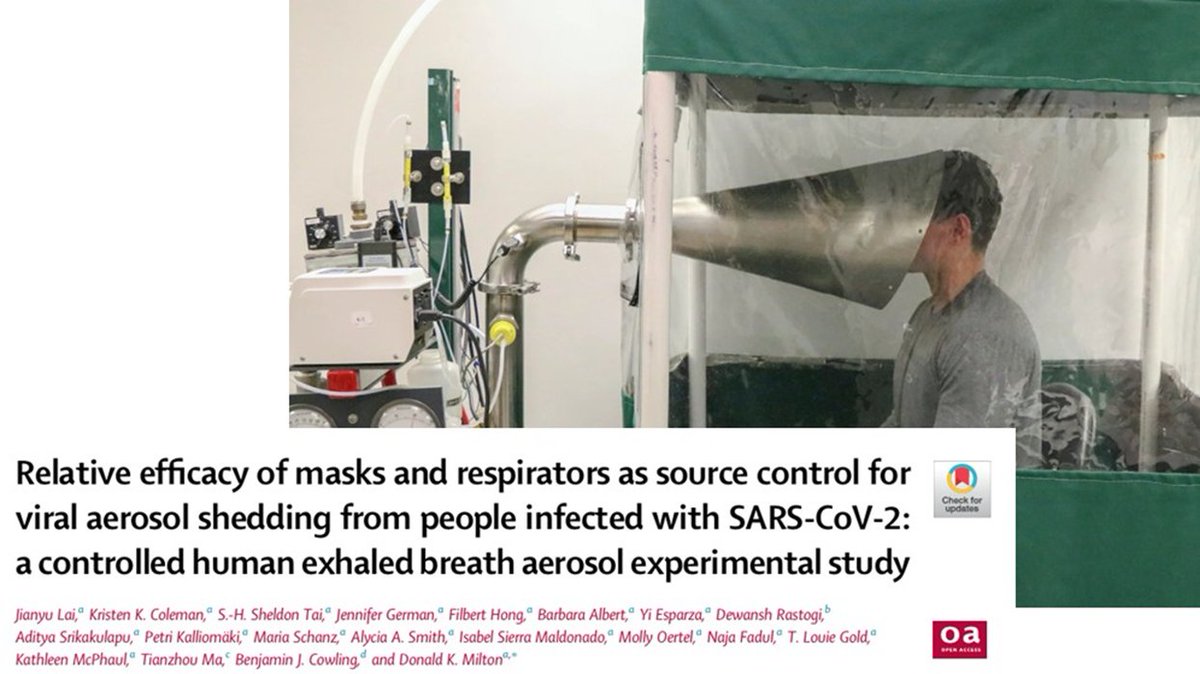
Ideally, since we are interested in the amount of infectious virus is exhaled, one would directly measure that. Unfortunately, this is not as simple as it sounds.
Infectious virus is hard to quantify for a variety of reasons: eg the virus readily decays. Thus, in order to directly measure infectious virus, the assays need to be run in real time to limit loss. This is extremely difficult, time sensitive, and expensive.
To get around these challenges, researchers will simply measure the amount of viral RNA that is in the sample. RNA analysis is powerful, specific, and the molecule doesn’t break down nearly as quickly.
That said, # of RNA does not equal # of infectious virus.
That said, # of RNA does not equal # of infectious virus.
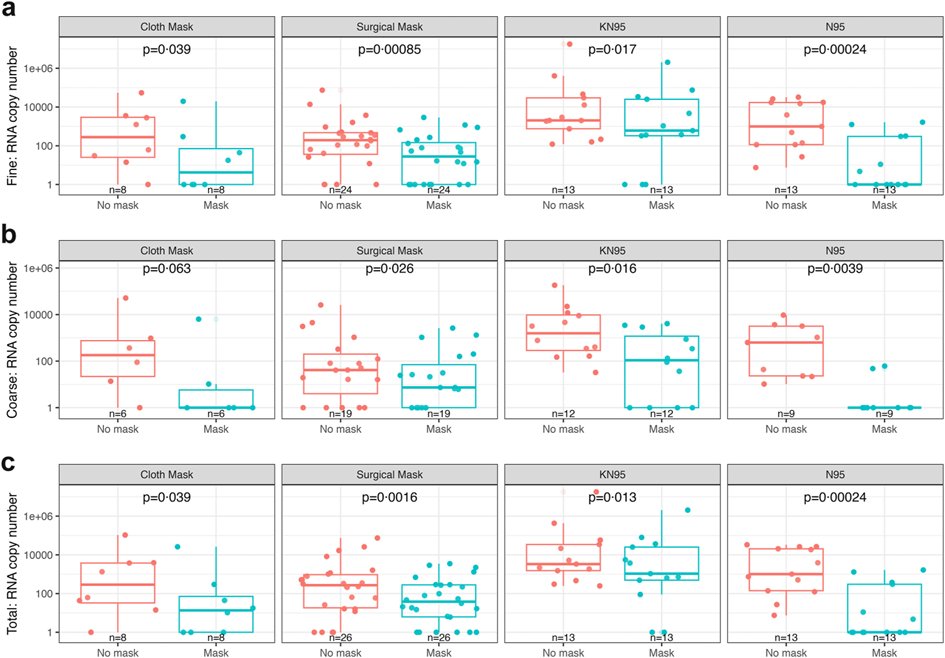
RNA copies are not equal to the number of infectious virus particles. There is much debate around this ratio. In this paper, the authors estimate the value to be around 1000 RNA molecules to 1 infectious virus. This is a commonly reported/used value.

Thus, to estimate the amount of infectious virus, they simply divide the amount of RNA detected by 1,000 to get a crude value. Based on Milton’s work, there’s well under 100 infectious viral particles exhaled over an hour while breathing.
So, not a lot.
So, not a lot.
Other groups have measured actual infectivity and found it to be somewhat higher than those reported using the RNA estimate. So, more, but still not a tremendous amount.
pubmed.ncbi.nlm.nih.gov/38040798/
pubmed.ncbi.nlm.nih.gov/38040798/
Alright, so that’s how the initial exhaled viral load is measured. Now to get into what this value means in the larger picture.

Why the Big Picture Matters:
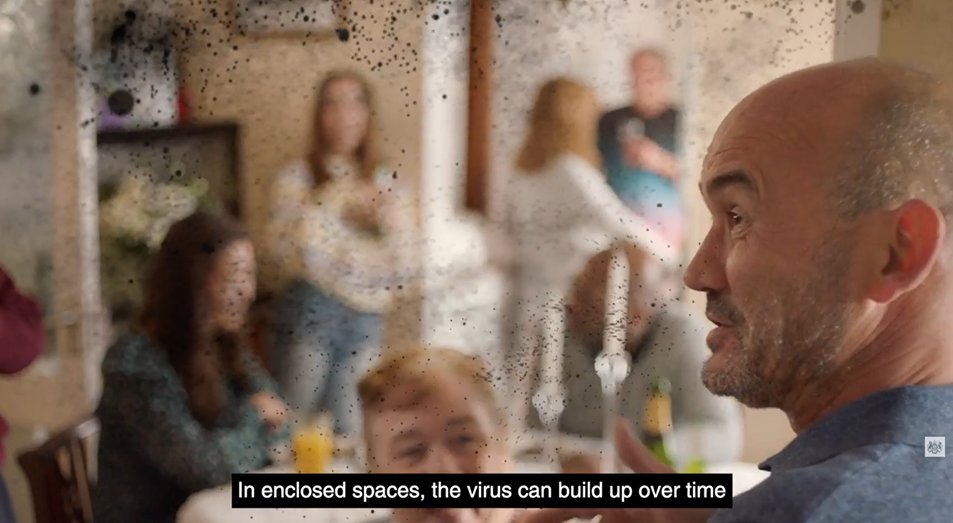
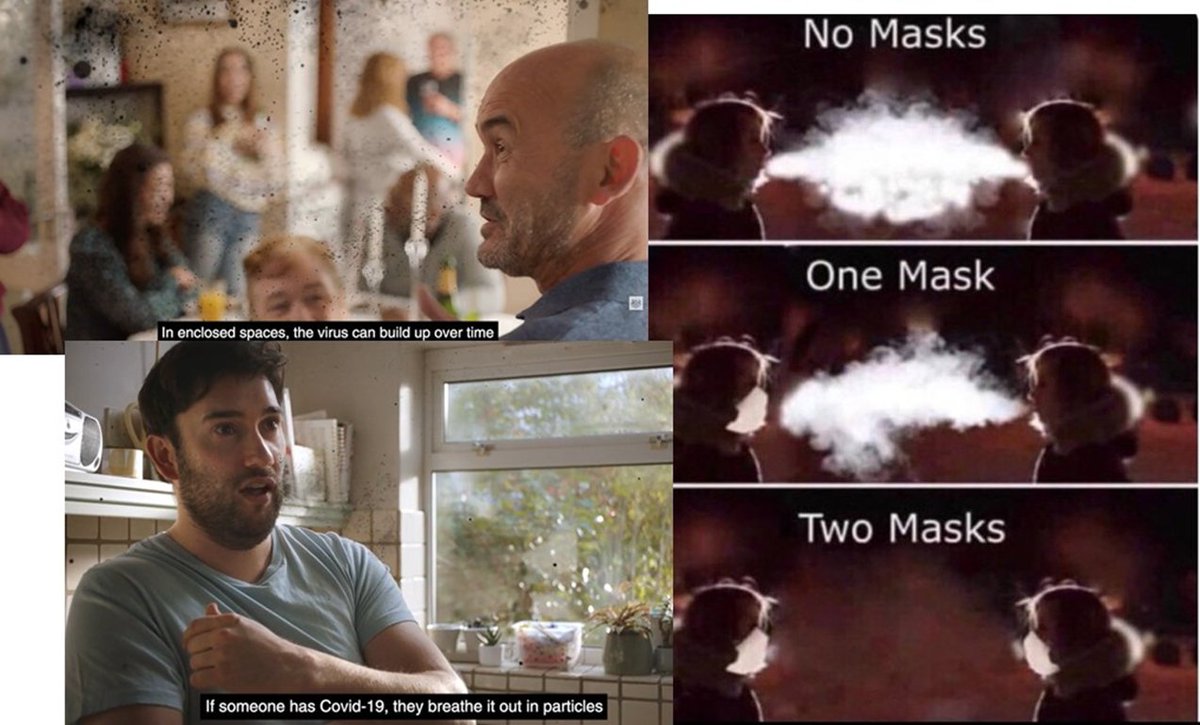
In order to raise awareness of how Covid is transmitted, and the importance of things like ventilation and masking, the NHS put out a series of commercials.
In order to raise awareness of how Covid is transmitted, and the importance of things like ventilation and masking, the NHS put out a series of commercials.
The idea being, if people could actually see the virus hanging in the air, they be more inclined to deal with it.
It also helps the viewer to visualize how the aerosol travels and how it can build up in poorly ventilated spaces.
This is good messaging.
It also helps the viewer to visualize how the aerosol travels and how it can build up in poorly ventilated spaces.
This is good messaging.
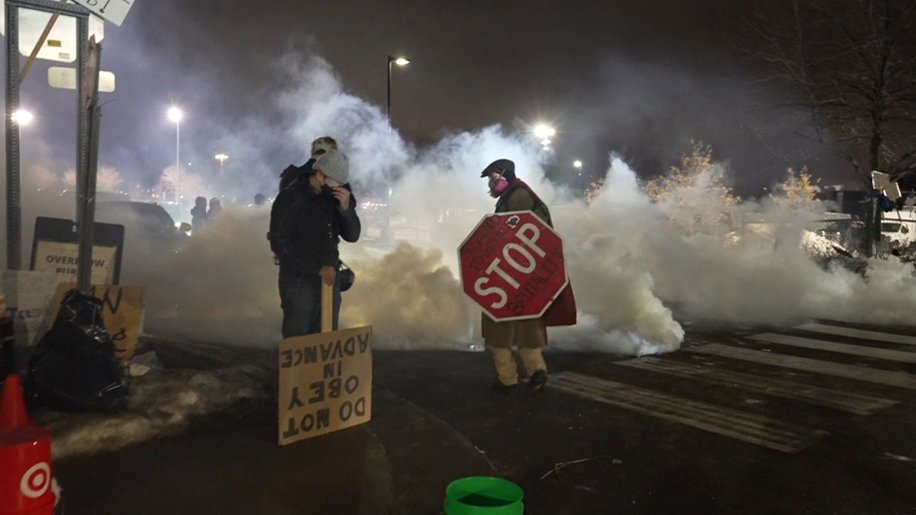
Meanwhile online, memes such as this were shared as a means by which to get across the idea that masks limit the spread through both limiting the exhaled aerosol numbers, as well as lowering exposure.
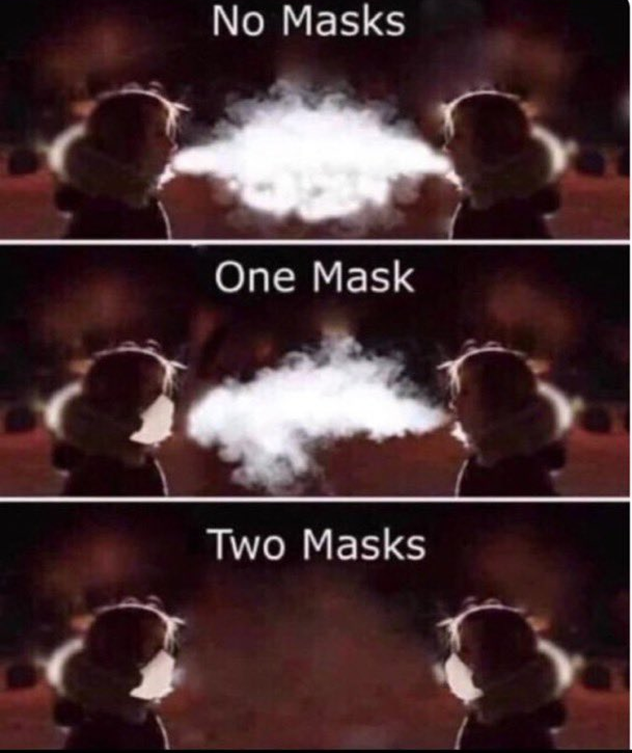
It’s important to note that these are not exhaled aerosol. It is water that is condensing out of the exhaled air when it comes into contact withcold air. The actual amount of aerosol we exhale is quite low.

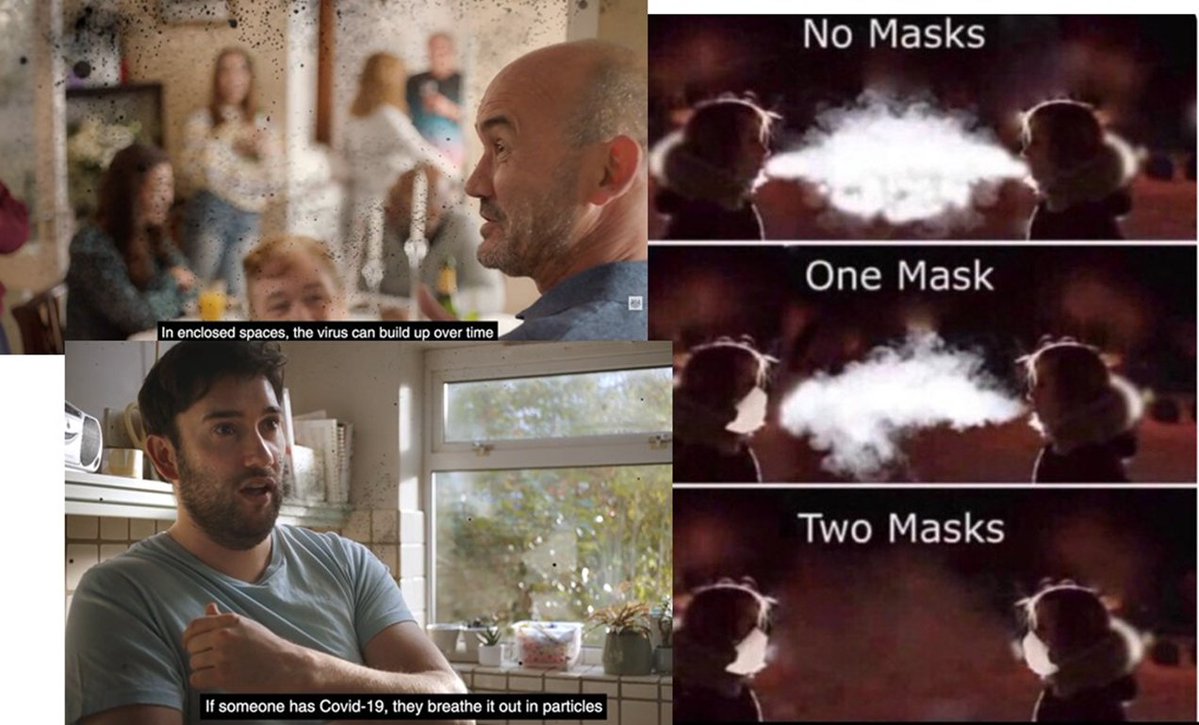
The overall messaging here was positive: SARS-CoV-2 is spread through the air, and masking, filtration and ventilation helps to limit the spread.
It got people to think about airborne transmission.
It got people to think about airborne transmission.

Unfortunately, the imaging used in these ads/meme were often taken literally. This led many to believe that people exhaled a lot of virus into the air when talking and breathing. The problem is that this not accurate.
People exhale aerosol, and infectious aerosol, just not a lot
People exhale aerosol, and infectious aerosol, just not a lot
This is one of the reasons that scientists go to such extraordinary lengths to detect it. If people exhaled a lot of infectious aerosol, it would be very easy to measure without having to build such elaborate instruments.

Alright then, so why does this matter?
Well, the amount of exhaled infectious aerosol over the course of an hour will have a dramatic effect on many factors around airborne disease transmission.
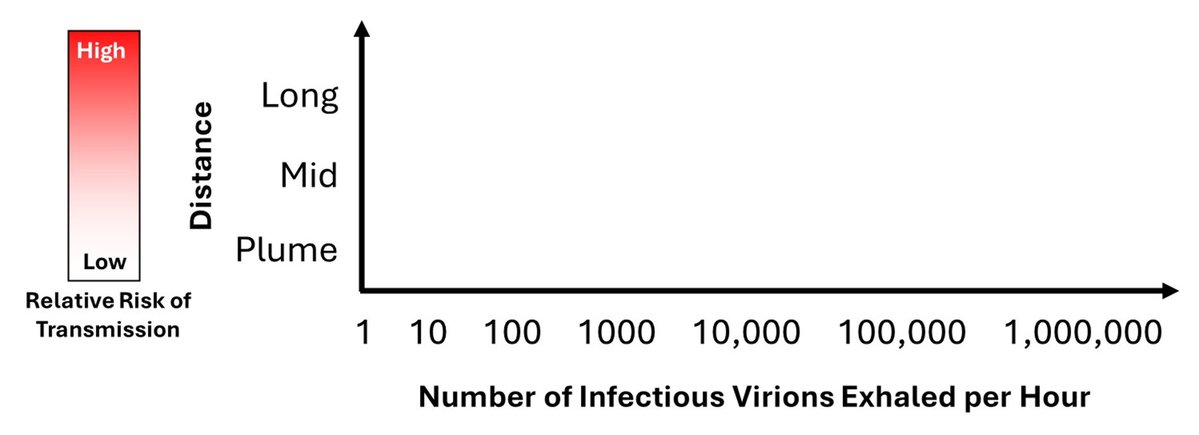
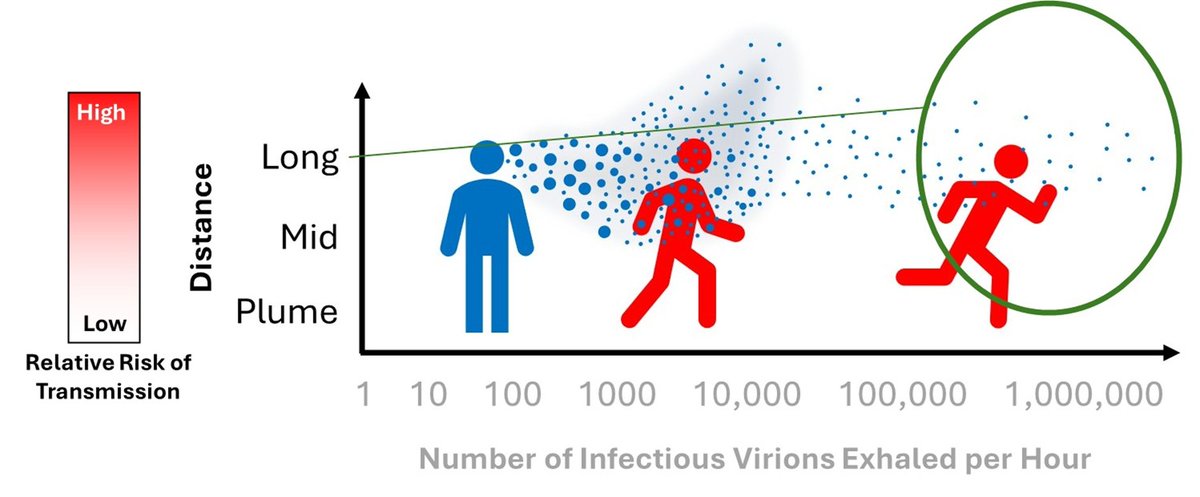
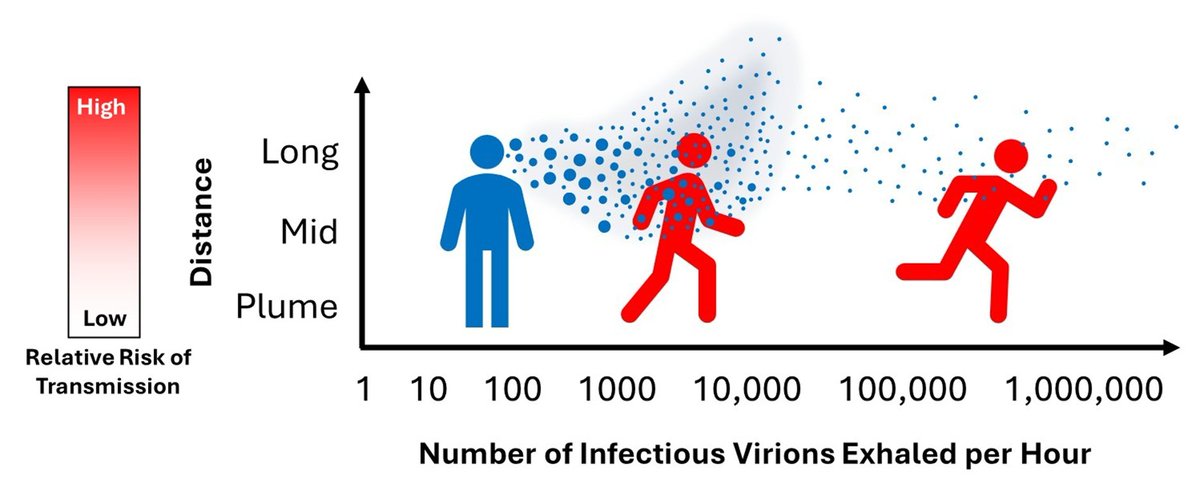
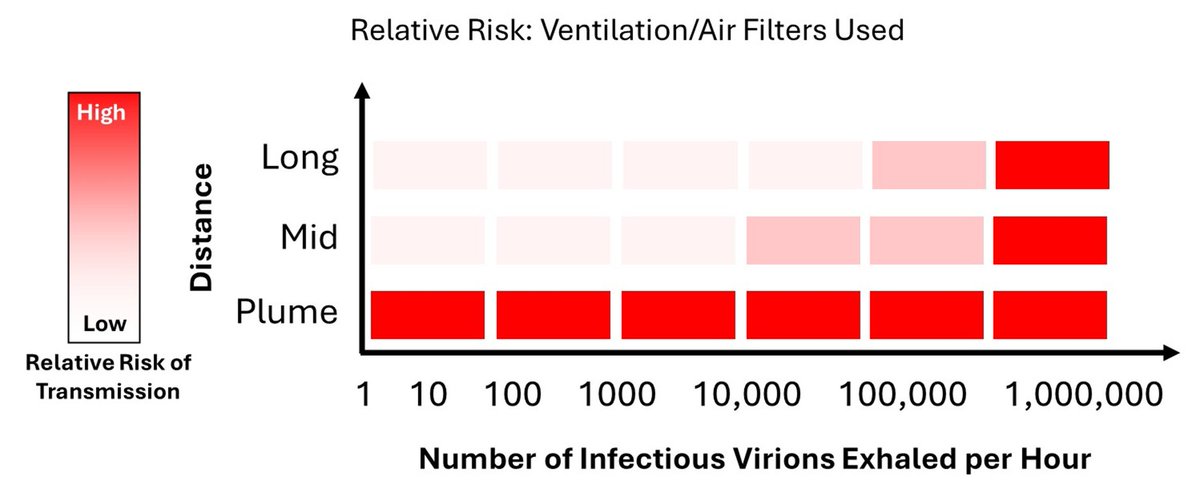
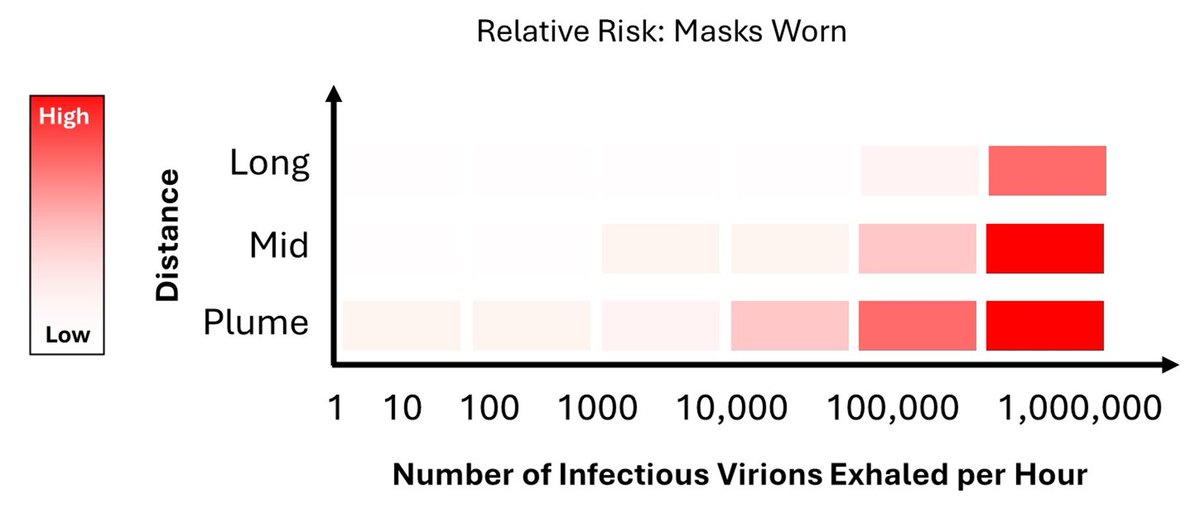
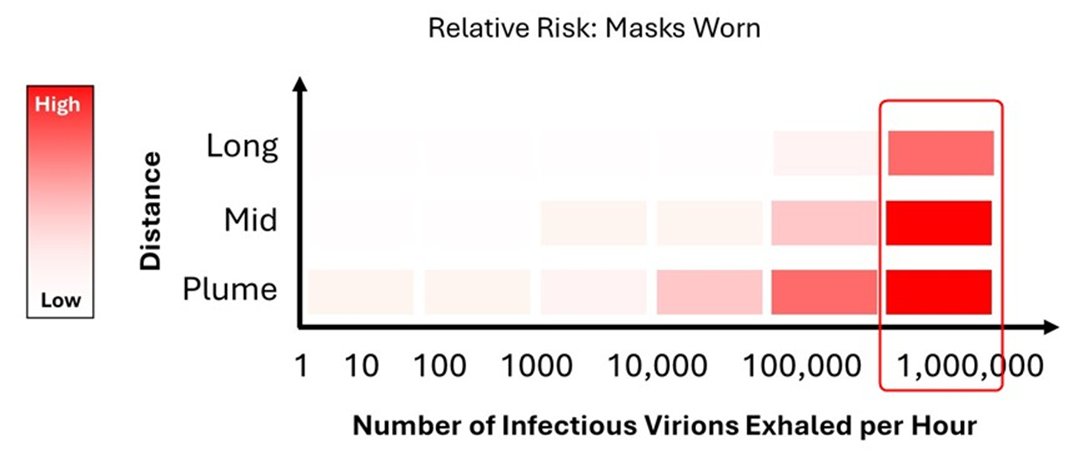
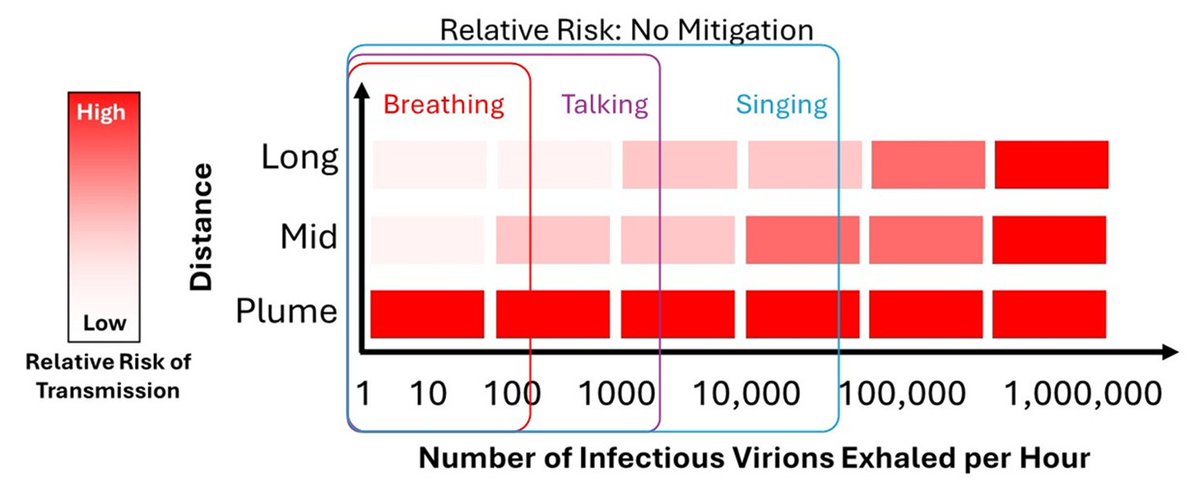
I will use this basic figure below to walk through what I mean.
Well, the amount of exhaled infectious aerosol over the course of an hour will have a dramatic effect on many factors around airborne disease transmission.
I will use this basic figure below to walk through what I mean.
Defining Terms:
The X-axis is simply the amount of infectious viral aerosol particles that are exhaled in an hour.
The X-axis is simply the amount of infectious viral aerosol particles that are exhaled in an hour.
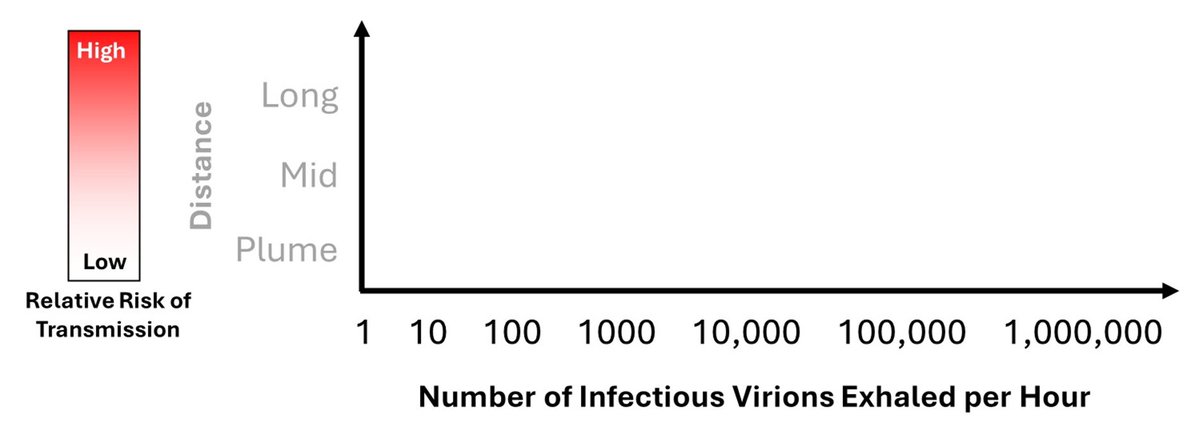
The Y-axis describes the distance for the disease transfer to occur. For this summary, I’ve broken it down into 3 relative distances.
First is the “Plume”. In this region, the virus has just been exhaled, where no decay has occurred and the aerosol concentration is at its highest.
The second range is the “Mid”. This is beyond the plume, on the order of meters. Some viral decay may occur, and the aerosol itself will be more dispersed than in the plume.
The third range is the “Long”. This is well beyond the plume. Significant time has passed, leading to much viral decay. The aerosol will be largely equally dispersedacross the room.
DISCLAIMER: This is a generalization.
I did not model anything here; these are simply numbers that are commonly referred to in the literature. This is solely to help one understand one of the many challenges around studying airborne transmission.
I did not model anything here; these are simply numbers that are commonly referred to in the literature. This is solely to help one understand one of the many challenges around studying airborne transmission.
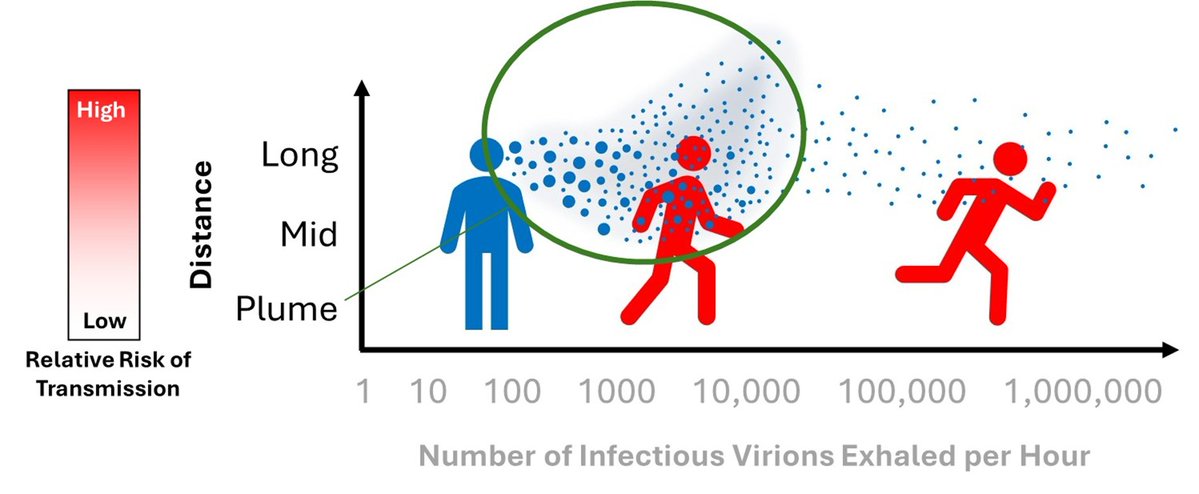
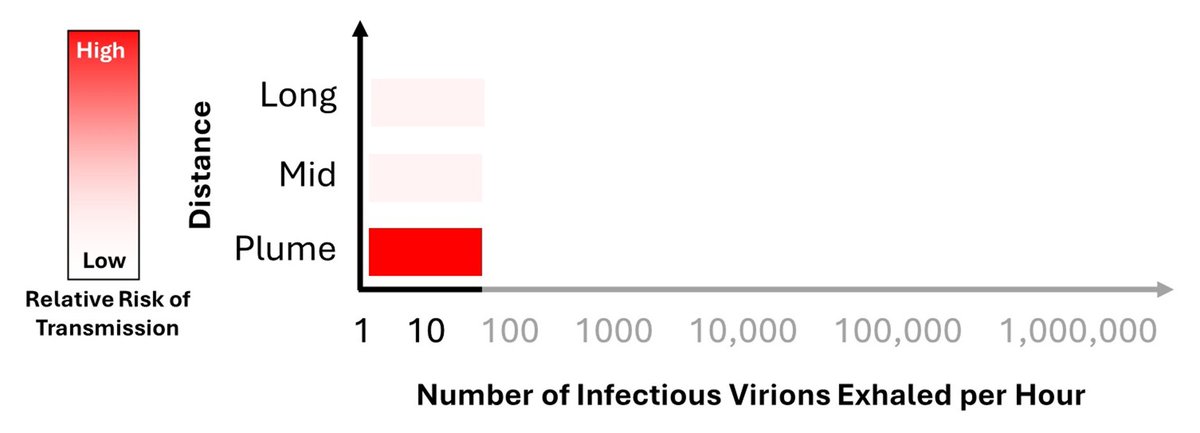
If the amount of exhaled infectious aerosol is extremely low, then transmission will almost entirely be in the short range: in the exhalation plume. If an infected person exhales under 10 infectious units an hour, then it is unlikely that the airborne viral load will accumulate.
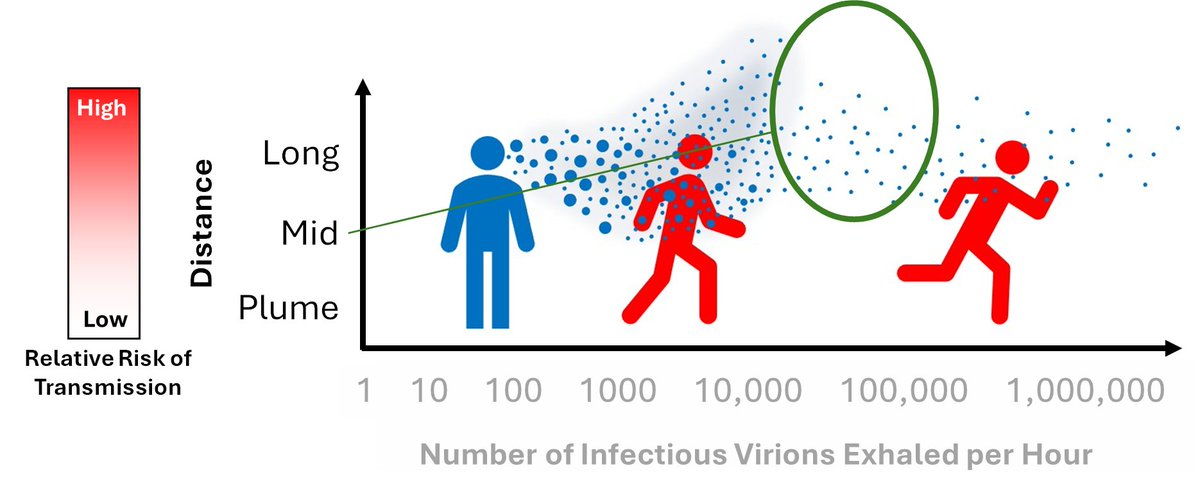
If the amount of exhaled infectious aerosol is higher, then virus is more likely to be present in areas outside of the exhalation plume. Even though the virus decays in the air, enough will remain for successful transmission.
Again, the specific numbers are up for debate.
Again, the specific numbers are up for debate.

As mentioned, if the initial infectious dose is very low, then nearly (if not) all the transmission would be expected to take place over very short distances. As a result, mitigation strategies that work to limit long distance transmission would have no effect.
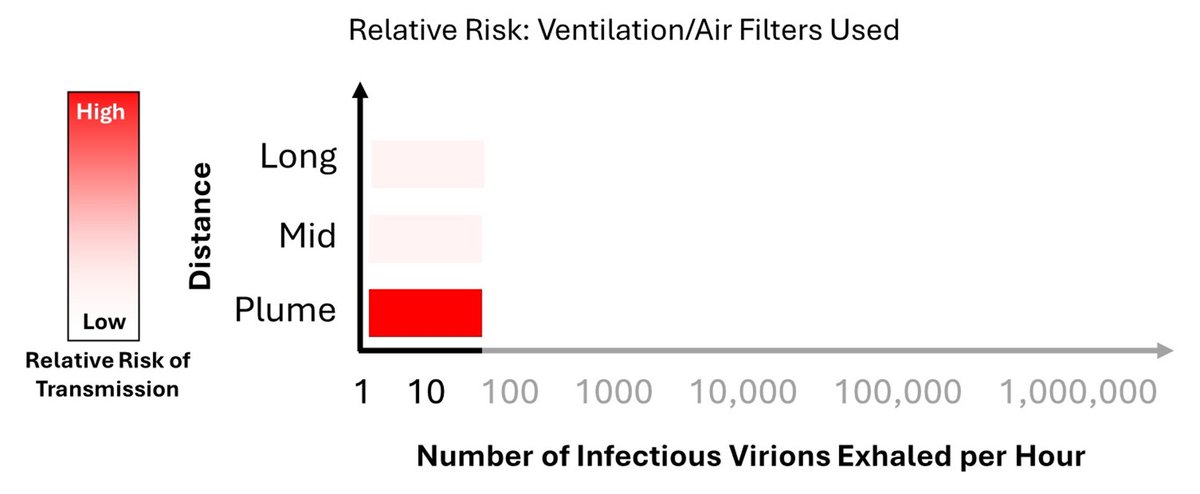
As the infectious dose increases, as does the effectiveness of filtration and ventilation. Both actively remove the infectious aerosol from the space.

If the infectious dose is extremely high, then the amount of virus being injected into the room may overwhelm the mitigation system. As a result, unless high ventilation/filtration rates are used, there will always be some virus around, limiting effectiveness.
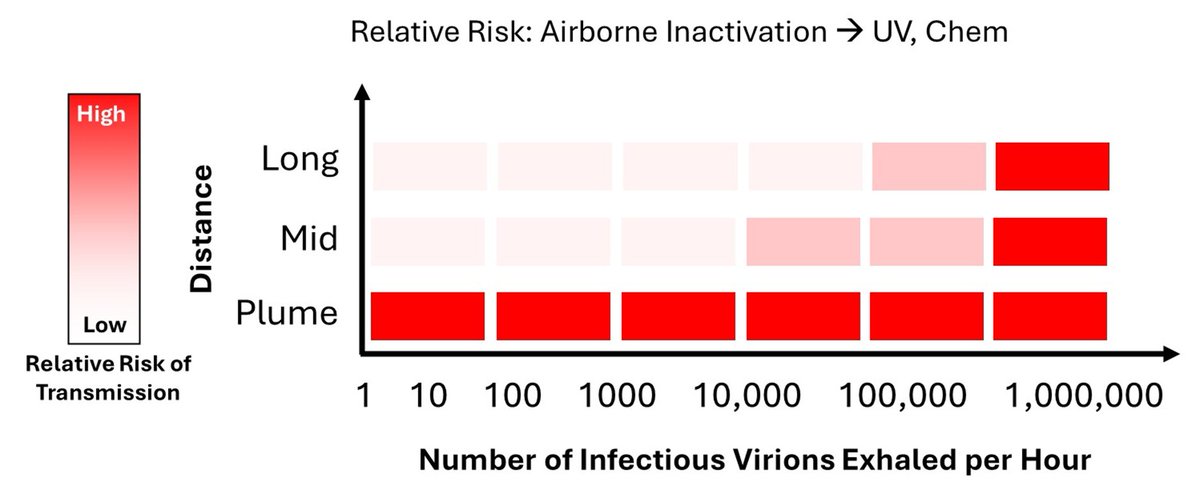
A similar trend would be expected for other means of reducing the aerosolized viral load, so things such as UV, far-UVC, or chemical inactivation.
As mentioned in the disclaimer, the exact values shown here are crude estimates; I am simply describing the general trend here.
As mentioned in the disclaimer, the exact values shown here are crude estimates; I am simply describing the general trend here.
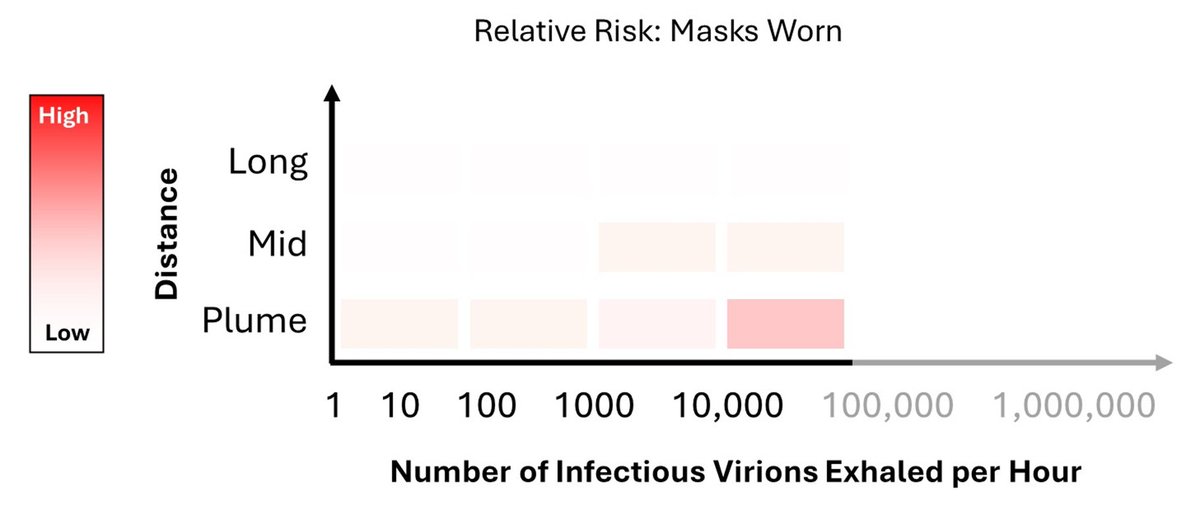
The initial infectious viral load will have a dramatic effect on the effectiveness of masks.
If the initial load is low, then a mask will be extremely effective. If the number is in the single digits, then a 90% reduction is essentially 100%.
If the initial load is low, then a mask will be extremely effective. If the number is in the single digits, then a 90% reduction is essentially 100%.

This means that IF the viral load is extremely LOW, even a poorly functional mask that stops a fraction of the exhaled viral load COULD have a significant effect on transmission.
For example:
If Initial = 1 dose, only need a 50% reduction to have <1 dose
For example:
If Initial = 1 dose, only need a 50% reduction to have <1 dose
It should also be noted that even a poorly fitted mask will break up the exhalation plume, which will, to a limited degree, limit short distance transmission. Anything that either buys time for the virus to decay, or reduce its concentration in the air, will help.
As the initial infectious dose increases, the mask needs to be more efficient to deliver the any effectiveness.
For example:
If Initial = 5 doses, need a 90% reduction to have <1 dose
If Initial = 500 doses, need a 99.9% reduction to have <1 dose
For example:
If Initial = 5 doses, need a 90% reduction to have <1 dose
If Initial = 500 doses, need a 99.9% reduction to have <1 dose
Again, as the initial dose increases, the efficiency of the mask required to yield a near 100% reduction needs to be higher a higher. Meaning, that as the initial infectious viral load increases, the efficacy of the mask decreases.
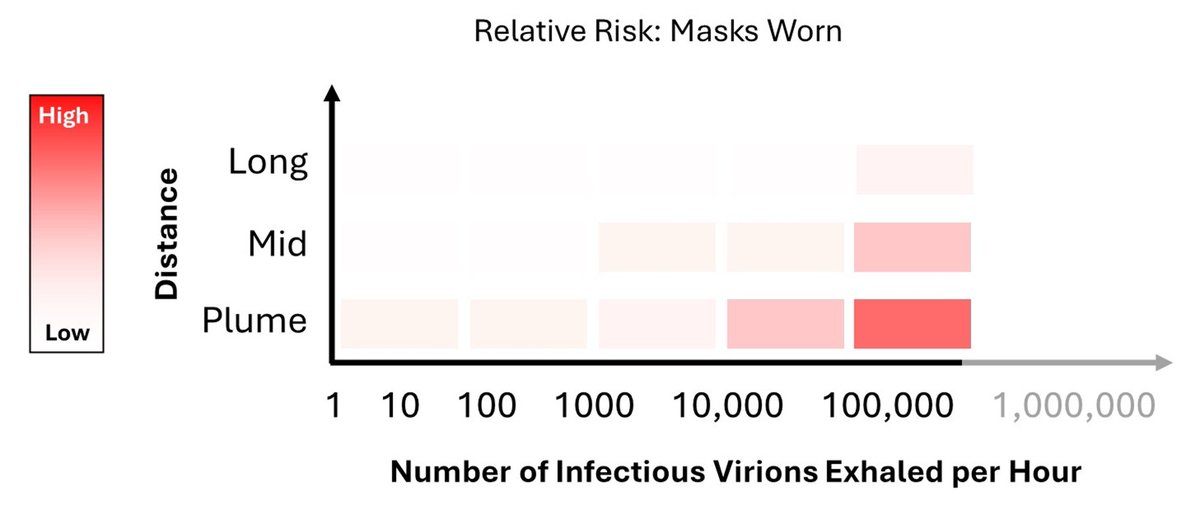
If the initial infectious dose is extremely high, then the efficiency of the mask needs to be >99.99…..9% to work. In short, there’s simply too much virus in the air for the mask to stop all of it. And when the initial value is very high, a lot will make it through.
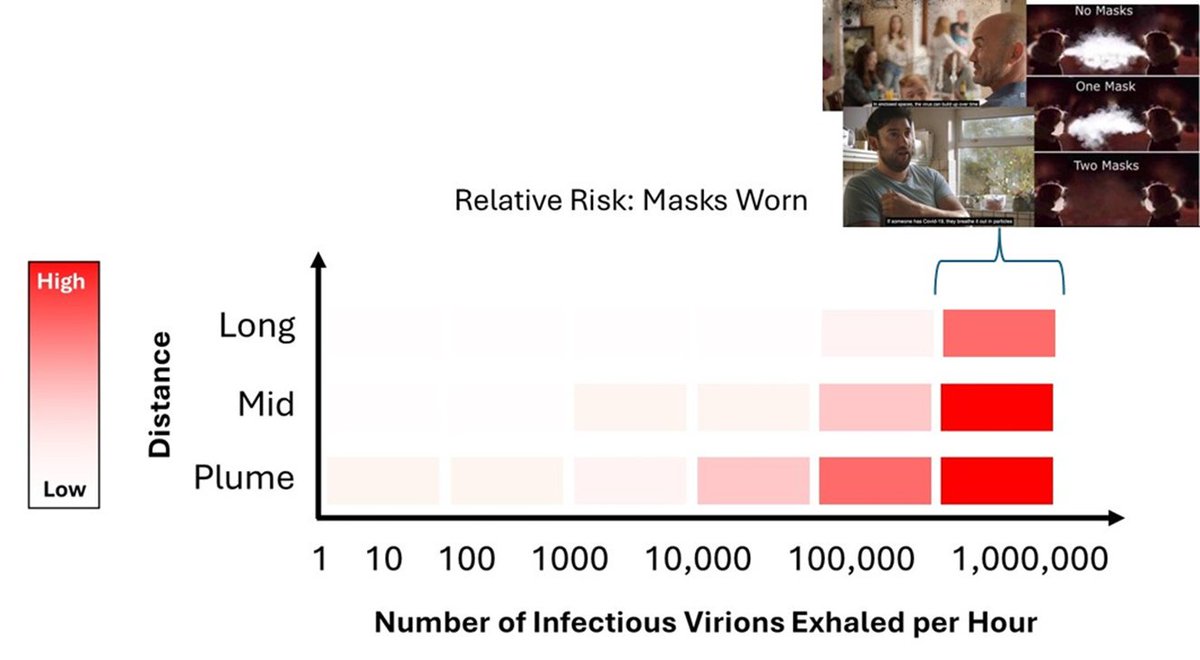
This takes us back to the original messaging around Covid.
Based upon these images, it’s not unreasonable for one to assume that the number of infectious virions being exhaled would be in the >100,000 to >1,000,000 range.
Based upon these images, it’s not unreasonable for one to assume that the number of infectious virions being exhaled would be in the >100,000 to >1,000,000 range.
Specifically, these images suggest that the initial viral load must be on the higher end.
Since most people do not spend time thinking about the various processes involved in airborne disease transmission, I think these images inadvertently primed people to be readily mislead.
Since most people do not spend time thinking about the various processes involved in airborne disease transmission, I think these images inadvertently primed people to be readily mislead.
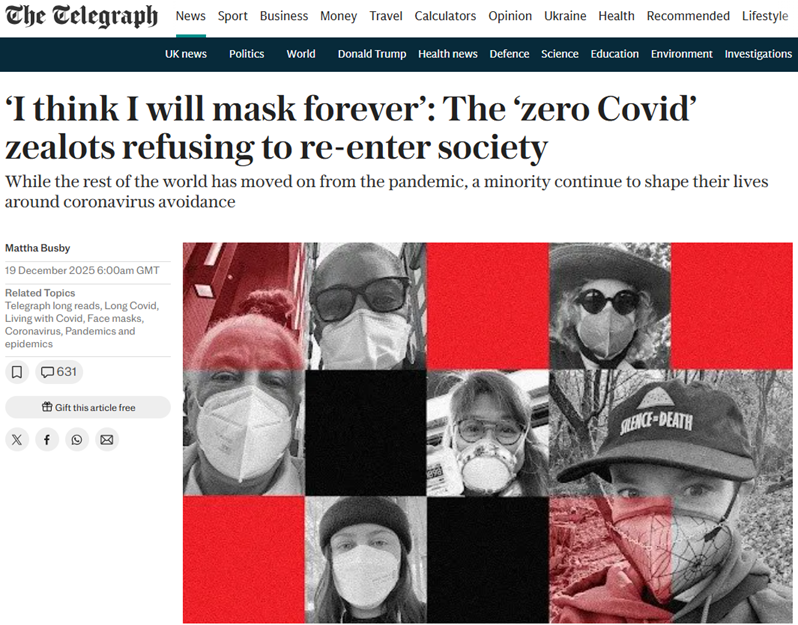
It’s this fundamental misunderstanding that anti-science propogandists used to argue that masks don’t work. I deliberately use the word “propogandist” because articles like this are clearly propaganda.
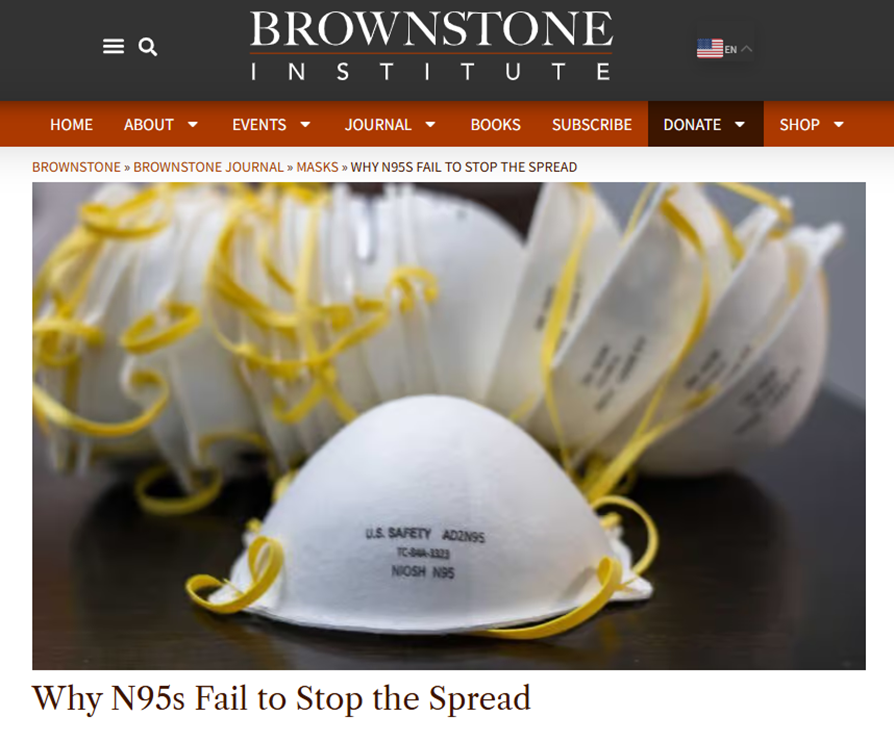
In short, this Brownstone Institute article argues that the exhaled viral load is so high that it’s impossible for an N95 mask to remove enough virus to stop transmission.
Like any good piece of misinformation, the Brownstone article has many citations, making the article appear to be well researched.
And to those unfamiliar to the field, it may even appear to be well written.
And to those unfamiliar to the field, it may even appear to be well written.
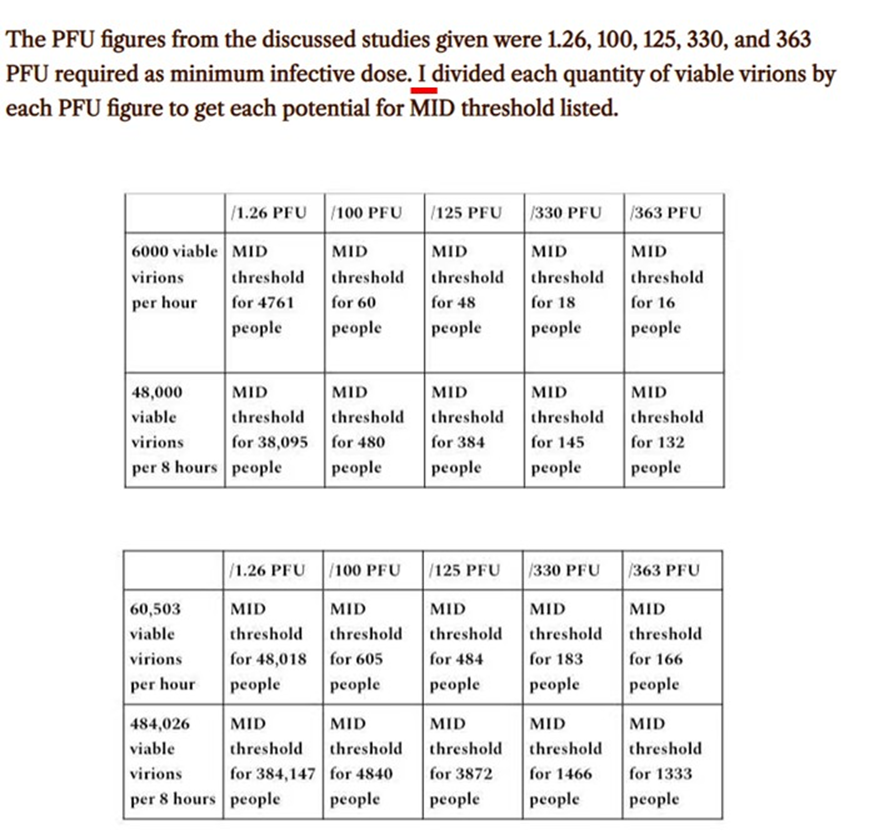
However, when it gets to the main point of the article (ie, masks don’t work because the initial viral load is so high), rather than using real/reported numbers the author simply multiplies what they can to get the biggest number possible.
For example, the amount of air people typically exhale is around 6-7.5 L/min. They use 29L in the article.
This is common in science misinformation: to get a high number, use the highest possible value for everything, and imply that those are normal.
This is common in science misinformation: to get a high number, use the highest possible value for everything, and imply that those are normal.

The values used in their estimation would be those from a superspreader screaming constantly over 8 hours, while exercising, in a room with 0 ventilation. Hardly typical.
In science, it is not uncommon to make estimates based on limited information. A critical step in that process is to look at the final numbers generated and see if they make any sense in the larger picture.
At all.
At all.
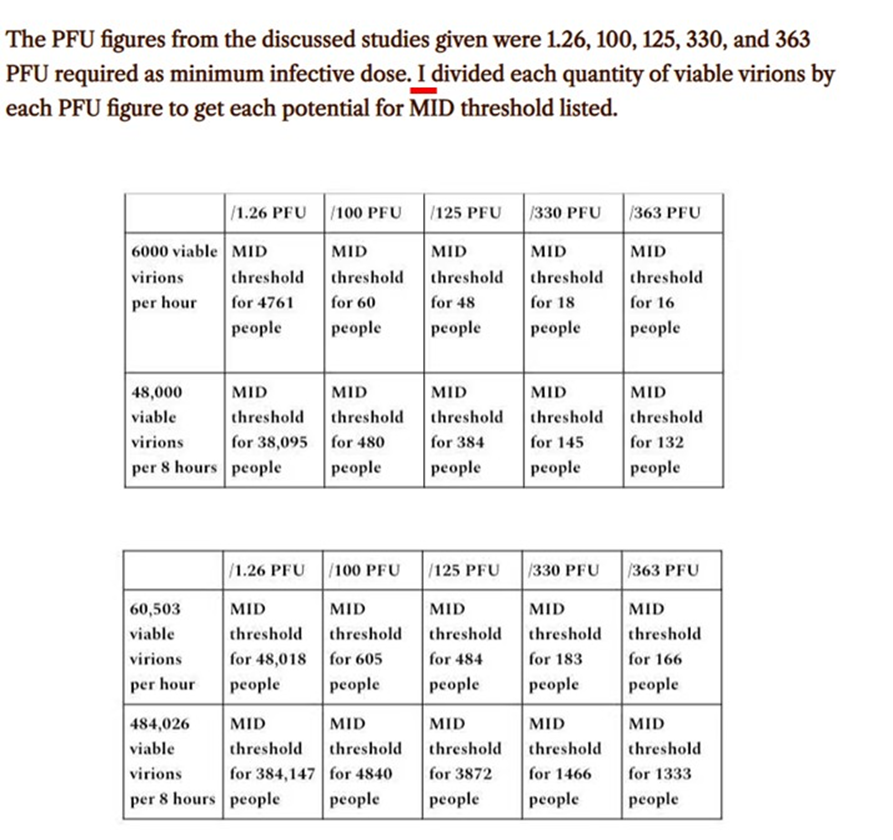
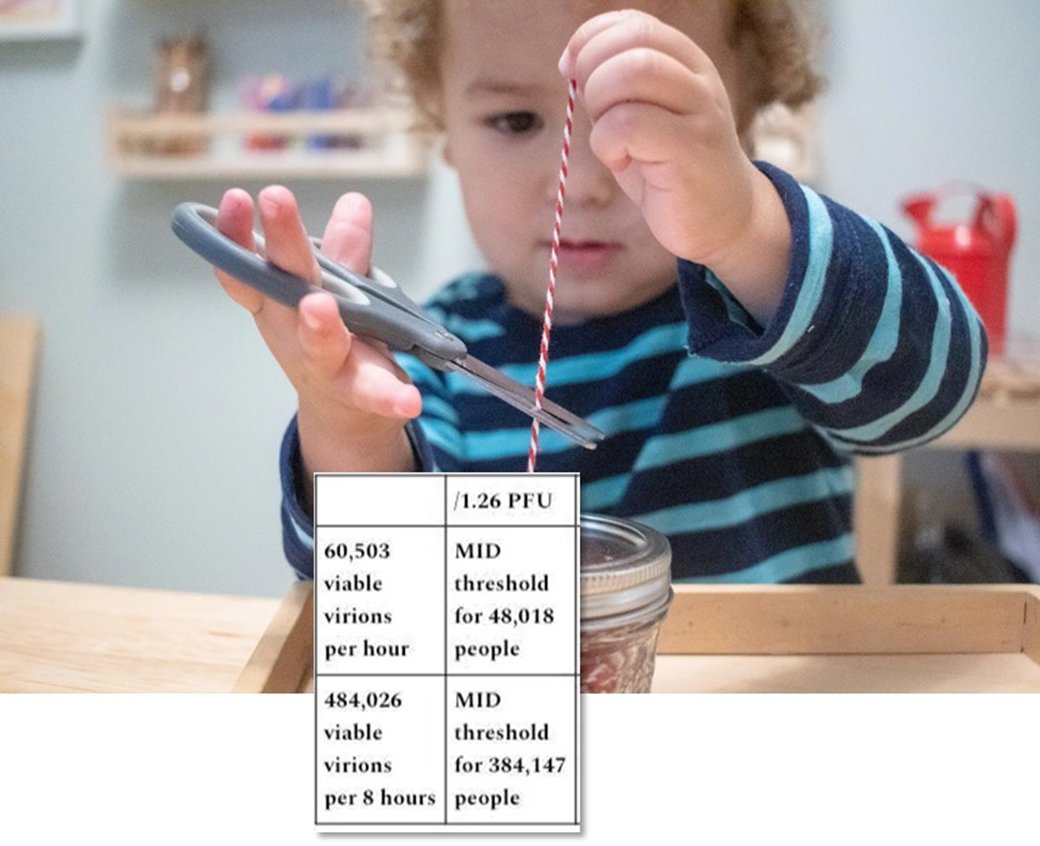
Since they have an agenda, they didn’t do this. They reported that it is reasonable to think that a single person could infect 384,147 people via exhalation over an 8-hour period.
The highest reported number of infections by a single person in a day is 43.
Off by only >99.99%.
The highest reported number of infections by a single person in a day is 43.
Off by only >99.99%.
If people exhaled this much virus, one guy at a sporting event shouting at the players would infect a significant portion, if not all, of the arena. Evidently this needs to be said: nothing remotely close to this has happened in poorly ventilated arenas.
https://x.com/DrHanwell/status/1858689375053509036
Big Picture:
One of the beautiful aspects of science is that many people are studying the same general phenomena (in this case airborne transmission) from numerous angles. While each measurement is independent, they all combine to make the same picture.
They are all connected.
One of the beautiful aspects of science is that many people are studying the same general phenomena (in this case airborne transmission) from numerous angles. While each measurement is independent, they all combine to make the same picture.
They are all connected.

Each piece of evidence helps refine our knowledge on the subject. With each measurement, the unknowns get smaller. Through researching from different fields, we get a more complete understanding of an interconnected and complex process.
Everything has to CUMULATIVELY make sense.
Everything has to CUMULATIVELY make sense.
When the goal is misinformation, the interconnectivity of science is utterly ignored. Each argument made is independent of all others.
The connections are actively cut.
The connections are actively cut.

For example, in order to believe that masks don’t work because of the high viral load, one NEEDS to believe that a single person can infect >1M people in a 24-hour period.
This, of course, is untethered from reality.
This, of course, is untethered from reality.
To be clear, there are people not alive today because they believed what they were told about the efficacy of masks.
Misinformation costs lives. And seeing how things are going now, it seems to be getting worse.
Misinformation costs lives. And seeing how things are going now, it seems to be getting worse.
Summary:
I believe that much of what people think about airborne disease transmission, and what does and does not work in terms of mitigation, is largely summed up by this figure. And to this day, the numbers in the x-axis are still up for debate.
I believe that much of what people think about airborne disease transmission, and what does and does not work in terms of mitigation, is largely summed up by this figure. And to this day, the numbers in the x-axis are still up for debate.

From my reading of the literature, the typical values largely break down based on activity and look something like this. Others may disagree.
Again, these are very rough estimates to make a general point. There is also person to person variability that may push things up a bit
Again, these are very rough estimates to make a general point. There is also person to person variability that may push things up a bit

The aim of this thread was not to discuss precise values in the figure below, but rather to discuss the general trend, and how a fundamental misunderstanding of a single valuable can be used to deliberately cause a lot of harm.
Understanding the initial exhaled viral is both one of the most challenging measurements to make, but also the most important.
Everything else is downstream of that, including our measurements on viral decay…
Everything else is downstream of that, including our measurements on viral decay…
Alright, well, that was a long one. I hope you found that interesting/useful. If you have any questions/thoughts/insights, please add them to the thread.
As a reward for making it this far, here's a photo of Okanagan Lake from Summerland I took during my recent trip back home:
As a reward for making it this far, here's a photo of Okanagan Lake from Summerland I took during my recent trip back home:

• • •
Missing some Tweet in this thread? You can try to
force a refresh