Mike Hoerger, PhD MSCR MBA Profile picture
Jul 29 12 tweets 8 min read Read on X
PMC COVID Dashboard, July 28, 2025 (U.S.)
🧵1/12

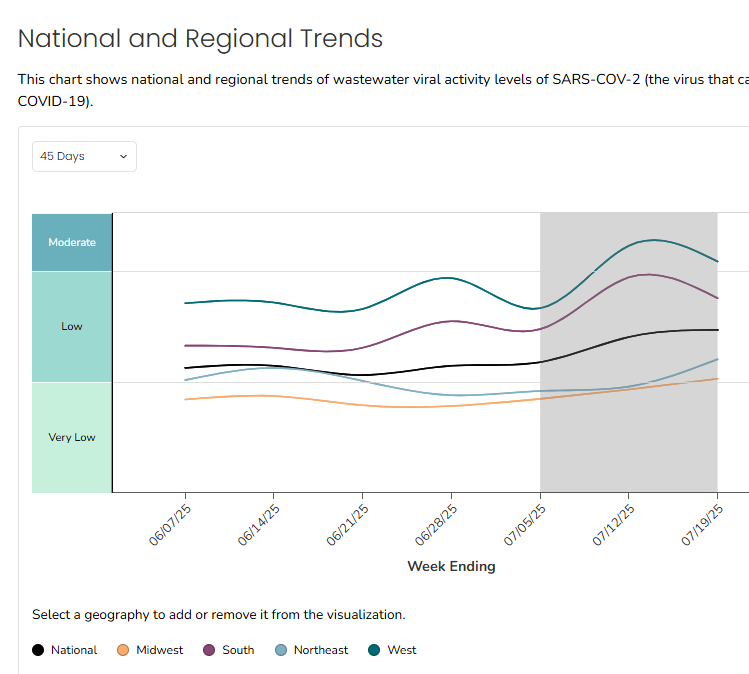
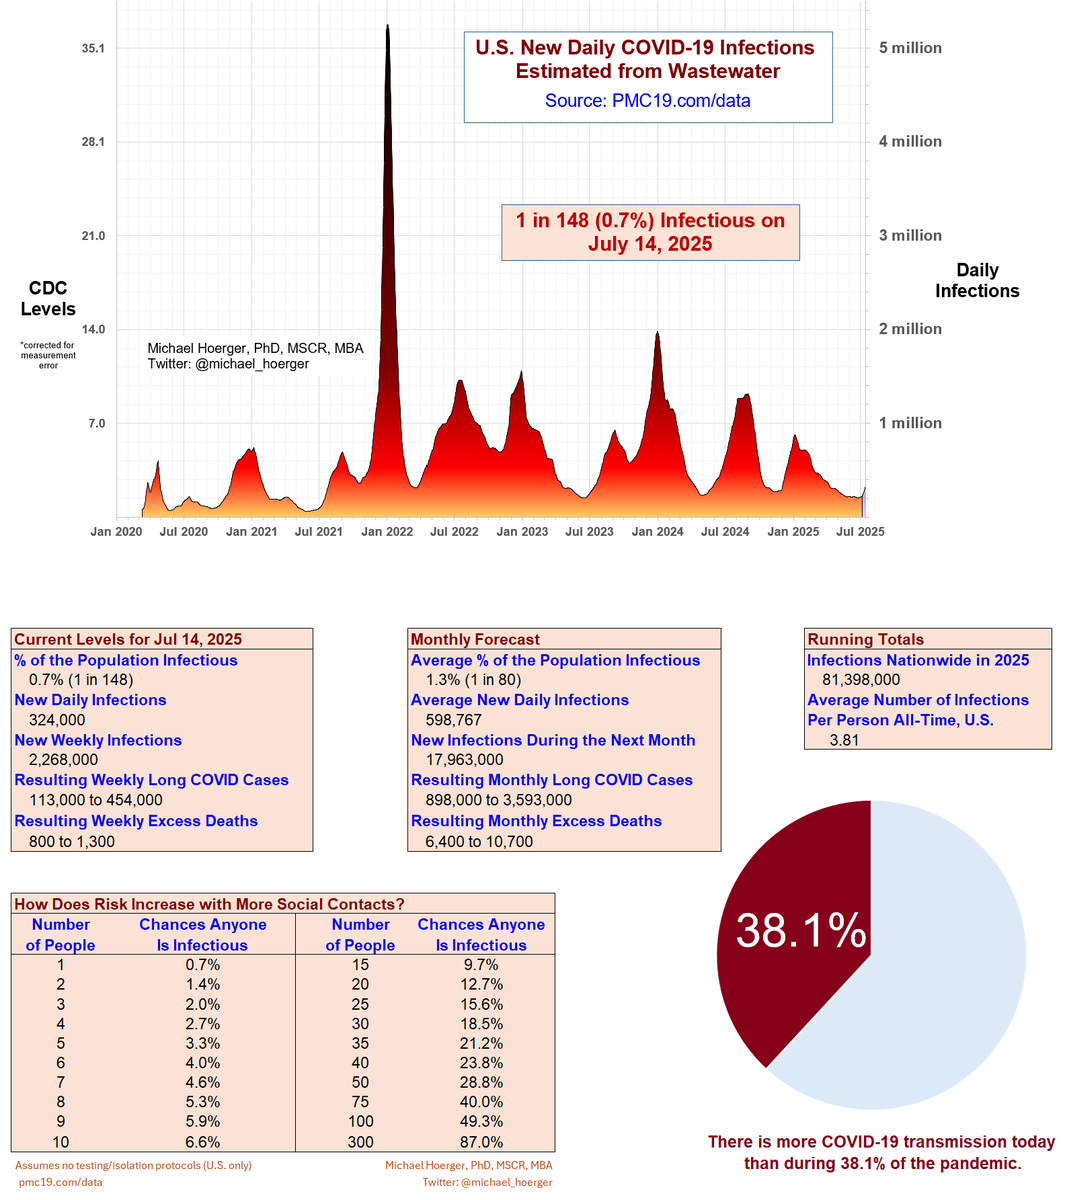
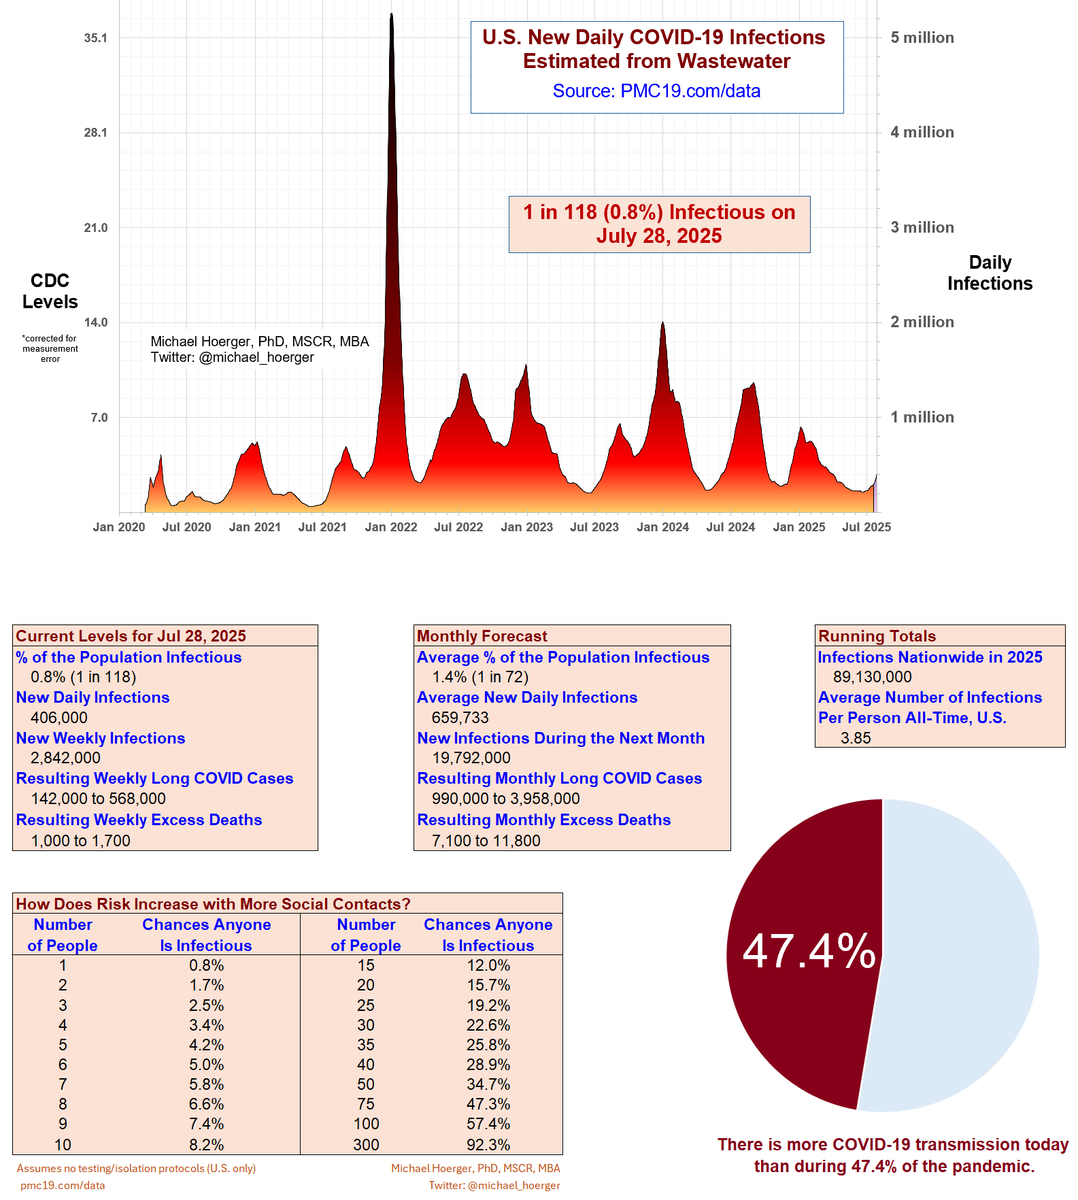
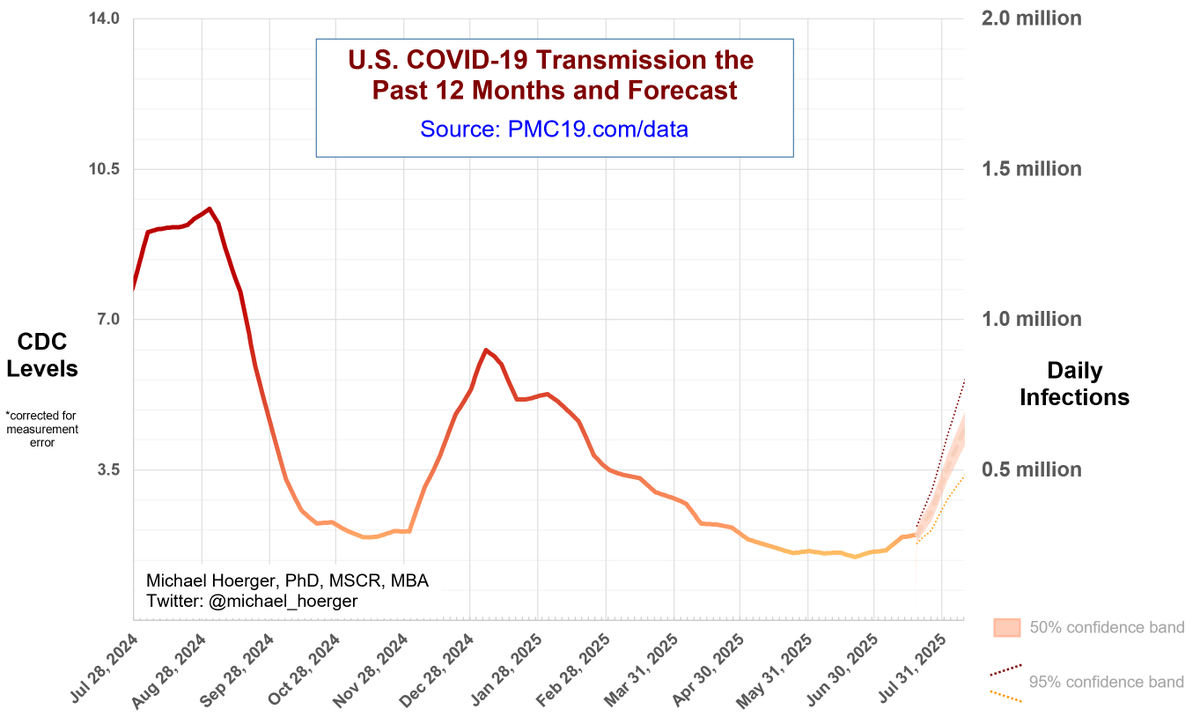
PMC estimates 400,000 new daily infections. 1 in 118 people actively infectious.

Weekly stats:
🔹2.8 million infections (>40x reported cases)
🔹>140,000 resulting #LongCOVID cases
🔹>1,000 resulting excess deaths Heat map Very High: Louisiana, Guam High: Hawai'i, Florida
PMC COVID Dashboard, July 28, 2025 (U.S.)
🧵2/12

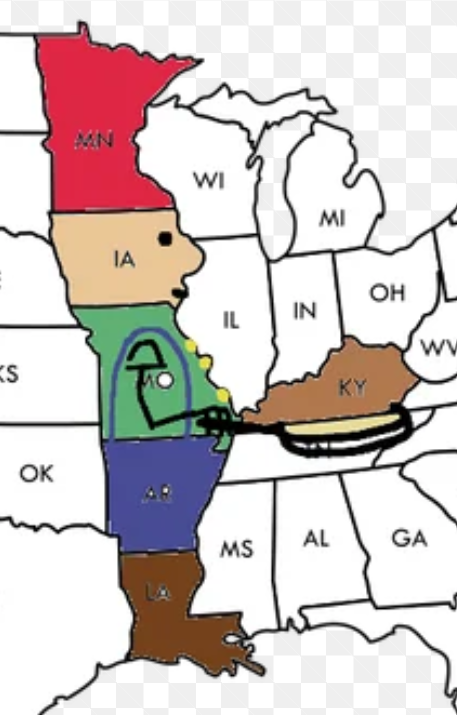
Please excuse any typos and delays. Any time Mimal's boot turns deep red, we're doing local outreach in addition to dashboard work, etc.

If you don't know Mimal yet, you won't be able to unsee them.
es.wikipedia.org/wiki/MIMALDeep red boot = Louisiana
Minnesota (M), Iowa (I), Missouri (M), Arkansas (A), Louisiana (L) = Mimal  Louisiana is the boot.   Sometimes depicted with Kentucky fried chicken on a Tennessee pan.
PMC COVID Dashboard, July 28, 2025 (U.S.)
🧵3/12

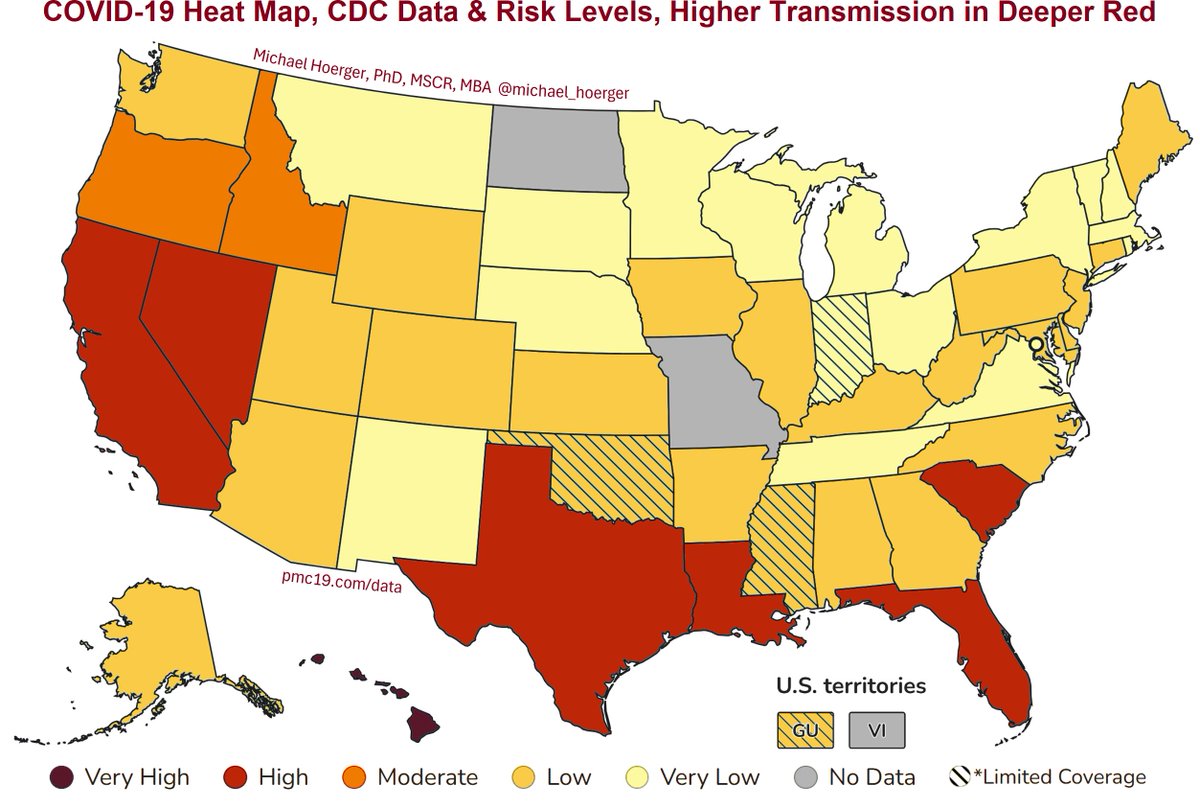
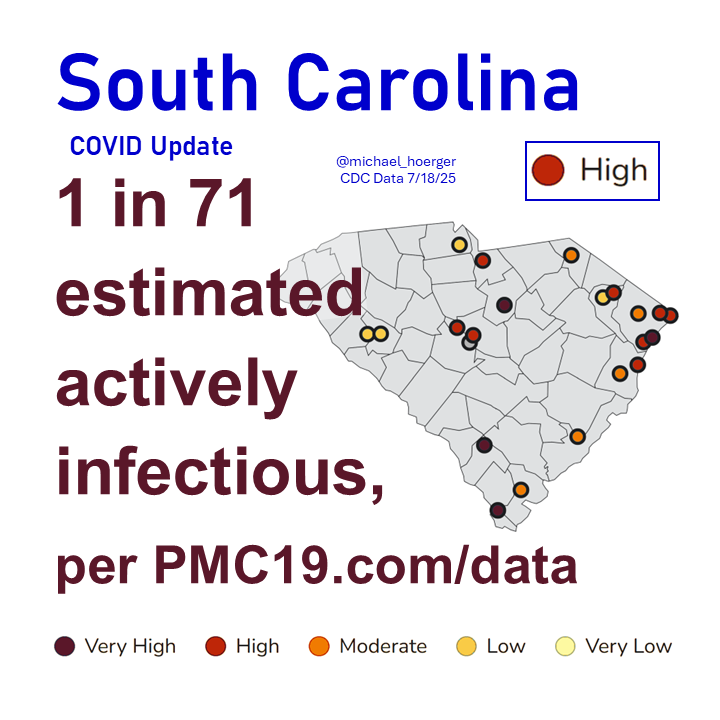
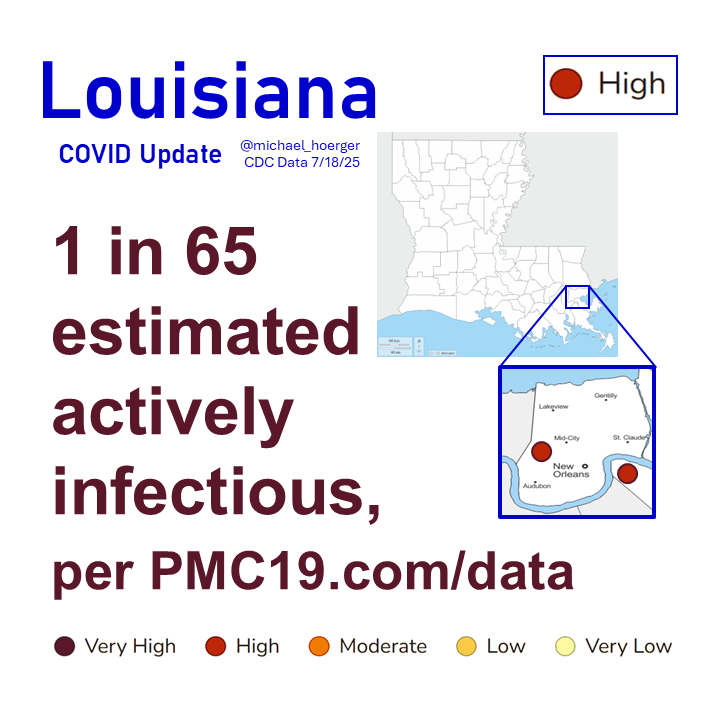
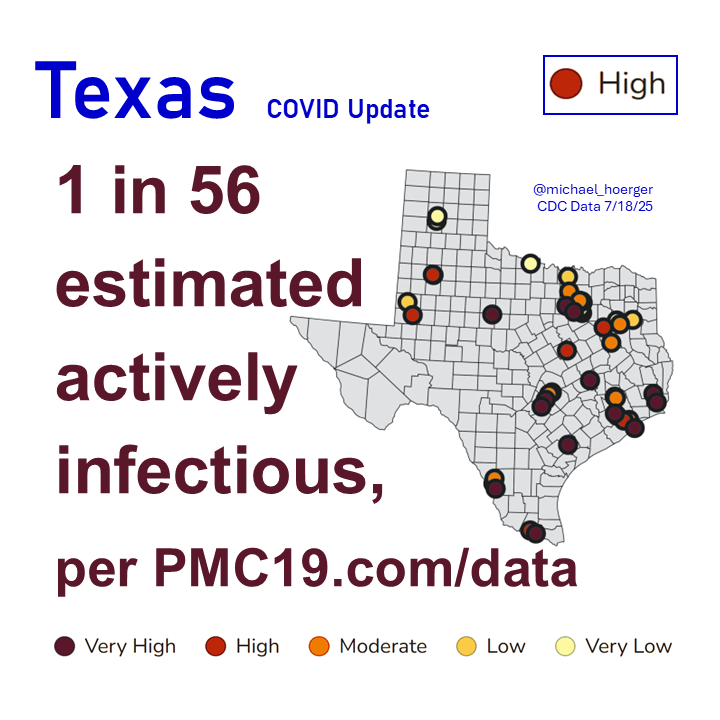
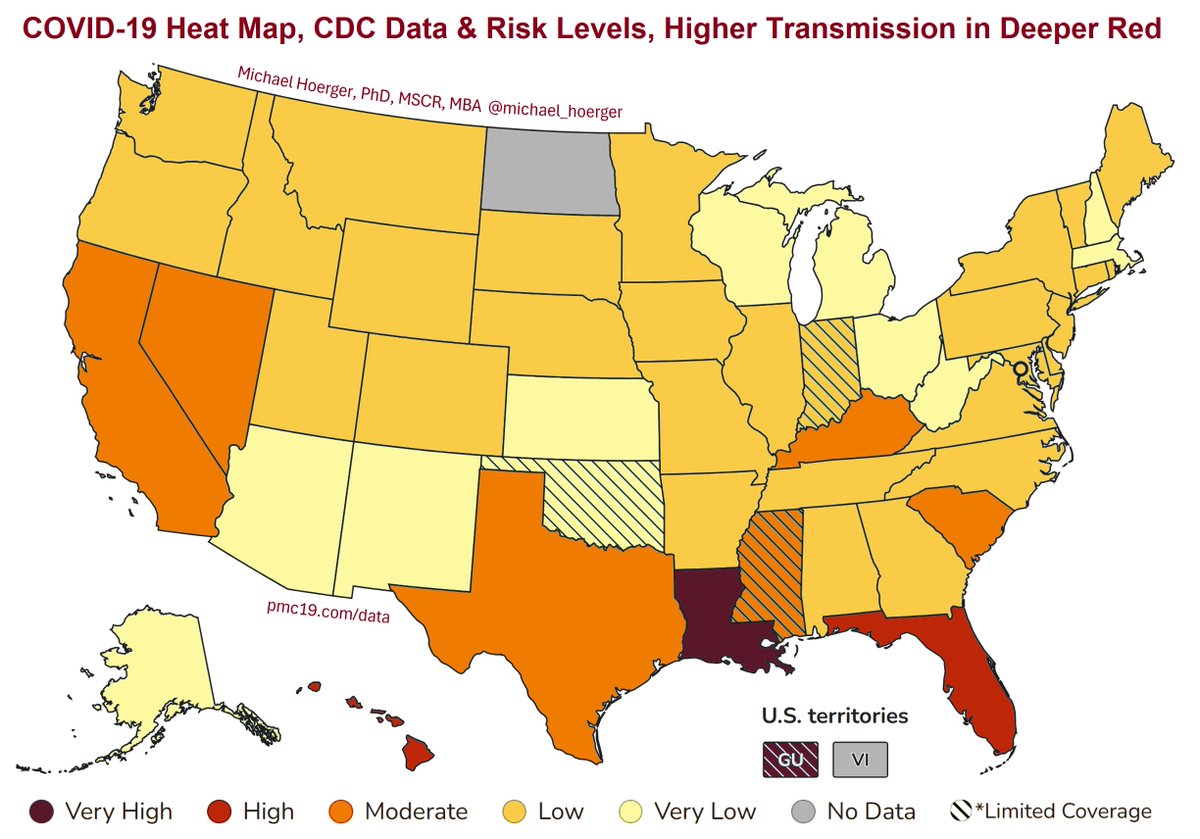
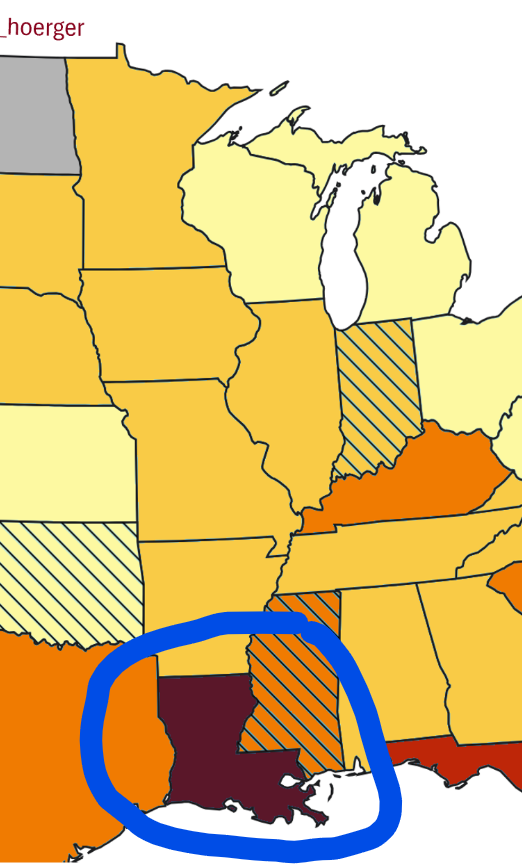
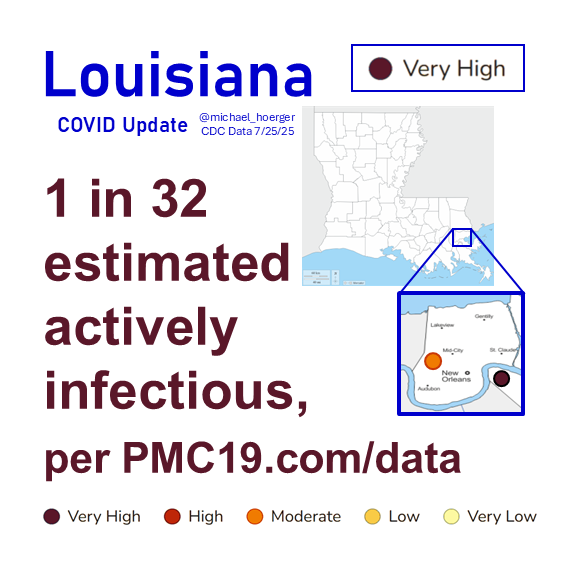
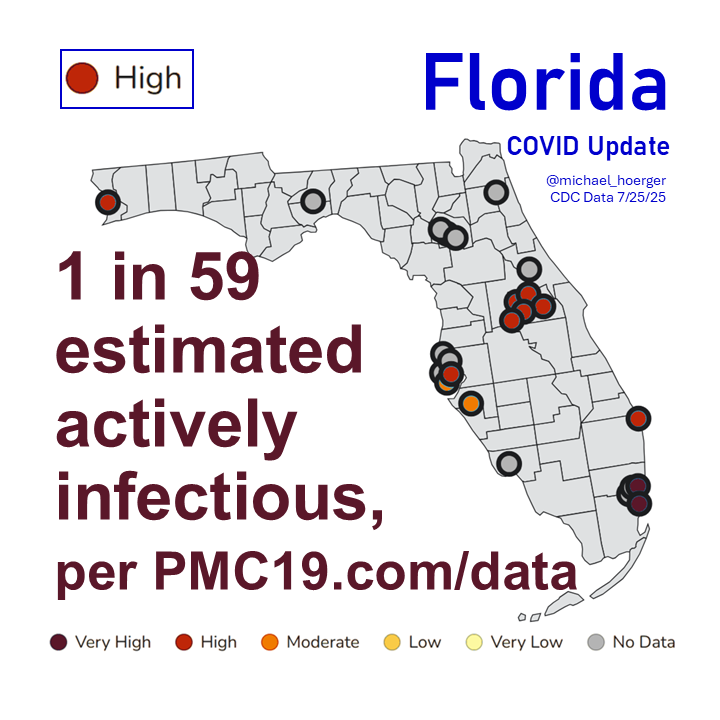
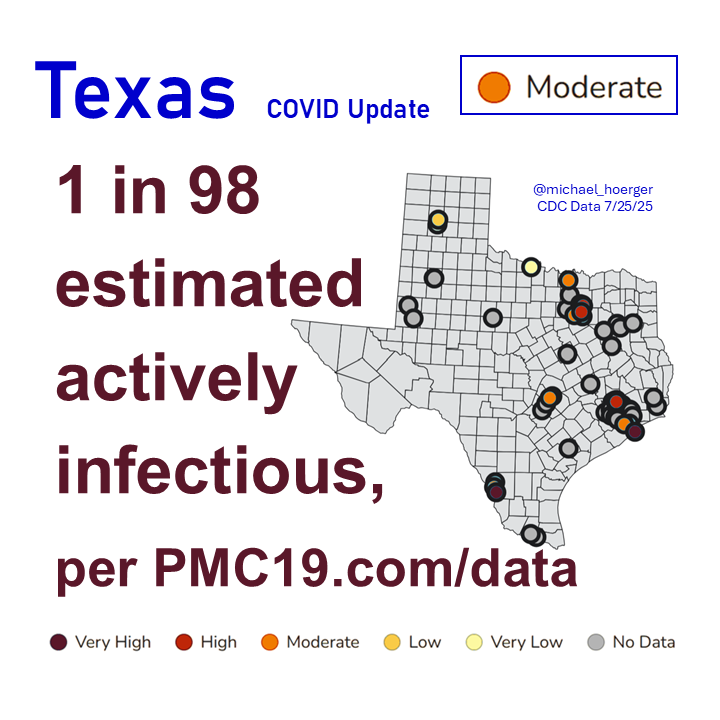
It's HOT COVID SUMMER in the Deep South. No geographic/political prejudices, see next.

Covid is burning through Guam, Louisiana, Florida, and Texas (underestimate due to sites down). Louisiana: 1 in 32, Very High (CDC)
Texas: 1 in 98, Moderate (underestimate, CDC)
Guam: 1 in 25, Very High (CDC)
Florida: 1 in 59, High (CDC)
PMC COVID Dashboard, July 28, 2025 (U.S.)
🧵4/12

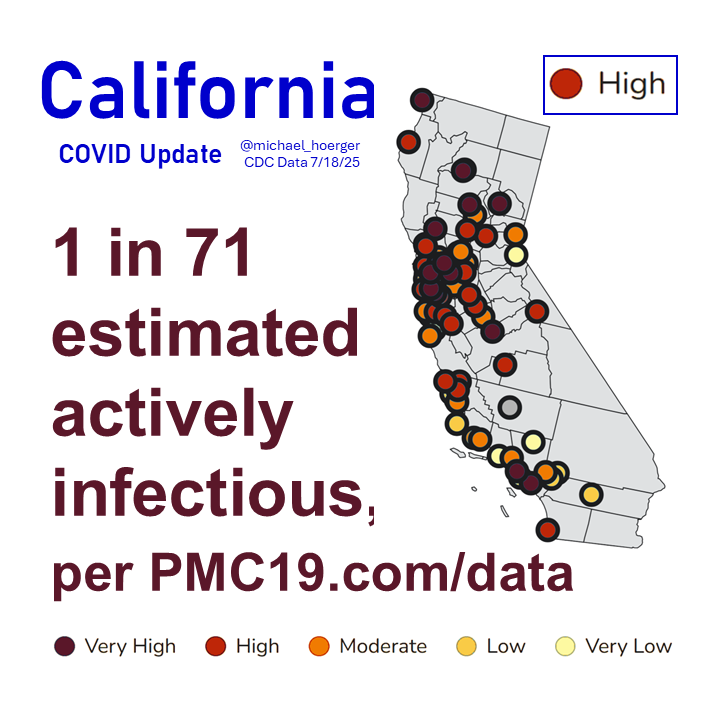
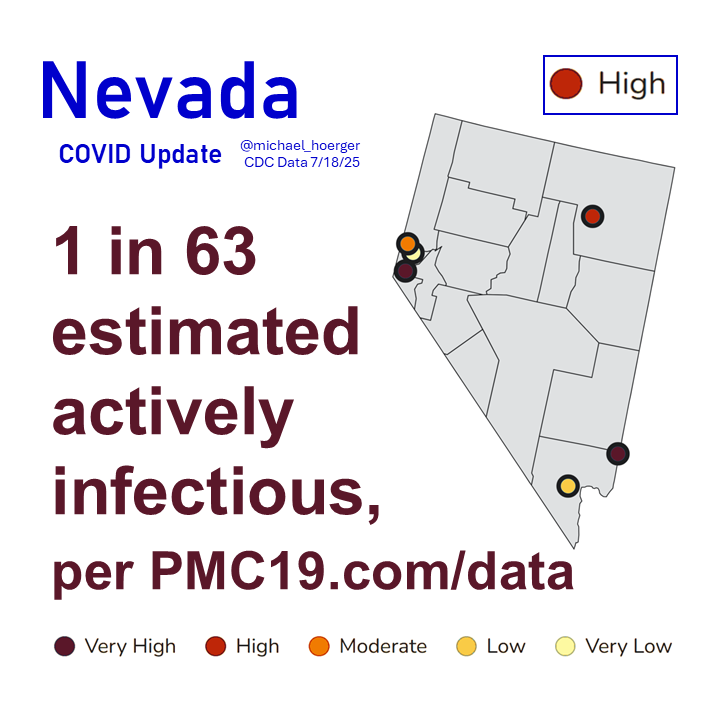
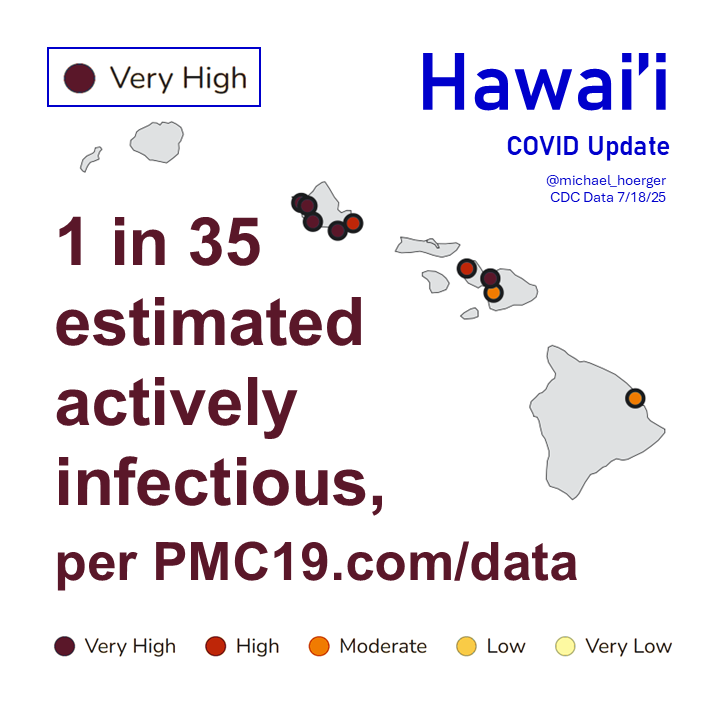
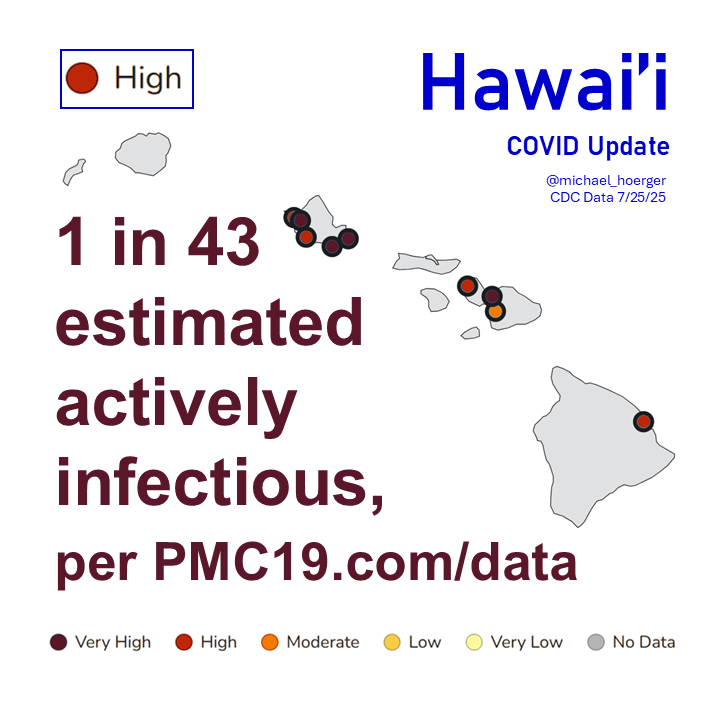
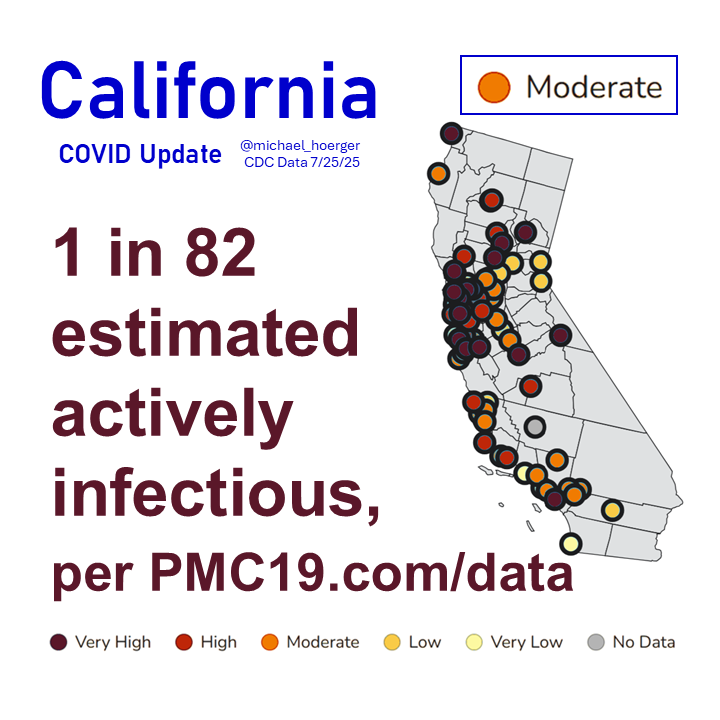
It's also HOT COVID SUMMER out West. No geographic/political prejudices, see previous.

California and Hawai'i have unrelenting transmission. Hawai'i: 1 in 43, High (CDC)
California: 1 in 82, Moderate (CDC), with High/Very High in many areas
PMC COVID Dashboard, July 28, 2025 (U.S.)
🧵5/12

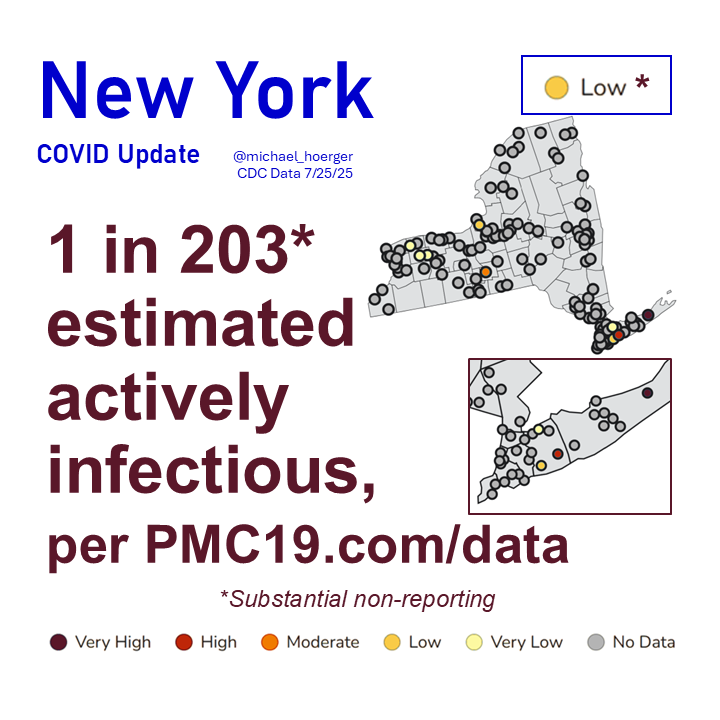
New York State is mostly in the dark on COVID transmission. The CDC has most sites offline. The NYS dashboard includes the most recent estimates. It was getting bad in NYC before lights out.

NY Links: pmc19.com/data/index.php…New York: 1 in 203, but many sites offline. CDC says "Low" but too little data to say
NY State has many sites offline but has most recent data mapped geospatially and shows "high" transmission in the NYC area
PMC COVID Dashboard, July 28, 2025 (U.S.)
🧵6/12

Texas has fallen from High to Moderate, but it appears to be an artifact with many sites going offline this week.

High transmission sites going offline adds noise to the forecast. Uncertain times. Texas: 1 in 98, but many sites fell offline
PMC COVID Dashboard, July 28, 2025 (U.S.)
🧵7/12

Today you experienced a typical day in the last 5.5 years of the pandemic, with transmission higher than 47% of days, and lower than 53%.

Typical means that in a room of 35 people, there's a 1 in 4 chance of exposure. Current Levels for Jul 28, 2025	 % of the Population Infectious	 0.8% (1 in 118)	 New Daily Infections	 406000	 New Weekly Infections	 2842000	 Resulting Weekly Long COVID Cases	 142,000 to 568,000	 Resulting Weekly Excess Deaths	 1,000 to 1,700	 	 Monthly Forecast	 Average % of the Population Infectious	 1.4% (1 in 72)	 Average New Daily Infections	 659733.3333	 New Infections During the Next Month	 19792000	 Resulting Monthly Long COVID Cases	 990,000 to 3,958,000	 Resulting Monthly Excess Deaths	 7,100 to 11,800	 	 Running Totals	 Infections Nationwide in 2025	 89130000	 Average Number o...
PMC COVID Dashboard, July 28, 2025 (U.S.)
🧵8/12

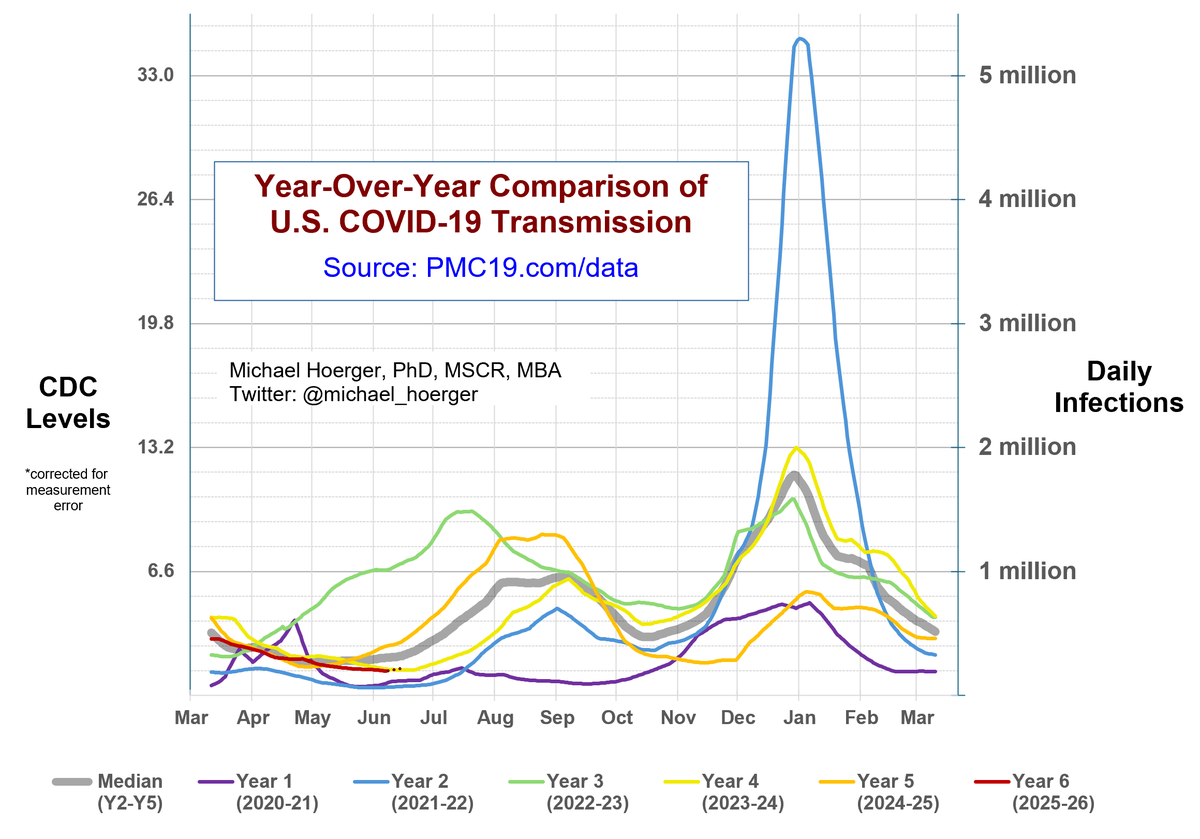
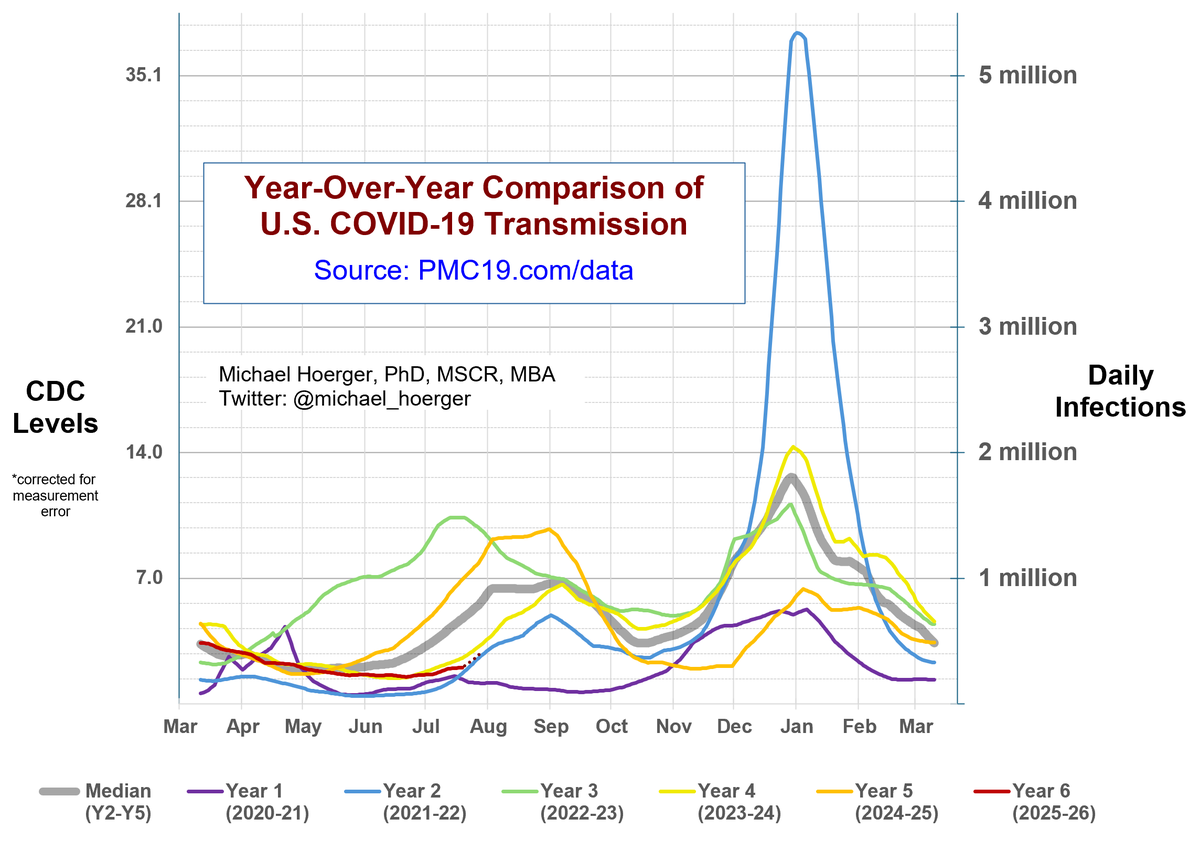
The year-over-year graph shows that current transmission (red line) is similar to that of 2 years ago (yellow line) and 4 years ago (blue line).

The forecast formally models year-over-year trends and recent transmission. We are estimated to soon reach 500,000 daily infections, but with low real-time data quality, regional variation, and much uncertainty.Forecast for increasing transmission with considerably uncertainty
year over year graph, Covid rising, like past summers
PMC COVID Dashboard, July 28, 2025 (U.S.)
🧵9/12

Spain offers an illustrative example of uncertainty ahead. Wastewater data are limited to sites (albeit many) in the Barcelona area and reported monthly. XFG took off with limited warning.

The U.S. sites have much better representation and report more frequently so can spot a surge with greater warning.

Note: The variant-naming system (XFG) is not community-centered. It's jargon. Even the nickname, "stratus," is unhelpful jargon. For communities dealing with this jargon, we recommend the following memory tip:

XFG = X-FG, X-FoG, or eXtra brain FoG.

Each reinfection increases the cumulative chances of brain fog and other neurologic, vascular, and multisystemic damage.
x.com/michael_hoerge…
PMC COVID Dashboard, July 28, 2025 (U.S.)
🧵10/12

It's a good time to stock up on masks and tests. WellBefore is my go-to brand for disposable kids' masks. I've made 2 major purchase orders the past month to donate to local kids.

I receive no preferential discounts, kickbacks, or other financial benefit from any company, including in the COVID space. I talk to many company leaders regularly and worked out the 10% discount.

Let me know if the discount code works or if you need any help with sizing.WellBefore, discount code: HOERGER10 10% off masks and tests
PMC COVID Dashboard, July 28, 2025 (U.S.)
🧵11/12

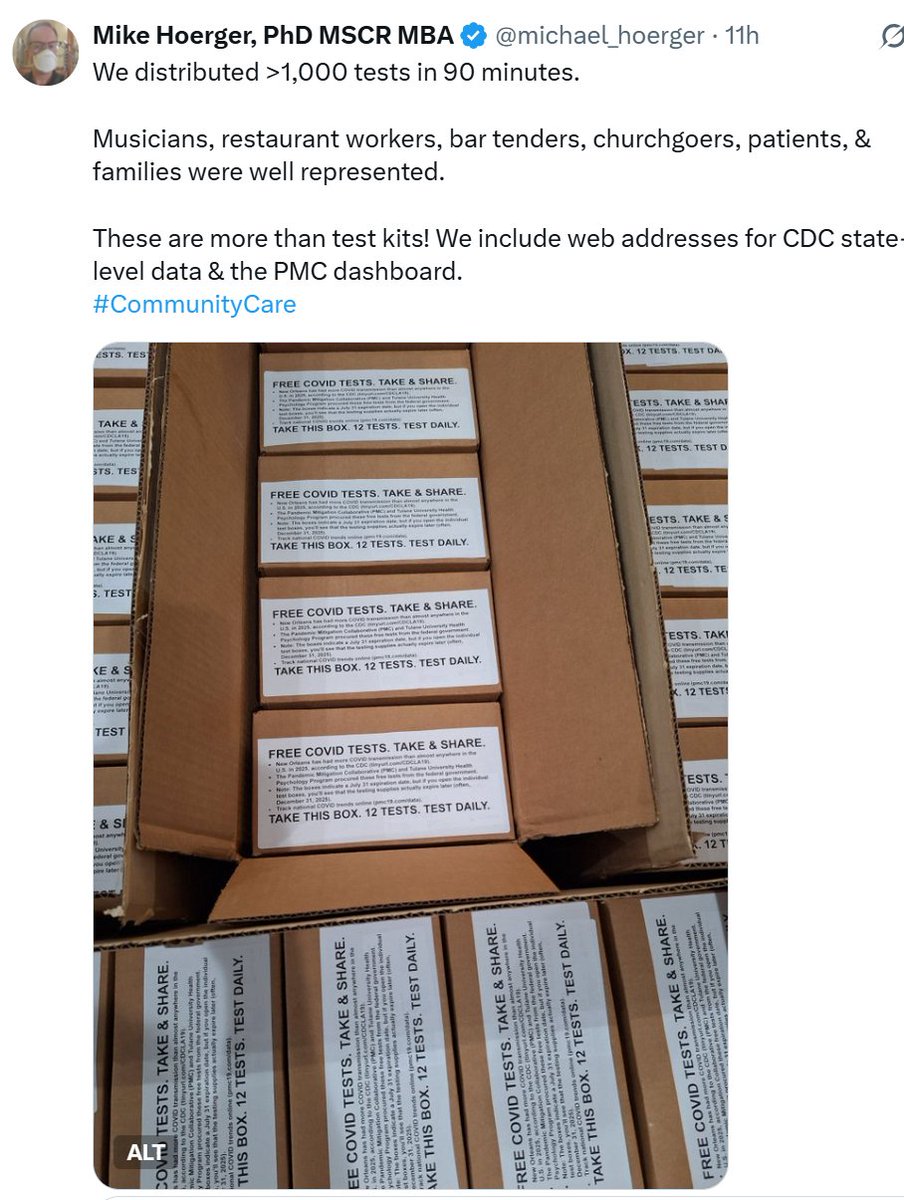
Serious people continue to take COVID very seriously. We distributed 1,000 tests in 90 minutes today.

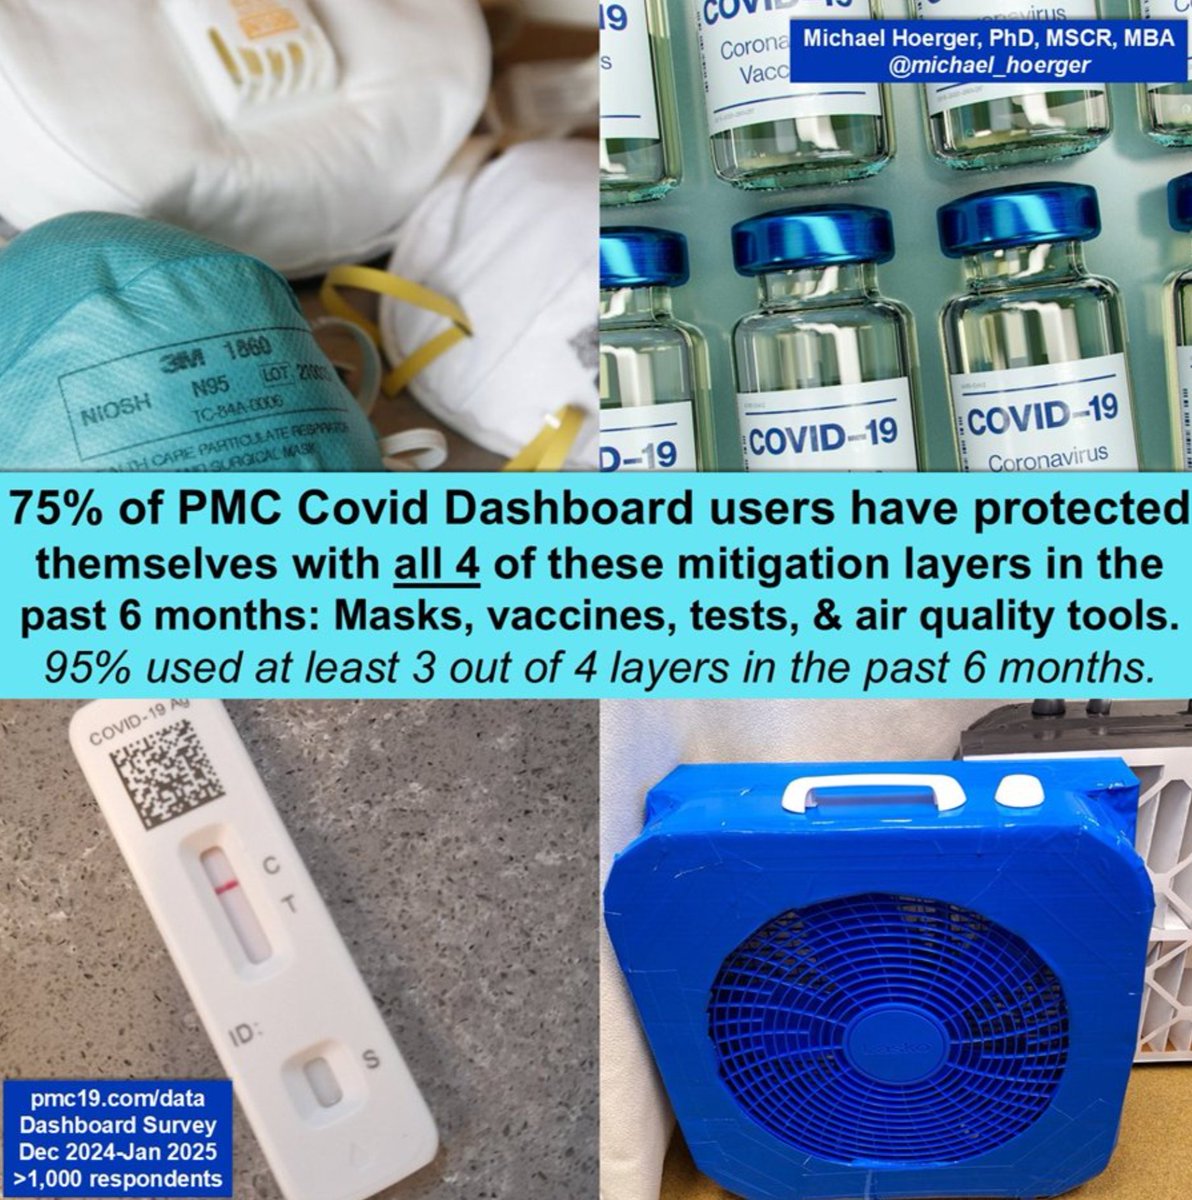
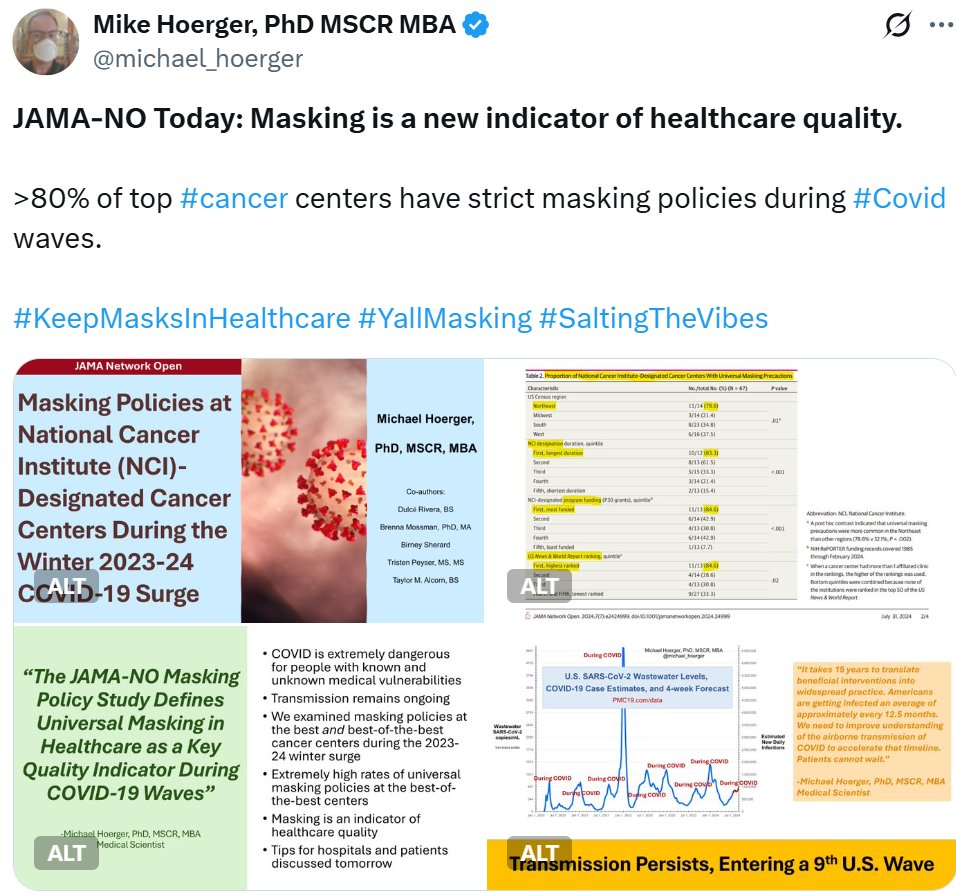
Serious folks mask, vax, test, and clean the air. Top health systems require universal masking. We distributed >1,000 tests in 90 minutes.   Musicians, restaurant workers, bar tenders, churchgoers, patients, & families were well represented.  These are more than test kits! We include web addresses for CDC state-level data & the PMC dashboard.  #CommunityCare
Over 75% of PMC Covid Dashboard viewers note using 4 layers of mitigation (masks, vax, tests, air quality) in the past 6 months. 95% use at least 3 out of 4 layers.
JAMA-NO Today: Masking is a new indicator of healthcare quality.  >80% of top #cancer centers have strict masking policies during #Covid waves.  #KeepMasksInHealthcare #YallMasking #SaltingTheVibes
PMC COVID Dashboard, July 28, 2025 (U.S.)
🧵12/12

If you found this thread helpful, please RT the first Tweet, like each post to boost, use/improve the images here and on the dashboard, and share across platforms.
pmc19.com/data

x.com/michael_hoerge…

• • •

Missing some Tweet in this thread? You can try to force a refresh
 

Keep Current with Mike Hoerger, PhD MSCR MBA

Mike Hoerger, PhD MSCR MBA Profile picture

Stay in touch and get notified when new unrolls are available from this author!

Read all threads

This Thread may be Removed Anytime!

PDF

Twitter may remove this content at anytime! Save it as PDF for later use!

Try unrolling a thread yourself!

how to unroll video
  1. Follow @ThreadReaderApp to mention us!

  2. From a Twitter thread mention us with a keyword "unroll"
@threadreaderapp unroll

Practice here first or read more on our help page!

More from @michael_hoerger

Jul 25
U.S. CDC numbers just released. Good news (for those not in Louisiana). "Only" a 5% national increase.

2025 has closely tracked with summer 2023 transmission. A 12-13% increase would have been expected based on those numbers. That said... Up: Midwest, Northeast Down: West, South
real-time data have been prone to retroactive corrections. This is frustrating, of course, because it leaves people making decisions based on data that are only of good quality when 2 weeks old.

If we saw a 12% increase this week, I'd say look at 2023 for a glimpse...
at the future. Instead, I would consider these plausible scenarios:
🔹Wave still similar to 2023
🔹Later wave with schools more implicated
🔹Something temporarily much better

Of course, temporarily better often means...
Read 6 tweets
Jul 21
1. PMC COVlD Dashboard, July 21, 2025 (U.S.)

COVlD is surging in 7 states, according to the CDC.
🔹Hawai'i (Very High)
🔹California (High)
🔹Nevada (High)
🔹Texas (High)
🔹Louisiana (High)
🔹Florida (High)
🔹South Carolina (High) Heat map, summarized in post
2. PMC COVlD Dashboard, July 21, 2025 (U.S.)

Western surge:
🔹California: 1 in 63 actively infectious, much higher in LA & Bay areas
🔹Hawai'i: 1 in 35 actively infectious
🔹Nevada: 1 in 63 actively infectious

These are wastewater derived estimates, not from individual tests CA map with stat summarized in post
NV  map with stat summarized in post
HI  map with stat summarized in post
3. PMC COVlD Dashboard, July 21, 2025 (U.S.)

Southern surge:

🔹Texas: 1 in 56
🔹Louisiana (New Orleans): 1 in 65
🔹Florida: 1 in 66
🔹South Carolina: 1 in 71

Again, wastewater estimates (wise indicator), not individual testing (low-quality data). SC map and stat noted in post
LA map and stat noted in post
FL map and stat noted in post
TX map and stat noted in post
Read 12 tweets
Jul 15
1) PMC COVlD Dashboard, July 14, 2025 (U.S.) 🧵

We estimate 1 in 148 Americans are actively infectious. This equates to 2.3 million infections/week, expected to result in >100,000 new #LongCOVID conditions & >800 deaths.

A room of 100 people is a coin toss of an exposure. Figure shows each wave of the pandemic.   Tables: Current Levels for Jul 14, 2025	 % of the Population Infectious	 0.7% (1 in 148)	 New Daily Infections	 324000	 New Weekly Infections	 2268000	 Resulting Weekly Long COVID Cases	 113,000 to 454,000	 Resulting Weekly Excess Deaths	 800 to 1,300	 	 Monthly Forecast	 Average % of the Population Infectious	 1.3% (1 in 80)	 Average New Daily Infections	 598766.6667	 New Infections During the Next Month	 17963000	 Resulting Monthly Long COVID Cases	 898,000 to 3,593,000	 Resulting Monthly Excess Deaths	 6,400 to 10,700	 	 Running Totals	 Infection...
2) PMC COVlD Dashboard, July 14, 2025 (U.S.) 🧵

Transmission (red) is closely tracking the path of 2 years ago (yellow). However, the incoming data are spotty. >20% of CDC states have limited/no data, & Biobot hasn't reported in weeks.

Could be MUCH worse or slightly better. Graph of year over year transmission. The current year (red) is tracking the path of two years ago (yellow) extremely closely. Two years ago, the peak was around September 1, at about 1 million daily estimated infections, and significantly higher than the Delta wave (blue).
3) PMC COVlD Dashboard, July 14, 2025 (U.S.) 🧵

Our model formalizes the mathematical assumptions in those predictions. If transmission follows what we know in terms of how waves grow or slow generally and historical patterns, this is what we'd expect.

The spottiness of the current real-time data reduce precision substantially. Retroactive corrections can make the forecast jump around from better to worse from one week to the next. Expect the worst. Hope for the best.Graph shows national transmission expected to increase the next several weeks.
Read 11 tweets
Jul 2
🌍Want to track COVID transmission accurately worldwide?

This PMC thread walks you through leading dashboards with information more up to date than WHO & EU directories.

🧵 1/ World map, countries with high-quality up-to-date surveillance systems shown in blue.
The Pandemic Mitigation Collaborative (PMC) Dashboard provides weekly COVID updates for the U.S., using wastewater surveillance derived case estimation models and analytic forecasting.

We have added a list of international dashboards:
🧵 2/
pmc19.com/data/index.php…Australia: NSW Health Australia Department of Health, Western Australia Austria: Federal Government of Austria City of Vienna - Regional Coron-A Consortium Austria Czech Republic: State Health Institute Czech Republic Belgium: Belgian Institute for Health Canada: Government of Canada Andrew Young's Canada Visualization C19 Resources Canada * World Health Network (WHN) Canada **
Denmark: Statens Serum Institut Denmark Europe (multi-national): EU Wastewater Observatory Finland: National Institute for Health and Welfare Finland WHN Finland ** France: French Republic Data Airborne Risk Reduction Association (ARRA) France Zan Armstrong's France Visualization COVID Weather App France (Android, IOS, or Web) Thomas Delattre's France Visualization Germany: Infection Radar Germany Bay-VOC Bavaria Region Berlin Waterworks WHN Germany **
Hong Kong: Centre for Health Protection, Hong Kong Hungary: National Center for Public Health and Pharmacy of Hungary India: Pune Knowledge Cluster of India Gujarat Biotechnology Research Centre of India Ireland: Health Protection Surveillance Centre Ireland Japan: Japan Institute for Health Security Latvia: Institute of Food Safety, Animal Health and Environment Latvia Lithuania: National Public Health Centre of Luthuania Luxembourg: Microbs Luxembourg Netherlands: National Institute for Public Health and the Environment Netherlands WHN Netherlands ** New Zealand: New Zealand Institute for...
Slovenia: National Institute of Public Health Slovenia Spain: Government of Catalonia - Regional South Africa: National Institute for Communicable Diseases of South Africa South Korea: Korea Disease Control and Prevention Agency Sweden: Pathogens Sweden Switzerland: Swiss Confederation Federal Office of Public Health ETH Zurich Switzerland WISE Dashboard U.K.: Public Health Scotland Buckinghamshire Disability Service (BuDS) U.K.  *See the numbers 1-21 along the lower left. Click on 3-6 for national and regional data. ** Click on the dropdown menu. May need to try a different web browser.
Our international directory includes official government dashboards & those developed by citizen scientists.

We exclude countries that have stopped reporting in the past 2-12 months even if on EU or WHO lists. We also exclude low-quality data from opt-in testing programs.
🧵 3/
Read 43 tweets
Jun 24
PMC COVlD Dashboard, Jun 23, 2025 (U.S.)

🔥Biggest uptick since Jan
🔥1 in 167 actively infectious
🔥>2 million weekly infections
🔥700-1,200 resulting excess deaths from weekly infections

Track transmission closer to home w/our new state & international resources 👇

🧵1/6
PMC COVlD Dashboard, Jun 23, 2025 (U.S.)

🔹With >90% probability, we have entered the 11th COVlD wave.
🔹In a room of 50 people, there is already a 1 in 4 chance of an exposure.
🔹We expect nearly 15 million infections in the next month, and rising.

🧵2/6Current Levels for Jun 23, 2025	 % of the Population Infectious	 0.6% (1 in 167)	 New Daily Infections	 287000	 New Weekly Infections	 2009000	 Resulting Weekly Long COVID Cases	 100,000 to 402,000	 Resulting Weekly Excess Deaths	 700 to 1,200	 	 Monthly Forecast	 Average % of the Population Infectious	 1.0% (1 in 97)	 Average New Daily Infections	 493300	 New Infections During the Next Month	 14799000	 Resulting Monthly Long COVID Cases	 740,000 to 2,960,000	 Resulting Monthly Excess Deaths	 5,300 to 8,800	 	 Running Totals	 Infections Nationwide in 2025	 74869000	 Average Number of Infect...
PMC COVlD Dashboard, Jun 23, 2025 (U.S.)

We continue to expect transmission to break 500,000 daily infections in the U.S. around July 9th.

This is the same prediction as last week, as the forecast was dead on. Yet, there is considerably uncertainty around this timing.

🧵3/6Longitudinal transmission, past 12 months and 1-month forecast
Read 6 tweets
Jun 17
1) PMC COVlD Dashboard, June 16, 2025 (U.S.)

Current transmission (red line) closely tracks that of summer 2023 (yellow line).

We expect to break 500k daily infections between July 9 and the end of July. Our current forecast...Year over year graph of tranmission
2) PMC COVlD Dashboard, June 16, 2025 (U.S.)

Our current forecast is a bit more aggressive, predicting breaking 500k daily infections by July 9. The 2023 trend suggests end of July.

The 95% confidence interval shows large variation. Note that...Past 12 months of transmission (U.S.) and forecast
3) PMC COVlD Dashboard, June 16, 2025 (U.S.)

Note that CDC and Biobot both had retroactive corrections to last week's data, meaning the relative "lull" will last a little longer than the uncorrected data suggested. No big news on NB.1.8.1.

All good news, but...10 pandemic waves. Soon 11
Read 7 tweets

Did Thread Reader help you today?

Support us! We are indie developers!


This site is made by just two indie developers on a laptop doing marketing, support and development! Read more about the story.

Become a Premium Member ($3/month or $30/year) and get exclusive features!

Become Premium

Don't want to be a Premium member but still want to support us?

Make a small donation by buying us coffee ($5) or help with server cost ($10)

Donate via Paypal

Or Donate anonymously using crypto!

Ethereum

0xfe58350B80634f60Fa6Dc149a72b4DFbc17D341E copy

Bitcoin

3ATGMxNzCUFzxpMCHL5sWSt4DVtS8UqXpi copy

Thank you for your support!

Follow Us!

:(