Bayes' Theorem is a fundamental concept in data science.
But it took me 2 years to understand its importance.
In 2 minutes, I'll share my best findings over the last 2 years exploring Bayesian Statistics. Let's go.
But it took me 2 years to understand its importance.
In 2 minutes, I'll share my best findings over the last 2 years exploring Bayesian Statistics. Let's go.
1. Background:
"An Essay towards solving a Problem in the Doctrine of Chances," was published in 1763, two years after Bayes' death. In this essay, Bayes addressed the problem of inverse probability, which is the basis of what is now known as Bayesian probability.
"An Essay towards solving a Problem in the Doctrine of Chances," was published in 1763, two years after Bayes' death. In this essay, Bayes addressed the problem of inverse probability, which is the basis of what is now known as Bayesian probability.
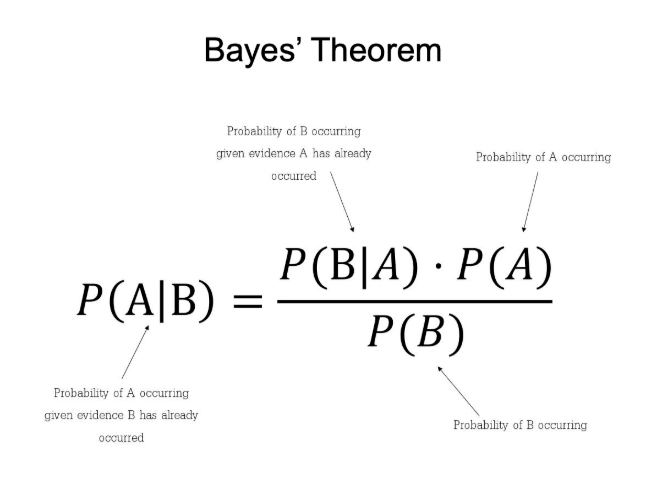
2. Bayes' Theorem:
Bayes' Theorem provides a mathematical formula to update the probability for a hypothesis as more evidence or information becomes available. It describes how to revise existing predictions or theories in light of new evidence, a process known as Bayesian inference.
Bayes' Theorem provides a mathematical formula to update the probability for a hypothesis as more evidence or information becomes available. It describes how to revise existing predictions or theories in light of new evidence, a process known as Bayesian inference.
3. Bayesian Statistics:
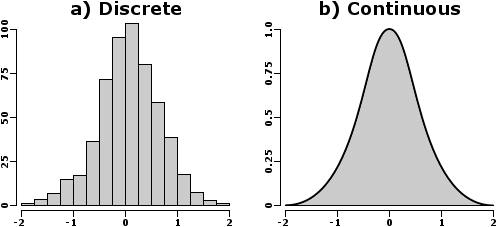
Bayesian Statistics is an approach to statistics that interprets probability as a measure of belief or certainty rather than just a frequency. This belief may be based on prior knowledge of the conditions that might be related to the event or experiment in question.
Bayesian Statistics is an approach to statistics that interprets probability as a measure of belief or certainty rather than just a frequency. This belief may be based on prior knowledge of the conditions that might be related to the event or experiment in question.
This allows for making probabilistic statements about unknown parameters. For instance, instead of estimating a single value for a parameter, Bayesian statistics provides a distribution of possible values, reflecting the uncertainty.
4. Bayesian vs Frequentist:
Bayesian inference is fundamentally about updating beliefs or probabilities as new data is observed, which can be very intuitive and aligns with how we often think about the world. Frequentist statistics interpret probability as the long-run frequency of events.
Bayesian inference is fundamentally about updating beliefs or probabilities as new data is observed, which can be very intuitive and aligns with how we often think about the world. Frequentist statistics interpret probability as the long-run frequency of events.
The problem I have with frequentist approaches is that pre-determined distributions are used (e.g. Normal Gaussian), which does not always make sense.
5. Bayesian Machine Learning:
Any time true confidence and probabilistic decision making is needed, Bayesian is the answer. Here are a couple of examples. Uncertainty Modeling: Unlike traditional machine learning methods that often provide point estimates, Bayesian methods focus on estimating distributions. Time-Series Analysis: Bayesian methods are particularly useful in time-series analysis, where uncertainty in the future is crucial.
Any time true confidence and probabilistic decision making is needed, Bayesian is the answer. Here are a couple of examples. Uncertainty Modeling: Unlike traditional machine learning methods that often provide point estimates, Bayesian methods focus on estimating distributions. Time-Series Analysis: Bayesian methods are particularly useful in time-series analysis, where uncertainty in the future is crucial.
6. Business Context:
Businesses can use Bayes' Theorem to assess and quantify various risks, such as market risks, credit risks, or operational risks. By continuously updating the probability of risks as new information emerges, businesses can make more informed decisions.
Businesses can use Bayes' Theorem to assess and quantify various risks, such as market risks, credit risks, or operational risks. By continuously updating the probability of risks as new information emerges, businesses can make more informed decisions.
There's a new problem that has surfaced --
Companies NOW want AI.
AI is the single biggest force of our decade. Yet 99% of data scientists are ignoring it.
That's a huge advantage to you. I'd like to help.
Companies NOW want AI.
AI is the single biggest force of our decade. Yet 99% of data scientists are ignoring it.
That's a huge advantage to you. I'd like to help.
On Wednesday, August 6th, I'm lifting the curtains on one of my best AI Projects:
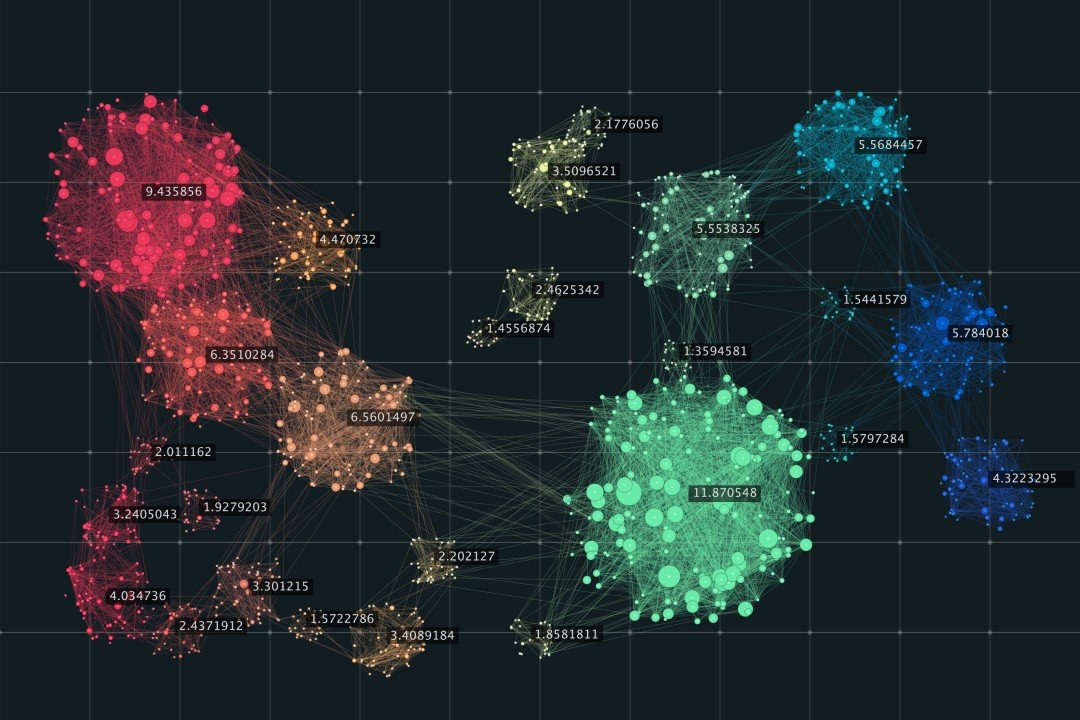
HOW I MADE AN AI CUSTOMER SEGMENTATION AGENT WITH PYTHON (FULL PROJECT)
Register here (limit 500 seats): learn.business-science.io/ai-register
HOW I MADE AN AI CUSTOMER SEGMENTATION AGENT WITH PYTHON (FULL PROJECT)
Register here (limit 500 seats): learn.business-science.io/ai-register
That's a wrap! Over the next 24 days, I'm sharing the 24 concepts that helped me become an AI data scientist.
If you enjoyed this thread:
1. Follow me @mdancho84 for more of these
2. RT the tweet below to share this thread with your audience
If you enjoyed this thread:
1. Follow me @mdancho84 for more of these
2. RT the tweet below to share this thread with your audience
https://twitter.com/815555071517872128/status/1950158978576470020
P.S. Want free AI, Machine Learning, and Data Science Tips with Python code every Sunday?
Don't forget to sign up for my AI/ML Tips Newsletter Here: learn.business-science.io/free-ai-tips
Don't forget to sign up for my AI/ML Tips Newsletter Here: learn.business-science.io/free-ai-tips
• • •
Missing some Tweet in this thread? You can try to
force a refresh