Generative AI, Data Science, Python, and Business (ROI). Join my next live AI workshop (free).👇
 1. Background:
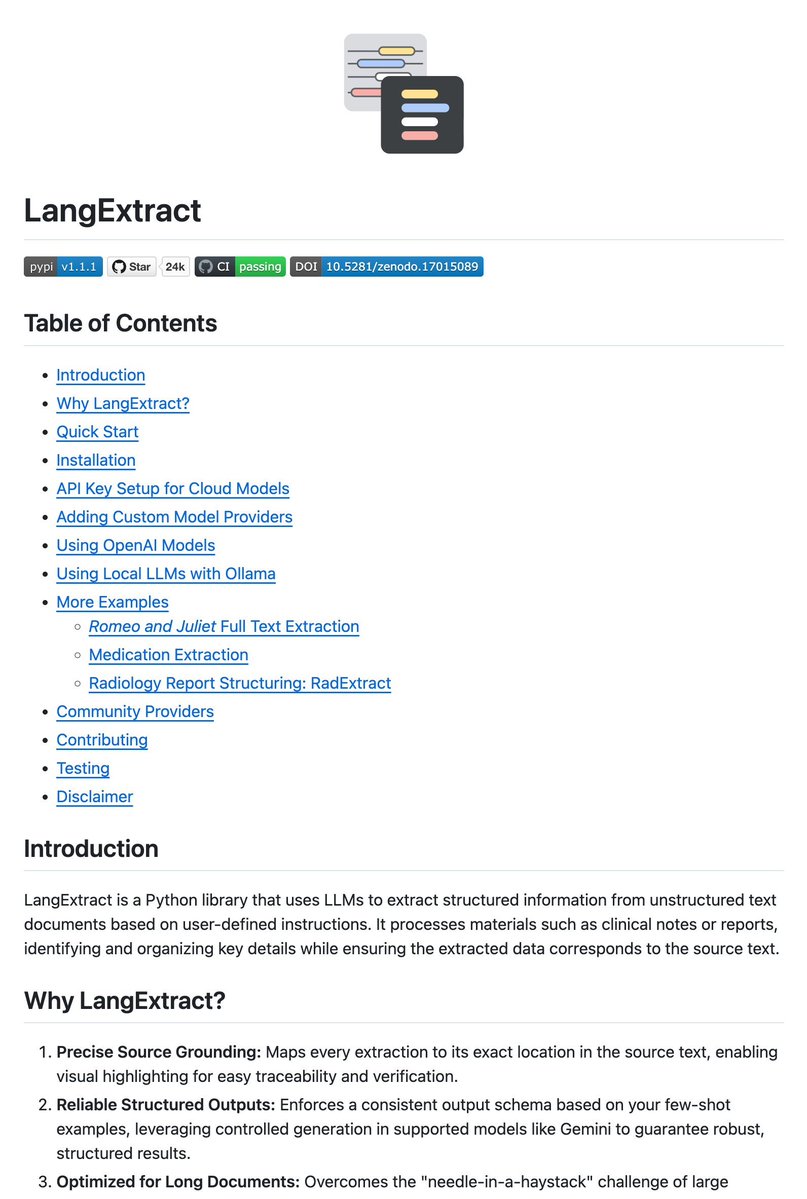
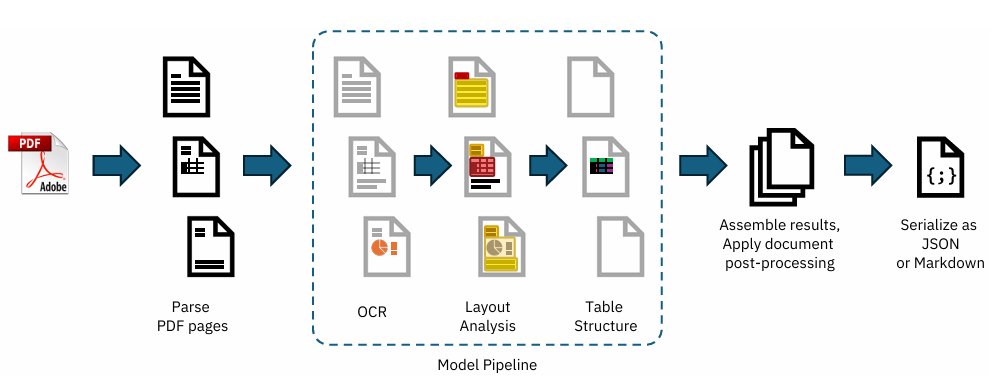
 1. What is Docling?
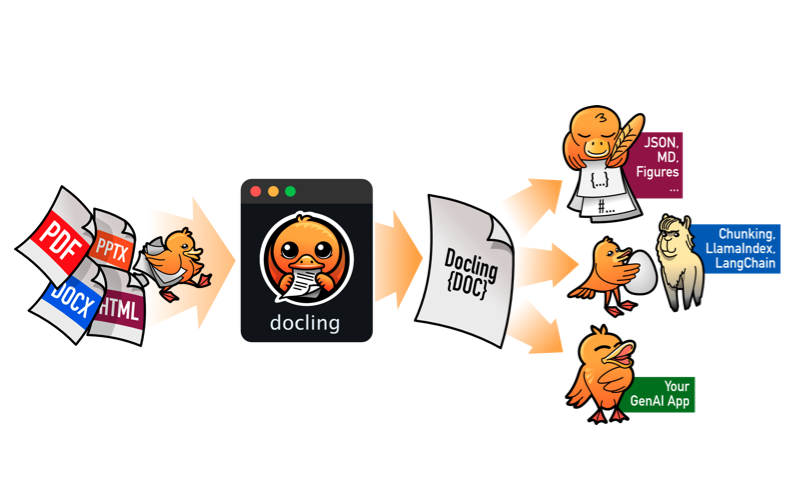
 Companies are sitting on mountains of unstructured data.
 1) Small models can punch way above their weight
 PATTERN 1 — Single Agent
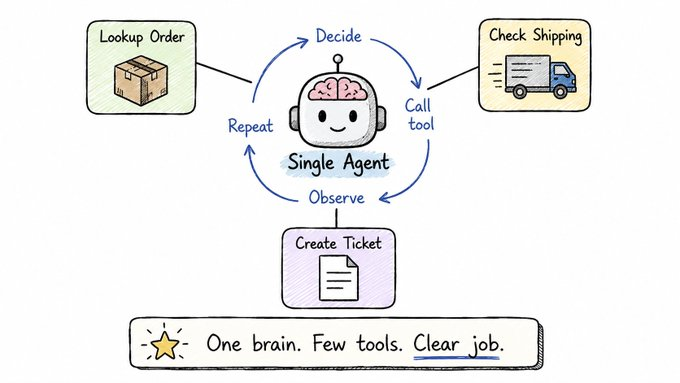
 FULL GUIDE: HOW TO SCALE YOUR MODEL: jax-ml.github.io/scaling-book/
 Chapter 1 introduces the basics of pre-training.
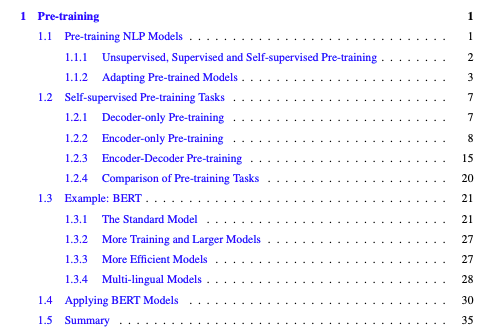
 What it does:
 1. The 6 Diagnostic Checks Every Data Scientist Should Run
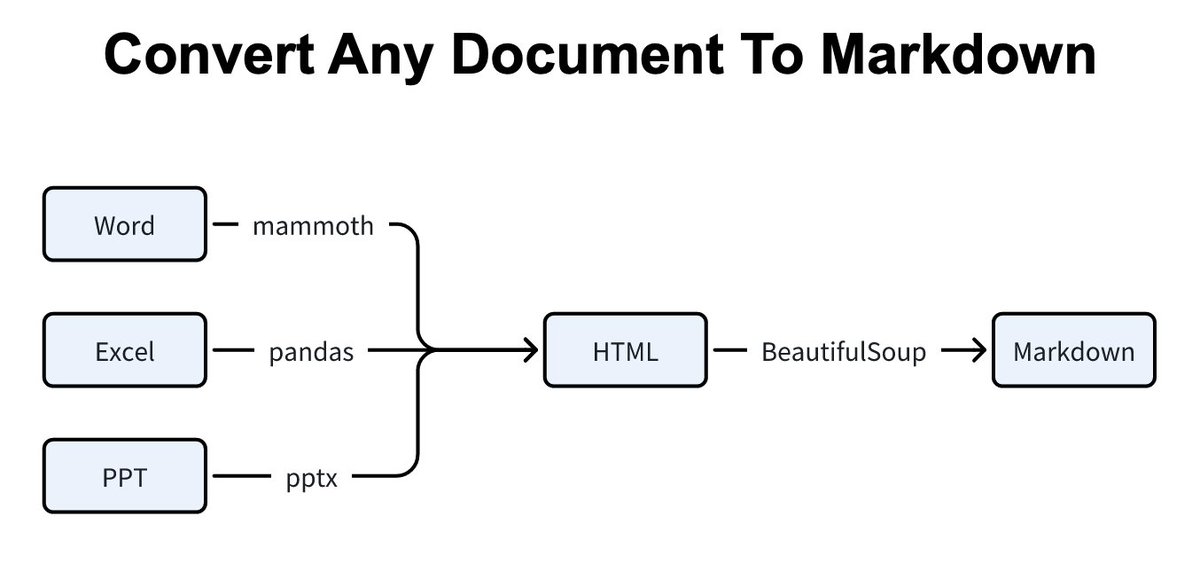 1. Document Parsing Pipelines
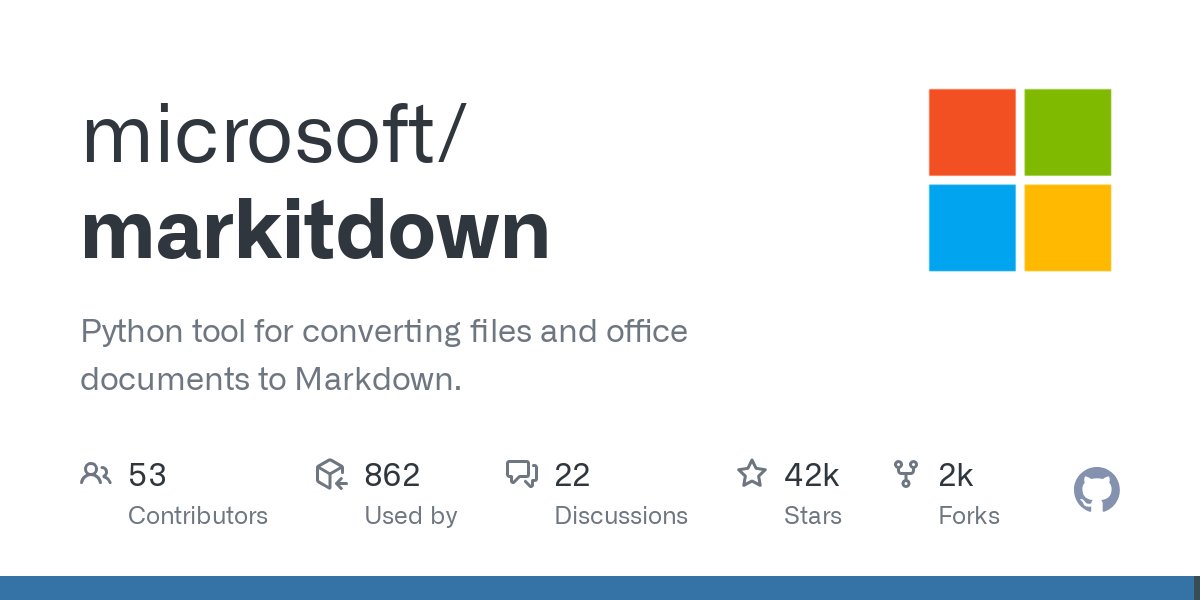
 1. The 6 Diagnostic Checks Every Data Scientist Should Run
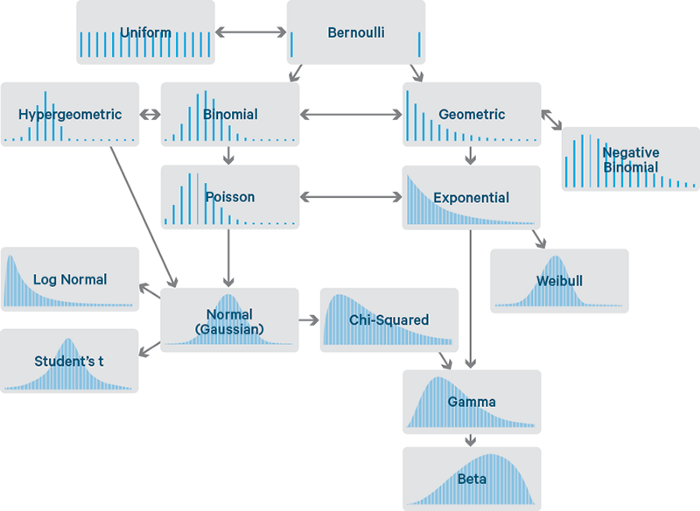 1. Statistical Distributions:
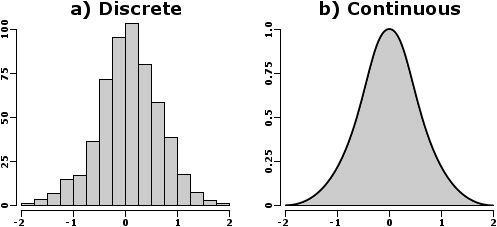
 A few weeks ago, Karpathy showed where research was heading:
 Step 1: Learn These Descriptive Statistics
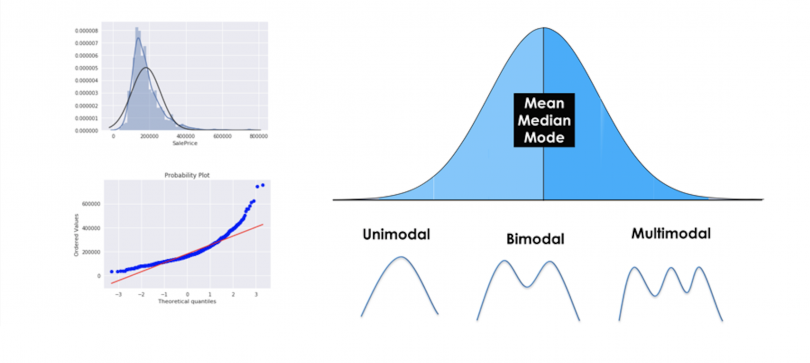
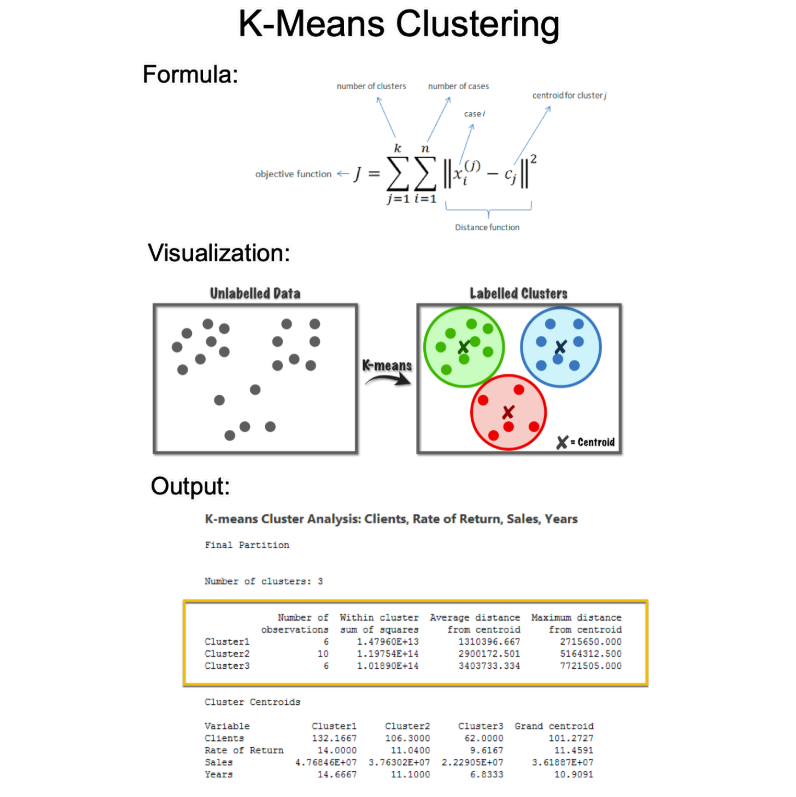 1. K-Means
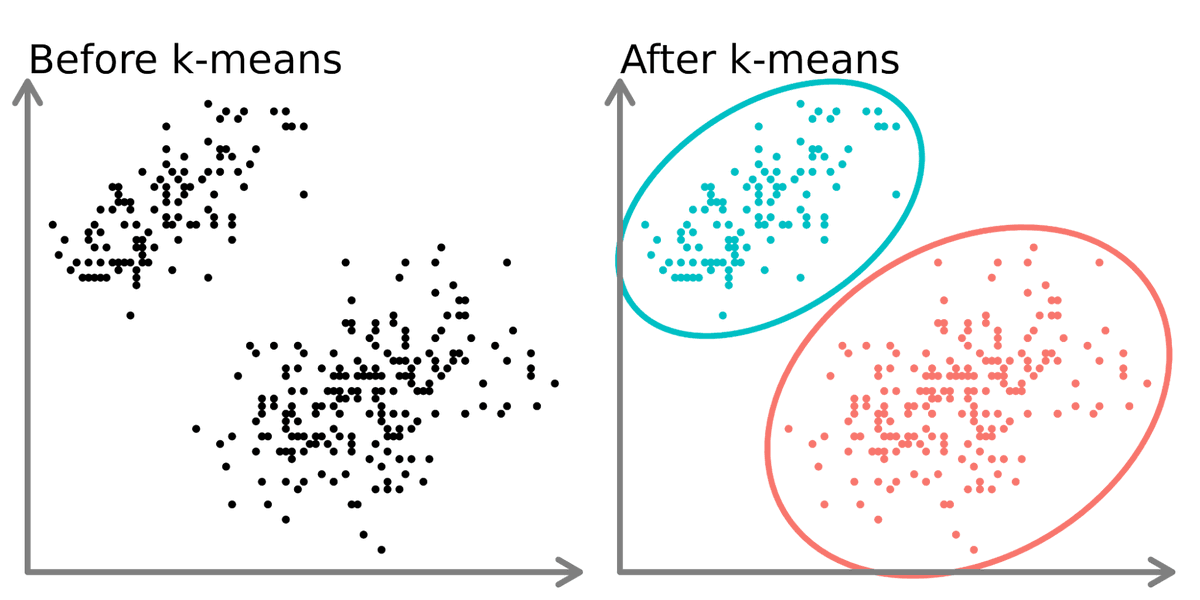
 1. What is Docling?
 1. Document Parsing Pipelines
 What it does:
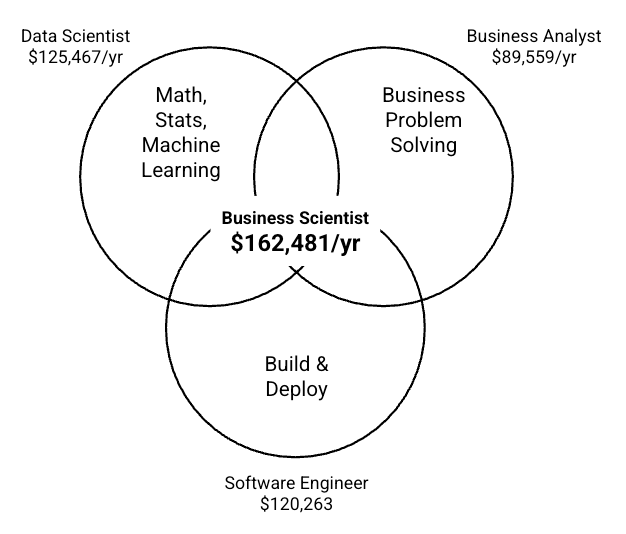 For years, data science rewarded people for producing outputs:
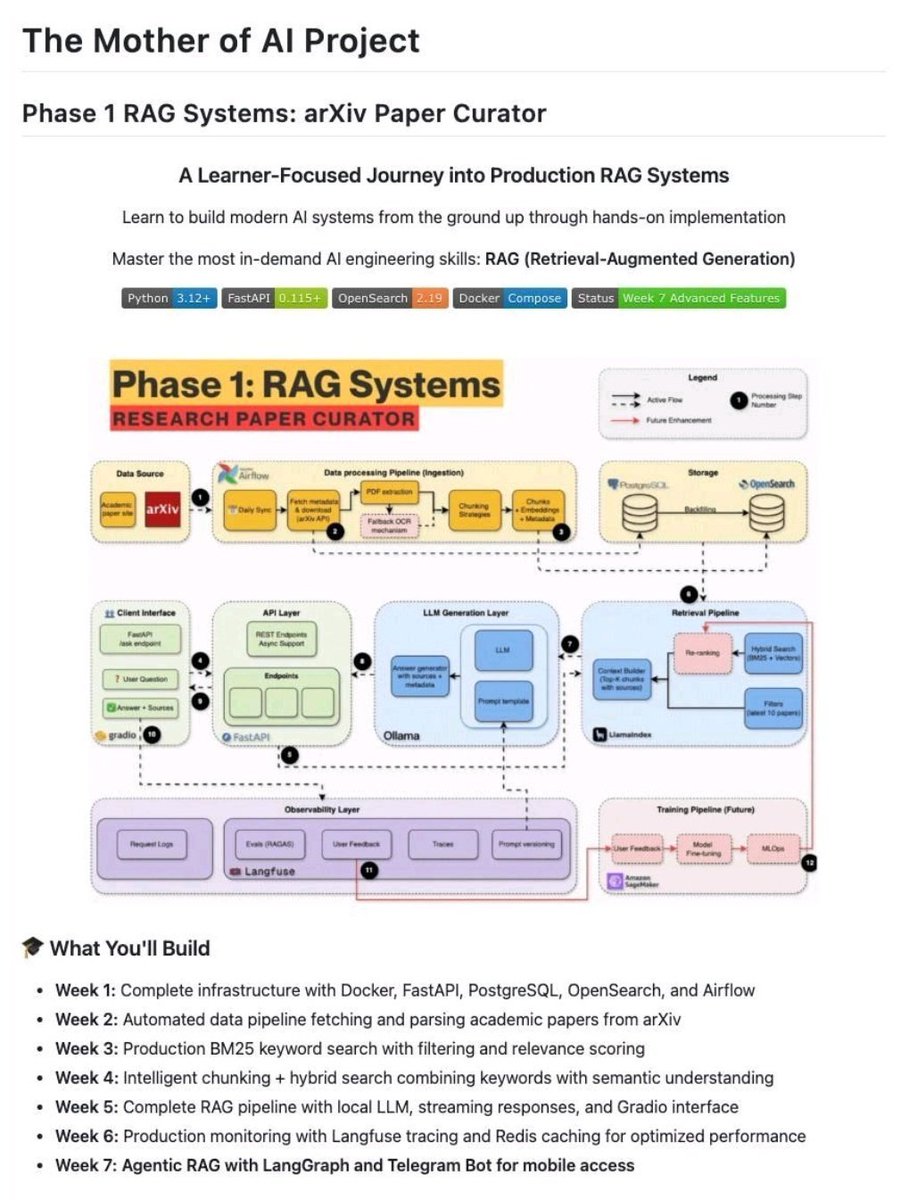 Docker. FastAPI. PostgreSQL. OpenSearch. Airflow. Hybrid search. LangGraph. Production monitoring.
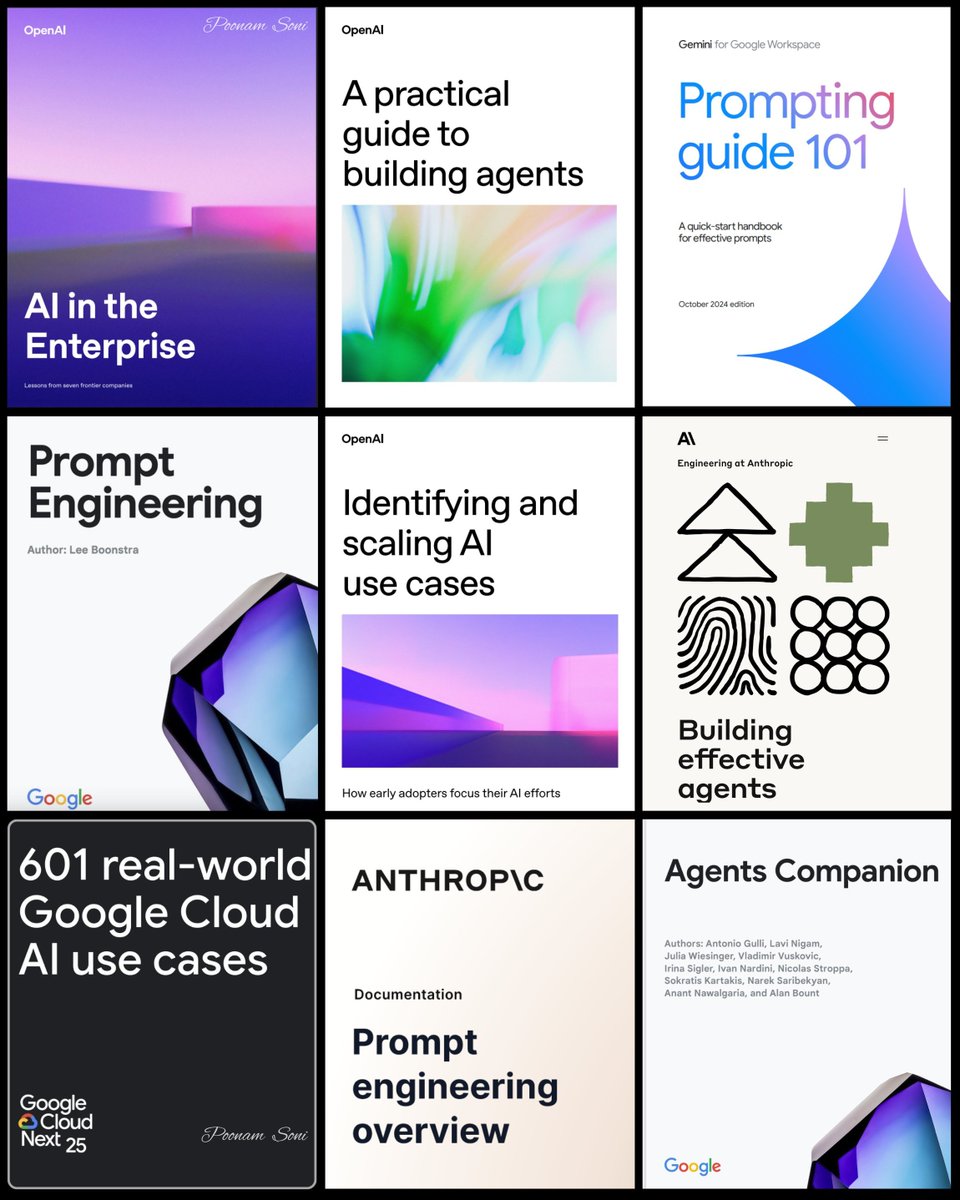 1. AI in the Enterprise by OpenAI