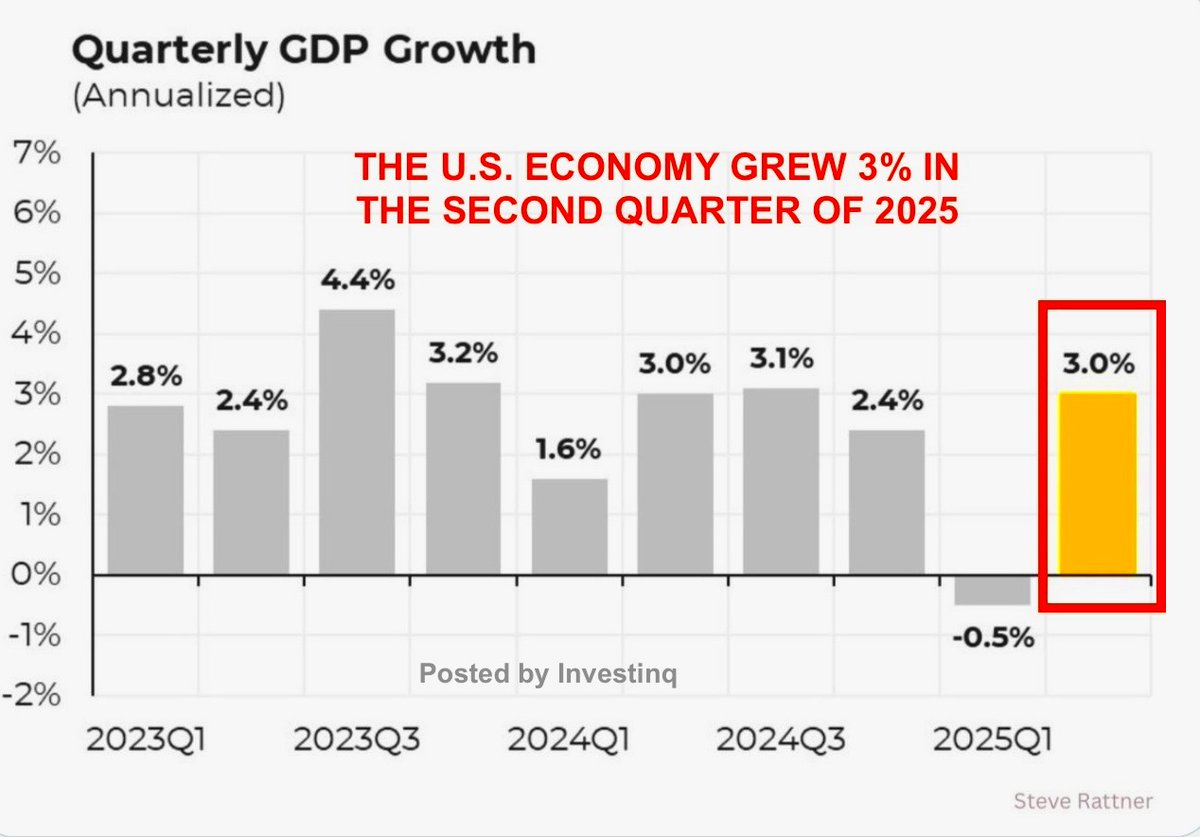
🚨 U.S. GDP rose 3.0% last quarter but don’t be fooled.
The headline hides a fragile economy propped up by tariffs and a sharp drop in imports.
Here’s why the numbers don’t tell the full story.
(Save this thread)
The headline hides a fragile economy propped up by tariffs and a sharp drop in imports.
Here’s why the numbers don’t tell the full story.
(Save this thread)
First, what is GDP? Gross Domestic Product is the total value of all goods and services produced in the country.
It’s the single most important metric for tracking economic growth.
But how it’s calculated matters just as much as the final number.
It’s the single most important metric for tracking economic growth.
But how it’s calculated matters just as much as the final number.
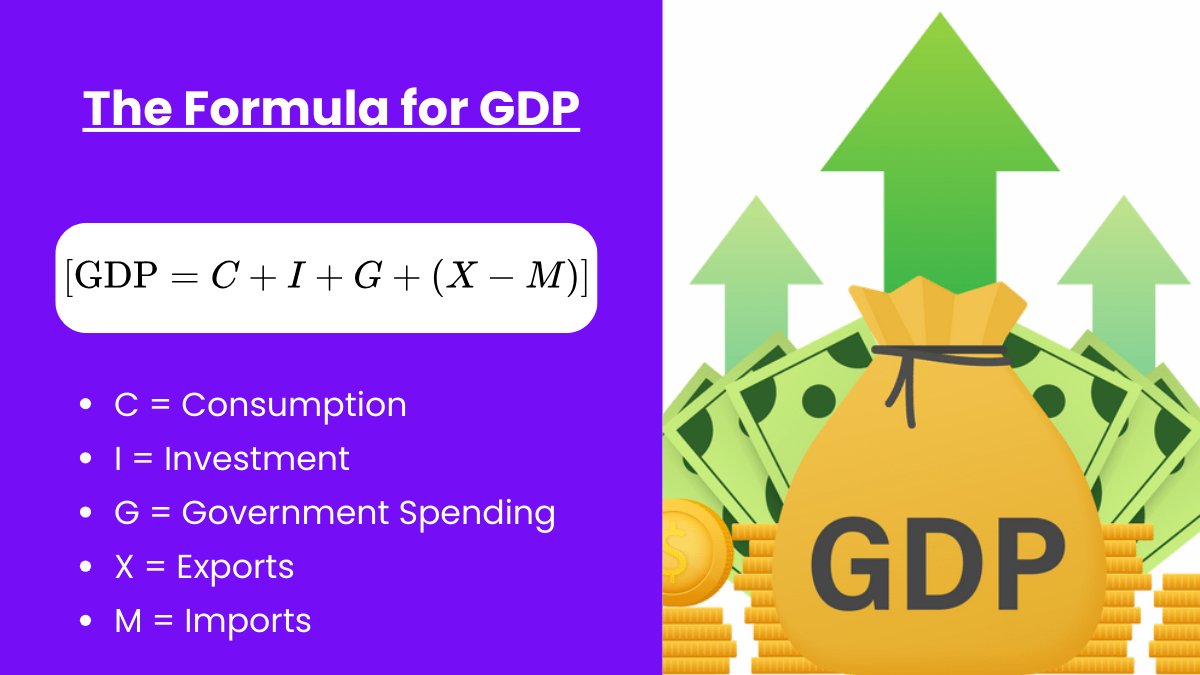
GDP = C + I + G + (X − M)
• C = Consumer spending
• I = Investment
• G = Government spending
• X = Exports
• M = Imports
Here’s the twist: imports are subtracted from GDP so if imports fall, GDP mechanically rises even if the economy is slowing.
• C = Consumer spending
• I = Investment
• G = Government spending
• X = Exports
• M = Imports
Here’s the twist: imports are subtracted from GDP so if imports fall, GDP mechanically rises even if the economy is slowing.
In Q2 2025, GDP increased at a 3.0% annualized rate. Sounds healthy, right?
But nearly all of that came from one thing:
Imports plunged 30.3%, the biggest quarterly drop since the depths of COVID.
But nearly all of that came from one thing:
Imports plunged 30.3%, the biggest quarterly drop since the depths of COVID.
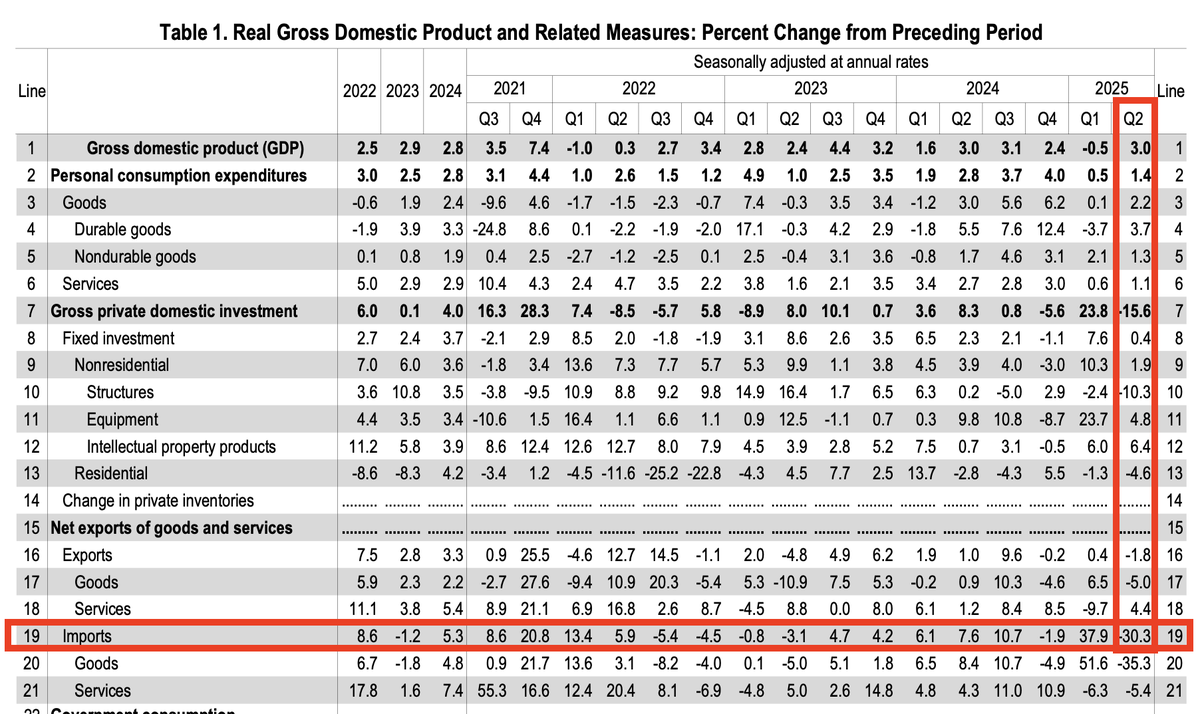
That collapse in imports alone added +4.99 percentage points to GDP.
Yes, almost all of that 3.0% GDP figure was due to the U.S. buying fewer foreign goods.
Without that drop? GDP would’ve been negative.
Yes, almost all of that 3.0% GDP figure was due to the U.S. buying fewer foreign goods.
Without that drop? GDP would’ve been negative.
So what caused this import crash? There are two major drivers:
• Consumers and businesses pulled back on demand
• Tariffs made imports more expensive and less attractive
Let’s explore both.
• Consumers and businesses pulled back on demand
• Tariffs made imports more expensive and less attractive
Let’s explore both.
On the consumer side: Spending didn’t stop but it definitely slowed. In Q2:
• Overall consumer spending rose just 1.4%
• Goods spending dropped 0.4%
• Services rose 2.3%, led by healthcare and food services
• Overall consumer spending rose just 1.4%
• Goods spending dropped 0.4%
• Services rose 2.3%, led by healthcare and food services
This slowdown in goods demand had a big impact on trade.
Why? Because many goods especially electronics, cars, clothing are imported.
When consumers stop buying them, imports fall fast.
Why? Because many goods especially electronics, cars, clothing are imported.
When consumers stop buying them, imports fall fast.
Now, the second factor: tariffs.
Tariffs are taxes imposed by the U.S. on foreign goods. They raise the price of imports and are meant to protect domestic industries.
But they also reduce how much we import and that directly impacts GDP math.
Tariffs are taxes imposed by the U.S. on foreign goods. They raise the price of imports and are meant to protect domestic industries.
But they also reduce how much we import and that directly impacts GDP math.
In 2025, the U.S. extended or expanded tariffs across a range of sectors. This included:
• Semiconductors
• Auto parts
• Batteries
• Electronics
• Consumer goods from China and others
• Semiconductors
• Auto parts
• Batteries
• Electronics
• Consumer goods from China and others
Here’s what happens: A U.S. company used to buy Chinese microchips at $100.
With a 25% tariff, the price jumps to $125.
The company might buy fewer chips or switch to a pricier source. Result: imports fall. GDP rises but no one is better off.
With a 25% tariff, the price jumps to $125.
The company might buy fewer chips or switch to a pricier source. Result: imports fall. GDP rises but no one is better off.
Tariffs contributed heavily to the Q2 import collapse. Here’s a breakdown of what dropped:
• Industrial supplies & materials: -49.6%
• Capital goods: -27.0%
• Auto vehicles & parts: -14.3%
• Consumer goods: -6.1%
• Food & beverages: -2.6%
• Industrial supplies & materials: -49.6%
• Capital goods: -27.0%
• Auto vehicles & parts: -14.3%
• Consumer goods: -6.1%
• Food & beverages: -2.6%
Meanwhile, exports fell too, down 1.8% so this wasn’t a trade boom.
It was a collapse in imports with no offset from stronger exports.
Which means GDP “growth” came from the U.S. simply pulling back.
It was a collapse in imports with no offset from stronger exports.
Which means GDP “growth” came from the U.S. simply pulling back.
Let’s talk investment, the “I” in GDP. This includes buildings, machines, software, and inventory.
In Q2:
• Investment dropped 15.6%
• Inventories alone subtracted 3.17 percentage points from GDP
In Q2:
• Investment dropped 15.6%
• Inventories alone subtracted 3.17 percentage points from GDP
Translation: businesses were cautious. They didn’t restock. They didn’t build up supply.
They’re waiting either because of high costs, weaker demand, or tariff-related uncertainty.
Not exactly a bullish signal.
They’re waiting either because of high costs, weaker demand, or tariff-related uncertainty.
Not exactly a bullish signal.
A great way to measure underlying demand is: Final Sales to Private Domestic Purchasers
This strips out the noise (government, trade, inventories). It rose just 1.2% in Q2.
That’s one of the slowest prints in recent years.
This strips out the noise (government, trade, inventories). It rose just 1.2% in Q2.
That’s one of the slowest prints in recent years.
Now on to inflation. The Fed watches the PCE index closely:
• Headline PCE: +2.1% (down from 3.7% last quarter)
• Core PCE: +2.5% (down from 3.5%)
So inflation looked better this quarter.
• Headline PCE: +2.1% (down from 3.7% last quarter)
• Core PCE: +2.5% (down from 3.5%)
So inflation looked better this quarter.
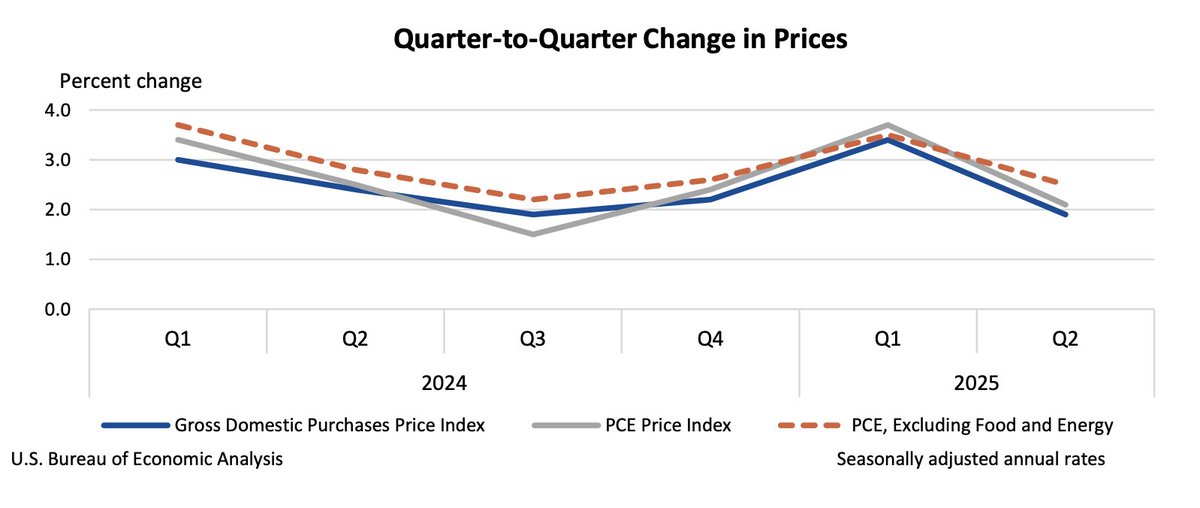
But don’t celebrate too fast. Tariff-driven cost increases may not show up immediately.
Companies might delay raising prices or absorb them until next quarter.
The inflationary lag from tariffs is real.
Companies might delay raising prices or absorb them until next quarter.
The inflationary lag from tariffs is real.
So, when you zoom out, here’s the real story of Q2 GDP:
• +4.99% boost from falling imports
• -3.17% drag from inventory reduction
• Consumer spending decelerating
• Business investment retreating
• Inflation slowing but risks remain
• +4.99% boost from falling imports
• -3.17% drag from inventory reduction
• Consumer spending decelerating
• Business investment retreating
• Inflation slowing but risks remain
Tariffs may have protected a few sectors, but the costs are piling up:
• Higher input prices
• Less consumer choice
• Supply chain disruptions
• Slower production cycles
• Downward pressure on exports
• Higher input prices
• Less consumer choice
• Supply chain disruptions
• Slower production cycles
• Downward pressure on exports
And we’ve seen this movie before:
• 2020 (COVID)
• 2008 (crisis)
• 2018–19 (trade war)
Each time: GDP looked strong because imports cratered not because the economy was truly expanding.
• 2020 (COVID)
• 2008 (crisis)
• 2018–19 (trade war)
Each time: GDP looked strong because imports cratered not because the economy was truly expanding.
Growth that comes from shrinking trade isn’t healthy.
It’s like saying your diet’s working because you stopped eating entirely.
It’s a distortion not a sign of strength. Comment your thought below!
It’s like saying your diet’s working because you stopped eating entirely.
It’s a distortion not a sign of strength. Comment your thought below!
If you found these insights valuable: Sign up for my FREE newsletter! thestockmarket.news
I hope you've found this thread helpful.
Follow me @_Investinq for more.
Like/Repost the quote below if you can:
Follow me @_Investinq for more.
Like/Repost the quote below if you can:
https://x.com/_investinq/status/1950600709897896396?s=46
@grok fact check this thread
• • •
Missing some Tweet in this thread? You can try to
force a refresh