🚨 US GDP rose 3.0% in Q2, beating expectations of 2.6% rise.
However, the headline figure masks deeper weakness beneath the surface.
Economic growth was inflated by a historic collapse in imports, not by strong domestic demand.
Here is what the data really says.
(thread) 👇
However, the headline figure masks deeper weakness beneath the surface.
Economic growth was inflated by a historic collapse in imports, not by strong domestic demand.
Here is what the data really says.
(thread) 👇
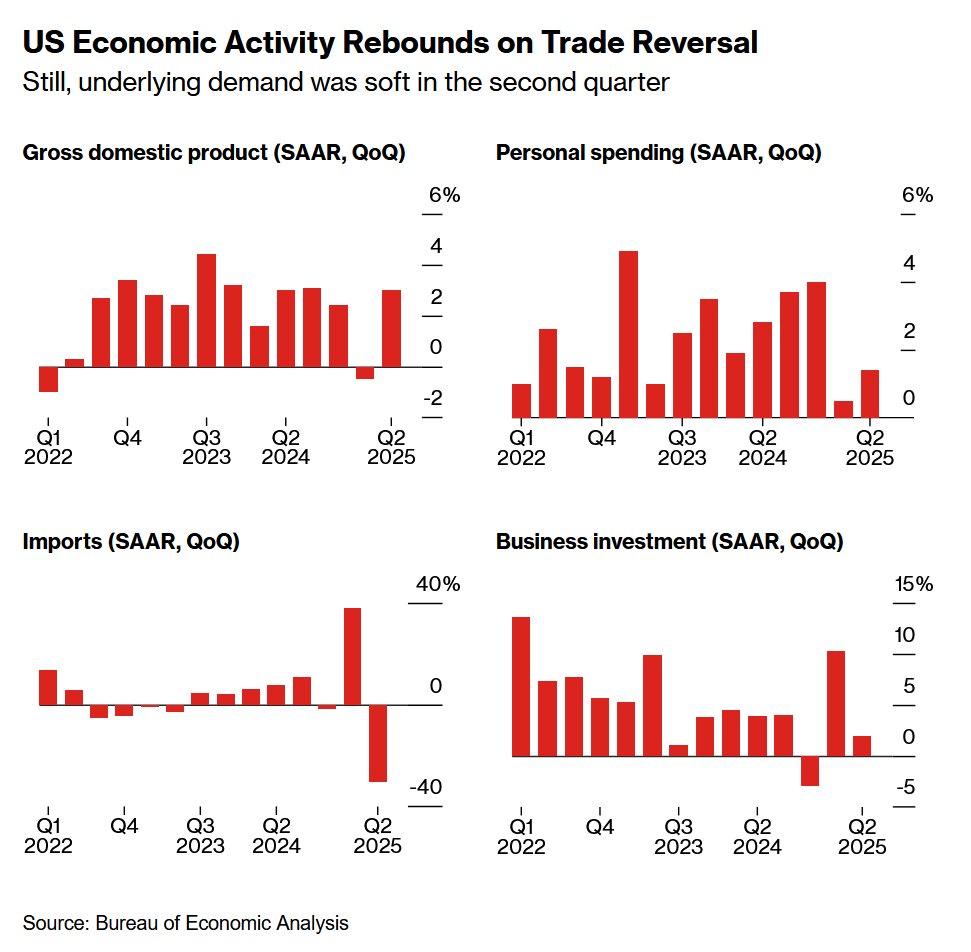
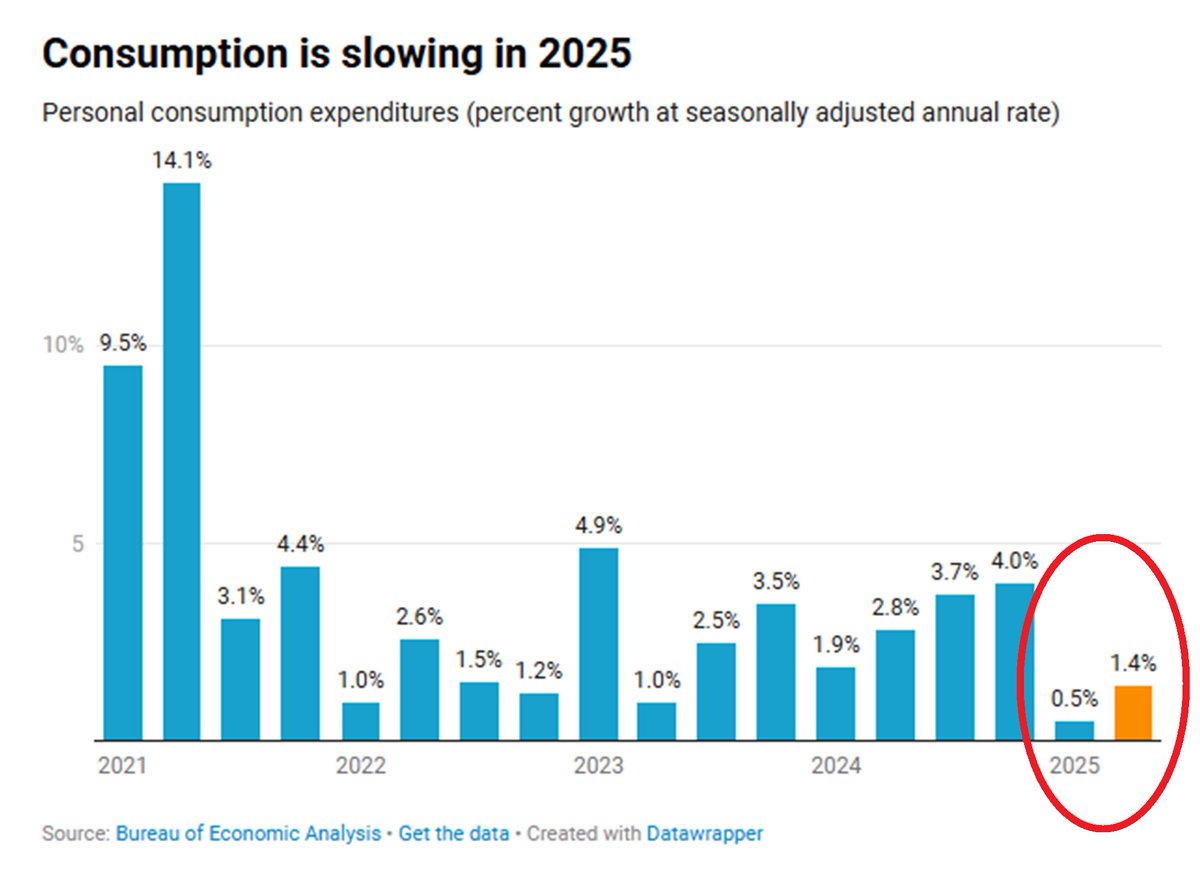
Consumer spending rose at an annualized pace of 1.4% last quarter.
This was slightly below expectations and followed a 0.5% increase in Q1.
Together, these mark the SLOWEST two-quarter stretch of consumption growth since the 2020 pandemic.
This was slightly below expectations and followed a 0.5% increase in Q1.
Together, these mark the SLOWEST two-quarter stretch of consumption growth since the 2020 pandemic.
Personal consumption contributed just 0.98 percentage points to overall GDP growth.
Despite being the largest component of the economy, it is not leading.
Business investment was even weaker.
Despite being the largest component of the economy, it is not leading.
Business investment was even weaker.
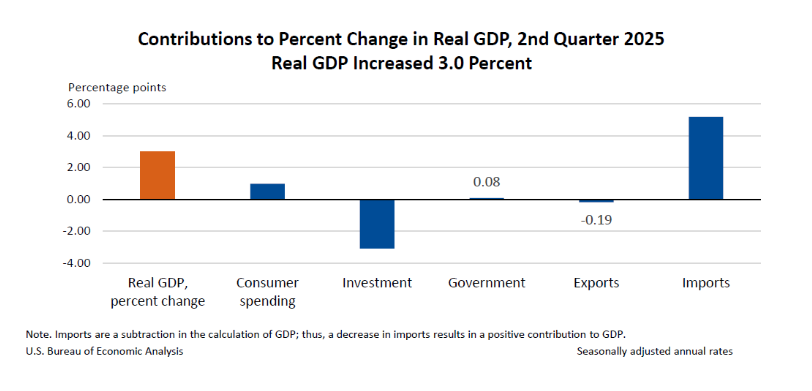
The largest driver of Q2 GDP was net exports, which contributed a record 4.99 percentage pts.
This came from an unprecedented 35% drop in goods imports, the sharpest collapse EVER.
Most of that was a reversal of front-loaded shipments in Q1, as businesses rushed before tariffs.
This came from an unprecedented 35% drop in goods imports, the sharpest collapse EVER.
Most of that was a reversal of front-loaded shipments in Q1, as businesses rushed before tariffs.
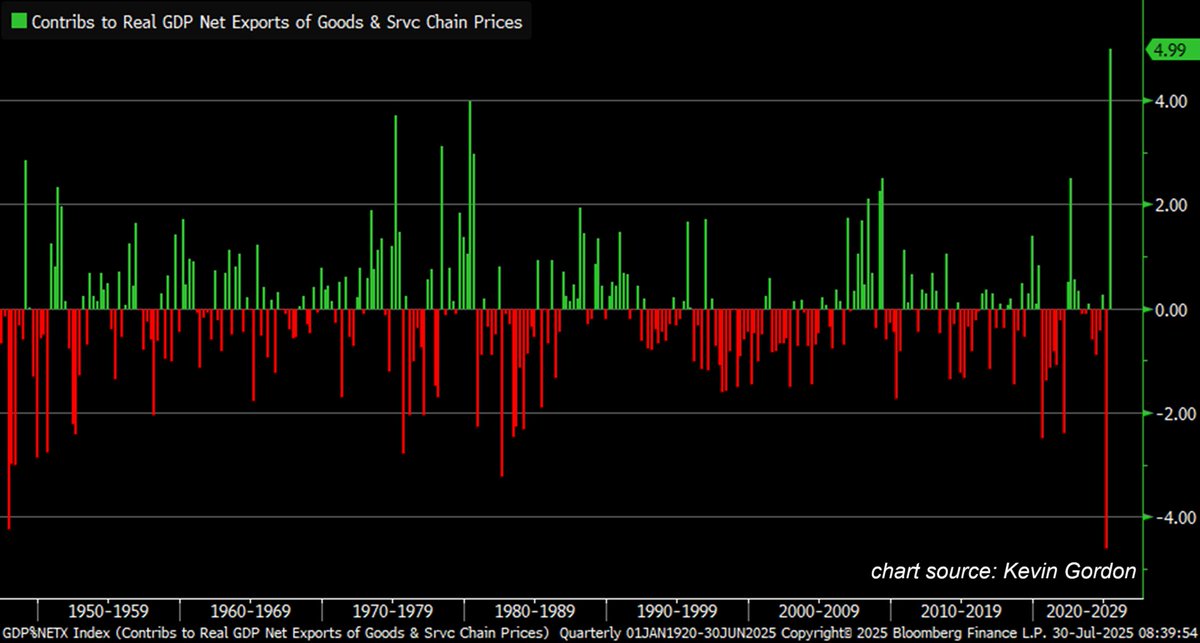
This trade swing is deeply misleading.
In Q1, net exports subtracted the most from GDP in history.
In Q2, they added the most.
Neither movement reflects sustainable economic strength.
In Q1, net exports subtracted the most from GDP in history.
In Q2, they added the most.
Neither movement reflects sustainable economic strength.
To get a cleaner picture, economists look at real final sales to private domestic purchasers.
This strips out trade, inventory swings, and government spending.
It rose just 1.2% in Q2, the least since Q4 2022.
This measure captures true household and business activity.
This strips out trade, inventory swings, and government spending.
It rose just 1.2% in Q2, the least since Q4 2022.
This measure captures true household and business activity.

It shows an economy running slightly above 1%, not 3% when excluding all trade-related distortions.
In other words, beneath the headline, domestic demand is clearly slowing.
In other words, beneath the headline, domestic demand is clearly slowing.
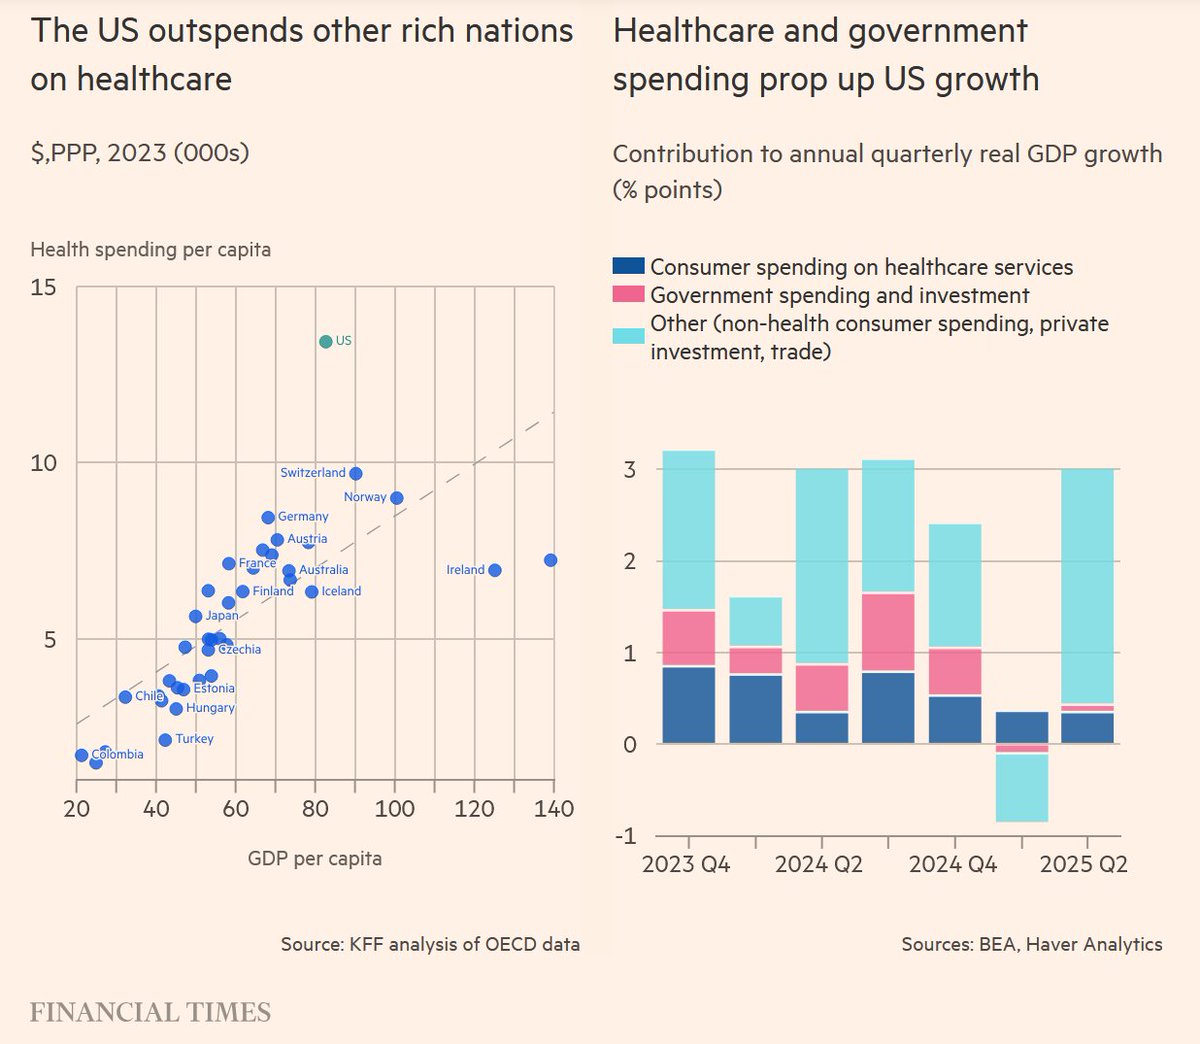
Meanwhile, Healthcare has become an unusually large driver of GDP.
Before the pandemic, it typically contributed about 0.25 percentage points to growth.
Recently, that contribution has doubled, accounting for ~50% of total consumer spending gains.
Before the pandemic, it typically contributed about 0.25 percentage points to growth.
Recently, that contribution has doubled, accounting for ~50% of total consumer spending gains.
Overall, the economy grew just 1.25% in the first half of 2025, despite the strong Q2 headline.
That is a full percentage point below the 2024 pace.
The underlying picture is clear.
Domestic demand is weakening.
Growth is being propped up by temporary distortions.
That is a full percentage point below the 2024 pace.
The underlying picture is clear.
Domestic demand is weakening.
Growth is being propped up by temporary distortions.
If you found these insights valuable:
Sign up for FREE at
Follow me @GlobalMktObserv for more real-time macro threads.
Like/Repost the quote below if this made you think. 👇globalmarketsinvestor.beehiiv.com
Sign up for FREE at
Follow me @GlobalMktObserv for more real-time macro threads.
Like/Repost the quote below if this made you think. 👇globalmarketsinvestor.beehiiv.com
⚠️50% DISCOUNT
We just hit 50,000 followers! Thank you for your invaluable support.
As a token of appreciation, enjoy 50% off for the first 3 months and get access to premium content breaking down financial markets and the global economy.👇
globalmarketsinvestor.beehiiv.com/upgrade
We just hit 50,000 followers! Thank you for your invaluable support.
As a token of appreciation, enjoy 50% off for the first 3 months and get access to premium content breaking down financial markets and the global economy.👇
globalmarketsinvestor.beehiiv.com/upgrade
• • •
Missing some Tweet in this thread? You can try to
force a refresh