Guy Berger Profile picture
Jul 31, 2025 5 tweets 2 min read Read on X
Claims:

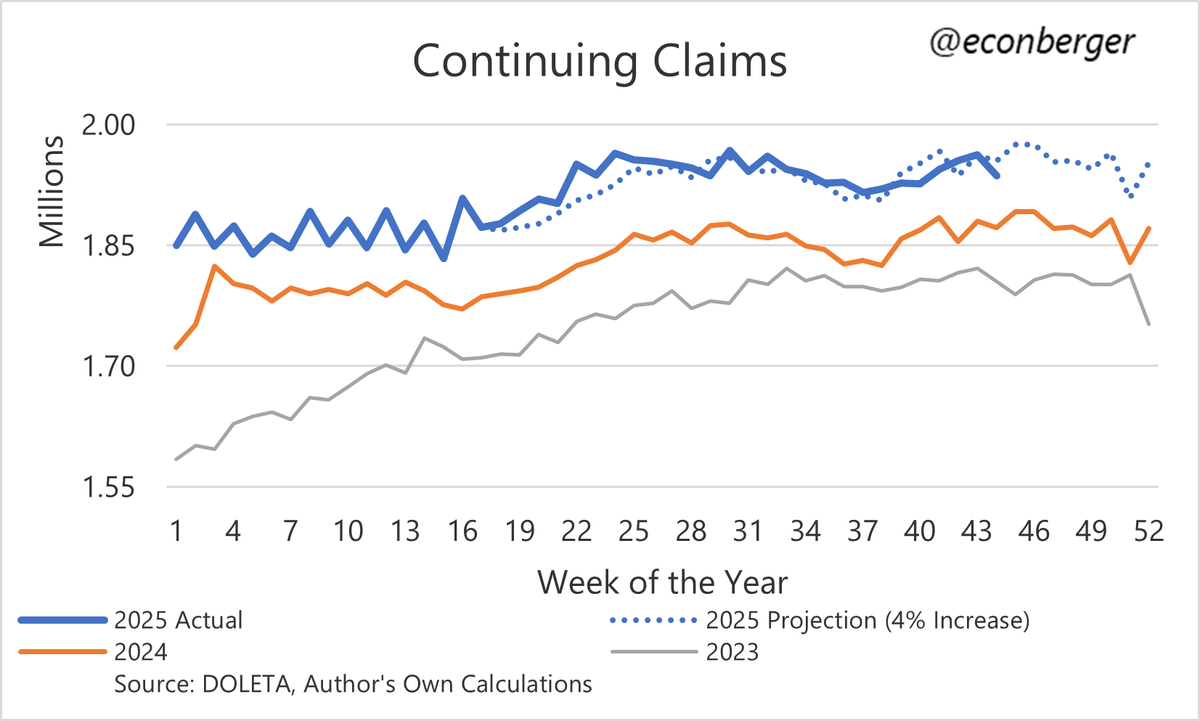
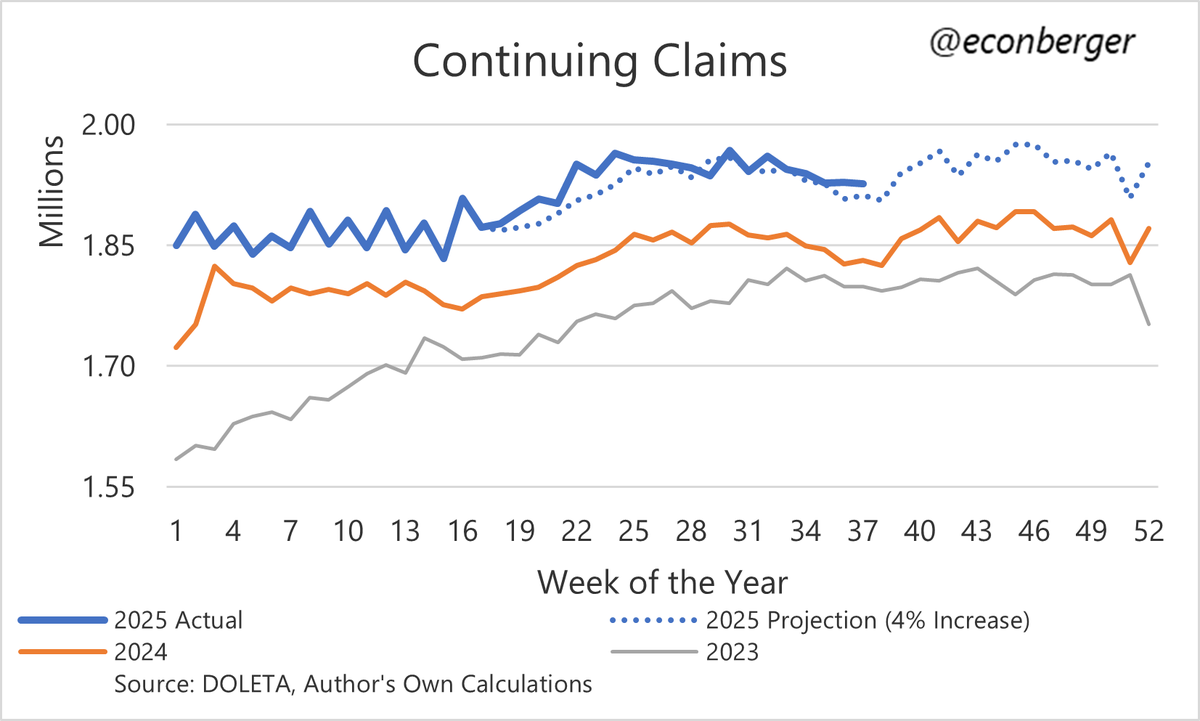
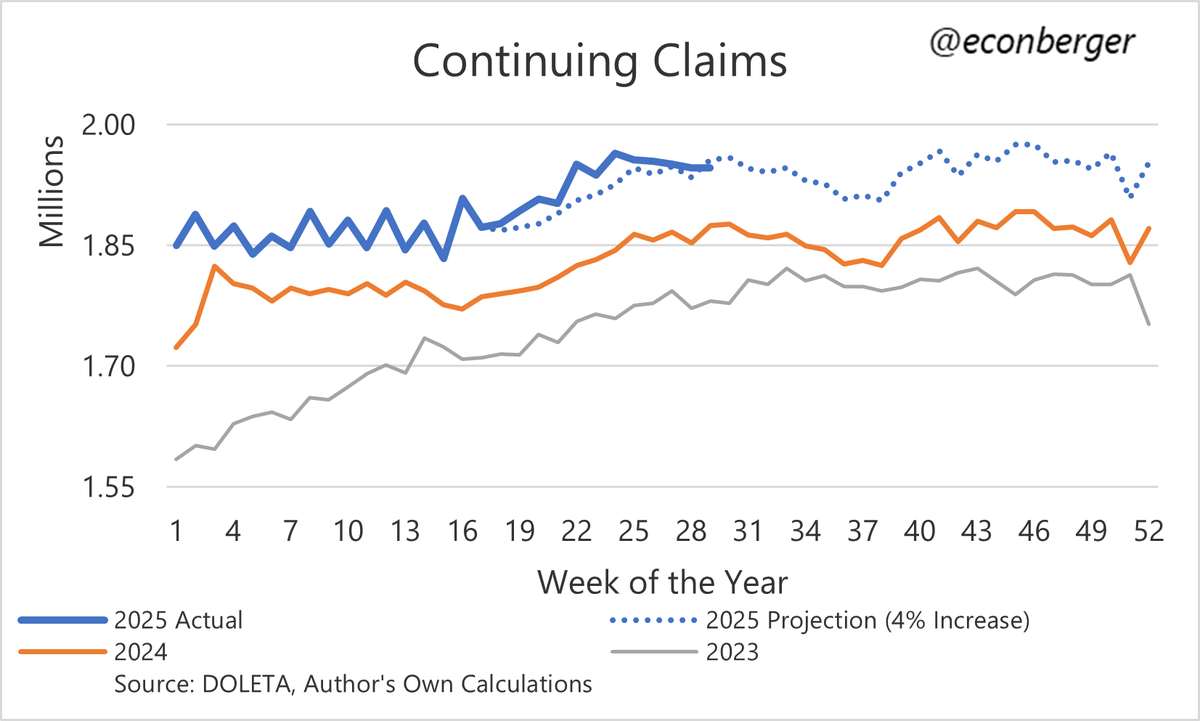
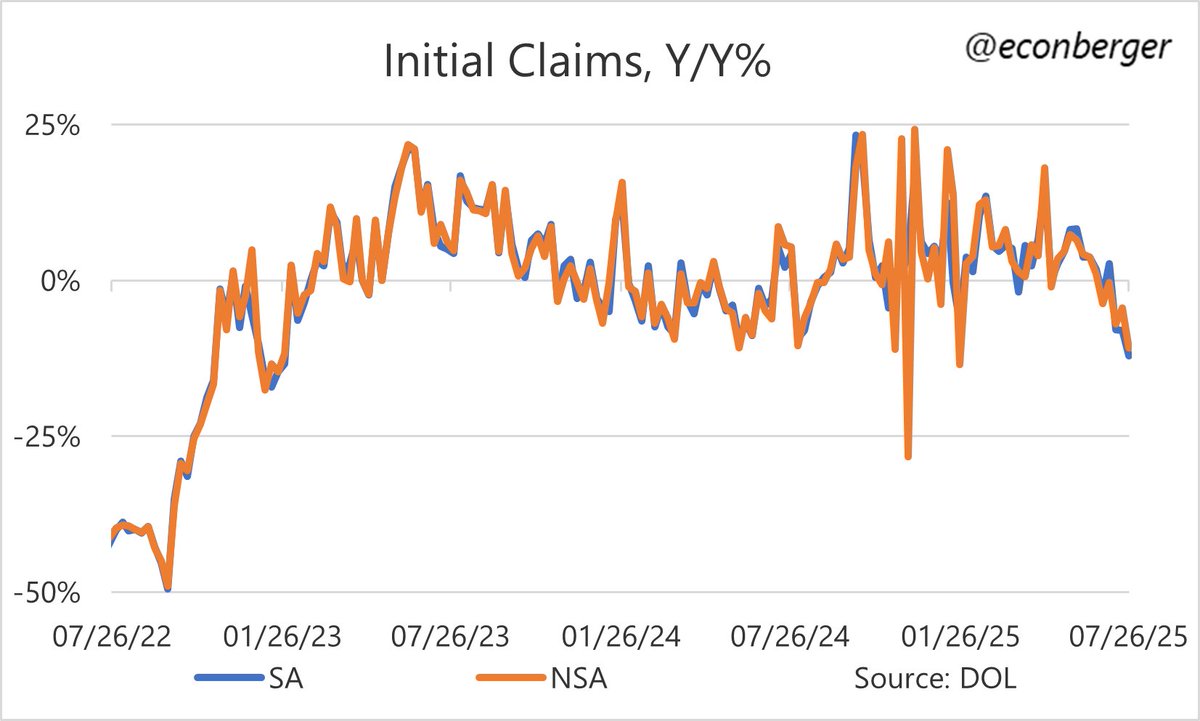
1/ Good news. The continuing claims scare of May/June faded further... continuing claims fell below my benchmark (which assumes a ~4% Y/Y increase).

They're likely to be (misleadingly) flattish for the remainder of the year, due to residual seasonality. Image
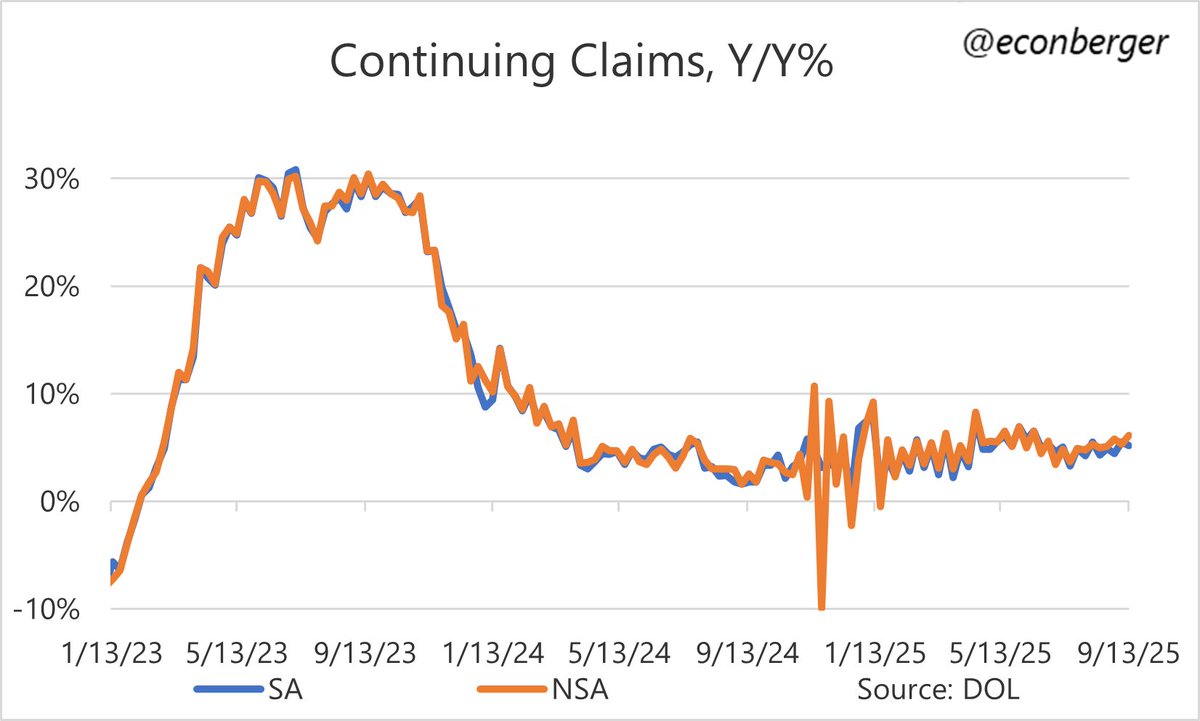
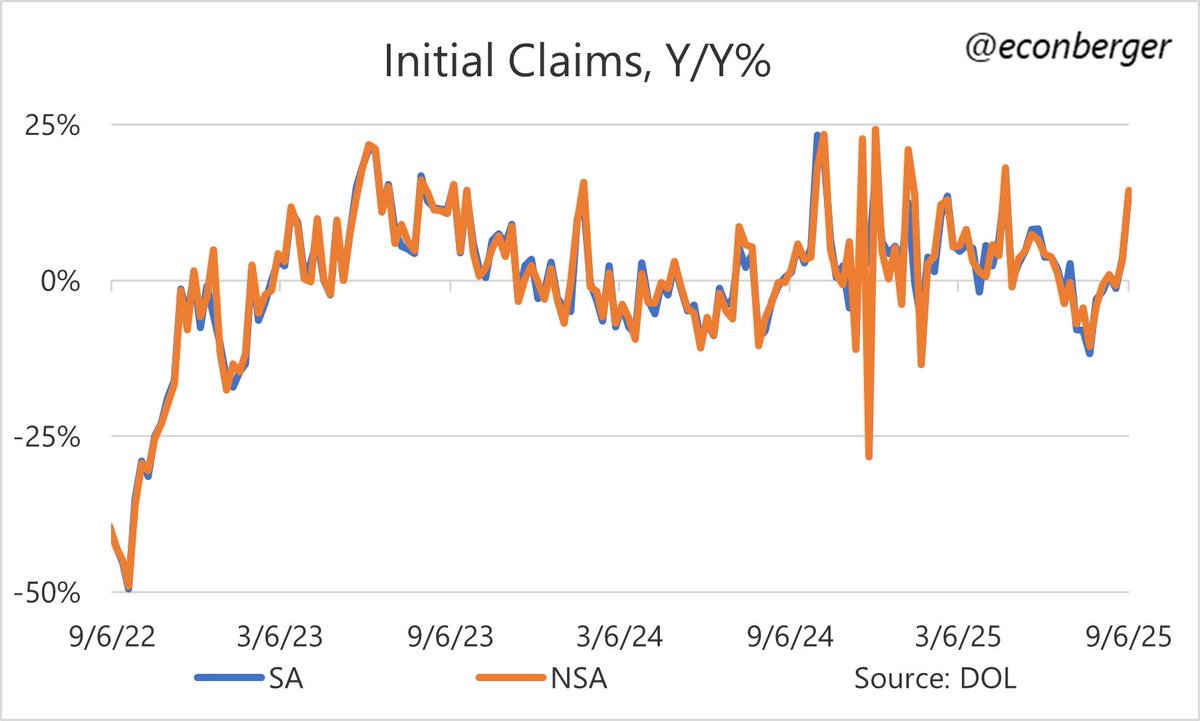
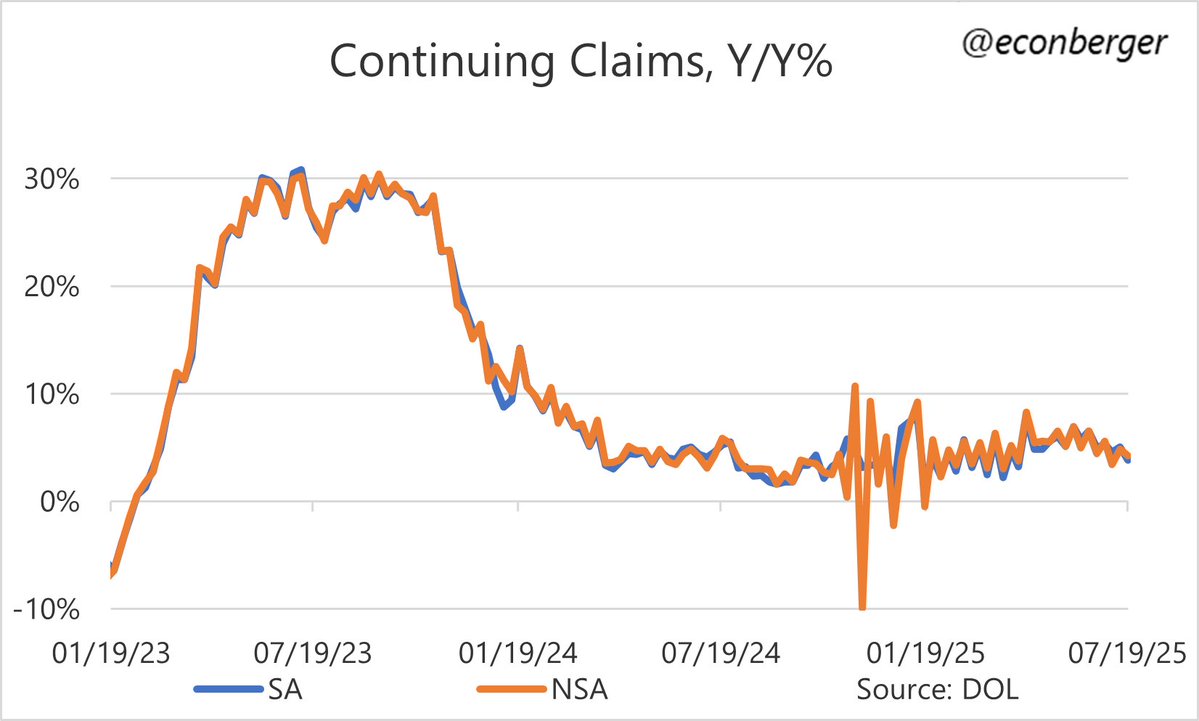
2/ Another way of seeing this: continuing claims were up about 4% Y/Y - comparable to before the scare.

That's still not *great*, reflecting a very mild ongoing deterioration. But that's not what got us worried two months ago. Image
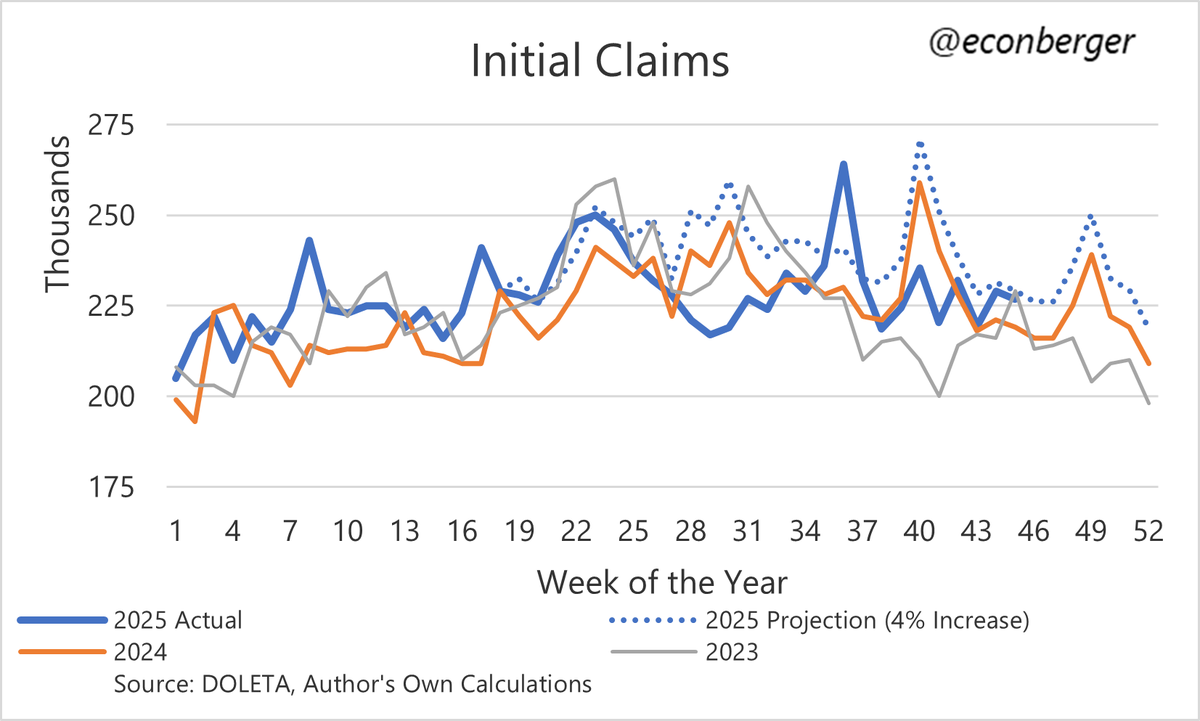
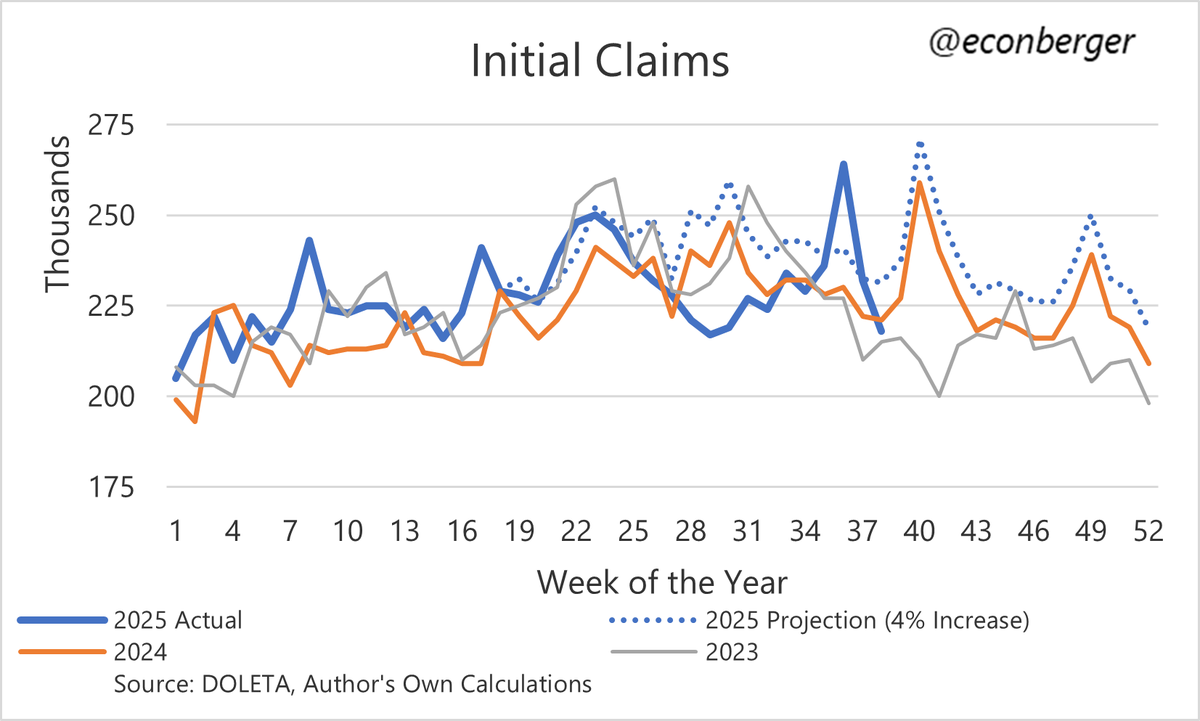
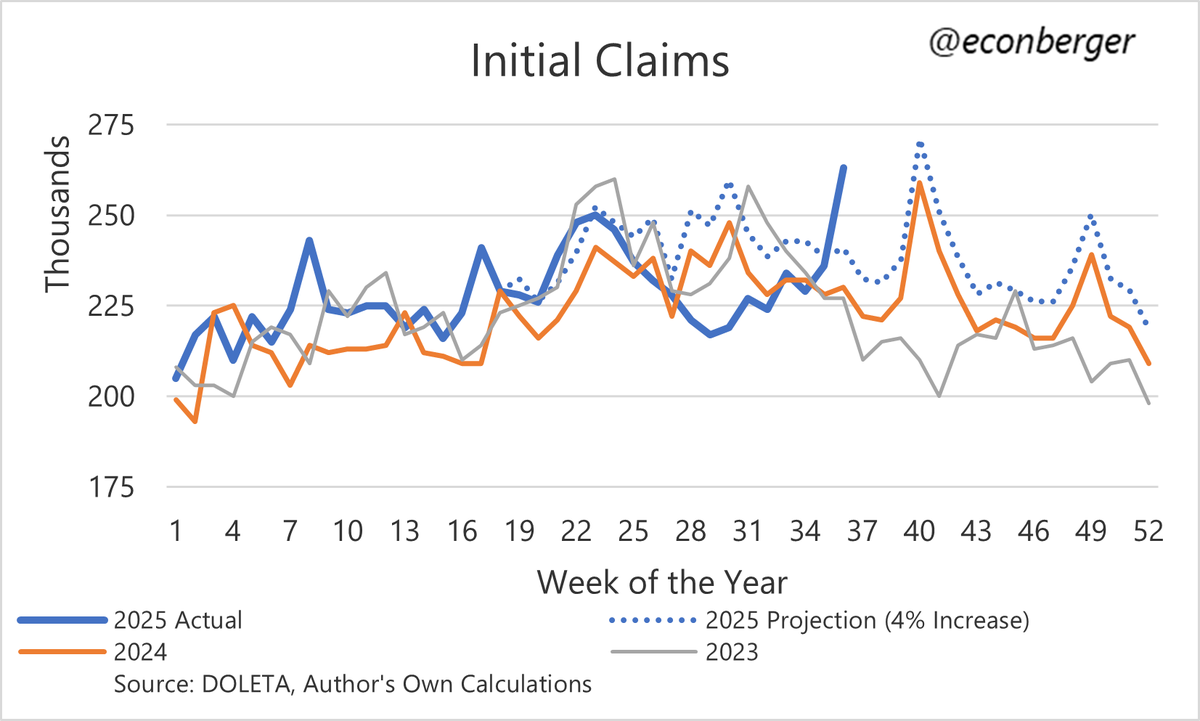
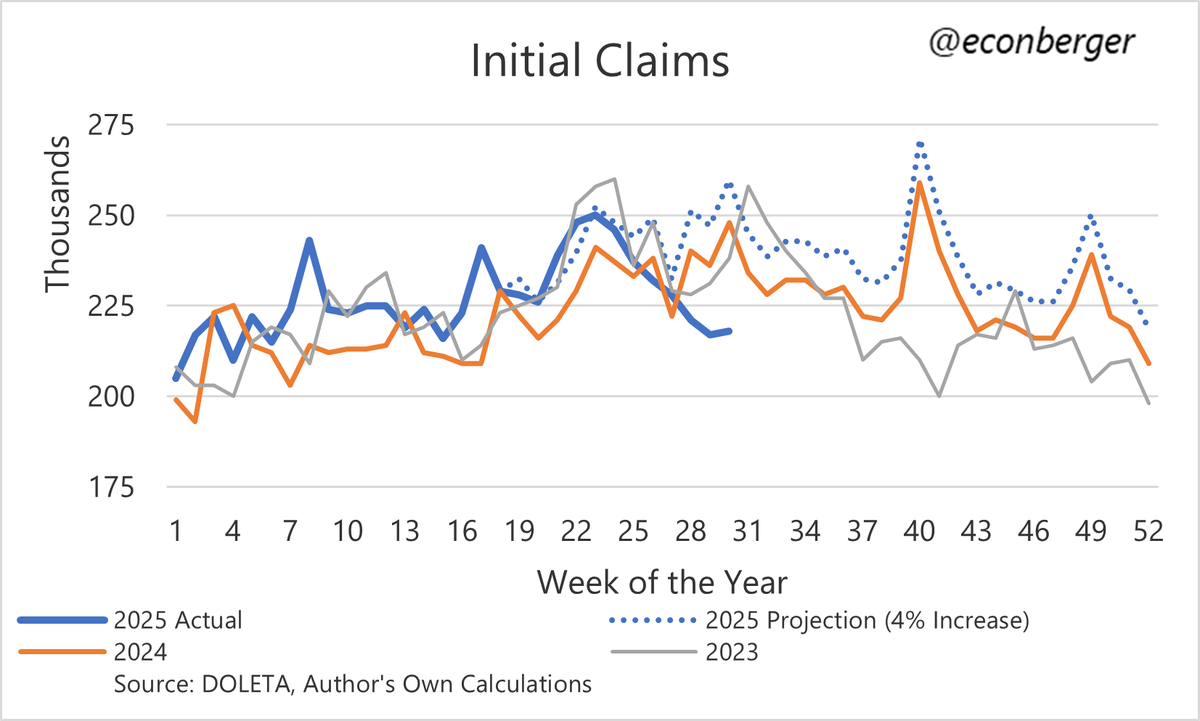
3/ Initial claims continue to run not only below my benchmark, but below the last two years.

Layoffs appear to be coming down; we'll see if other data sources confirm this development in a few weeks. Image
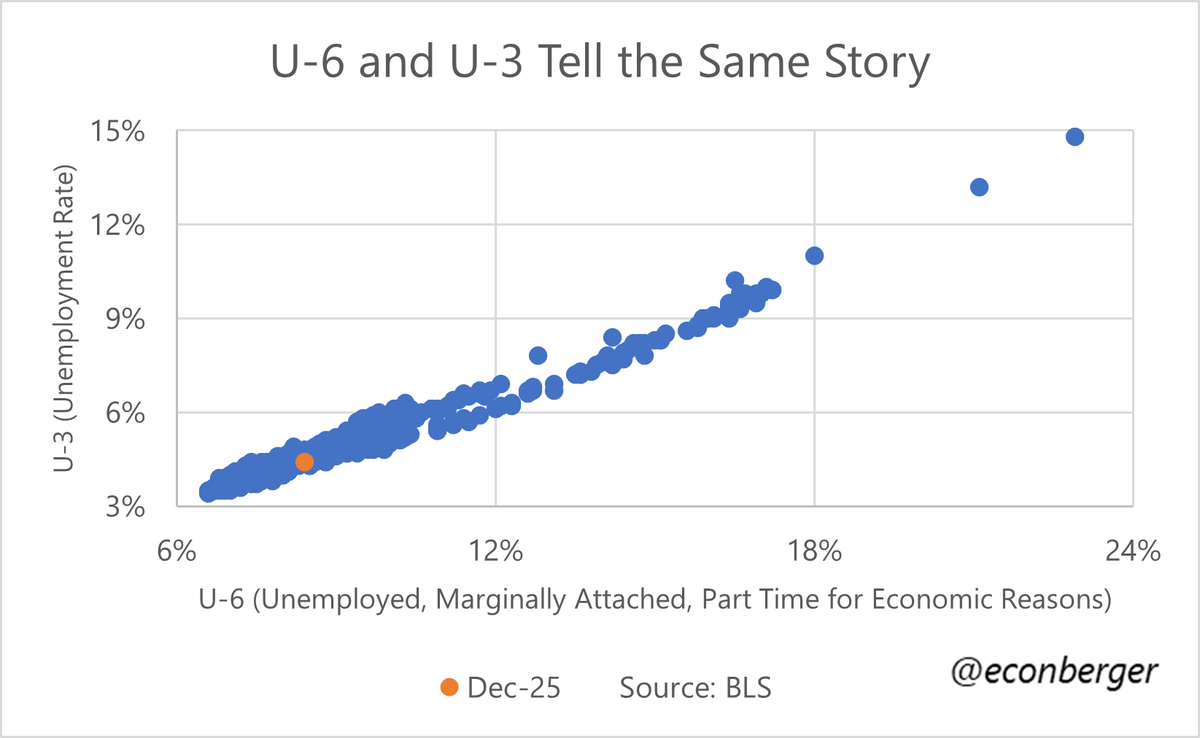
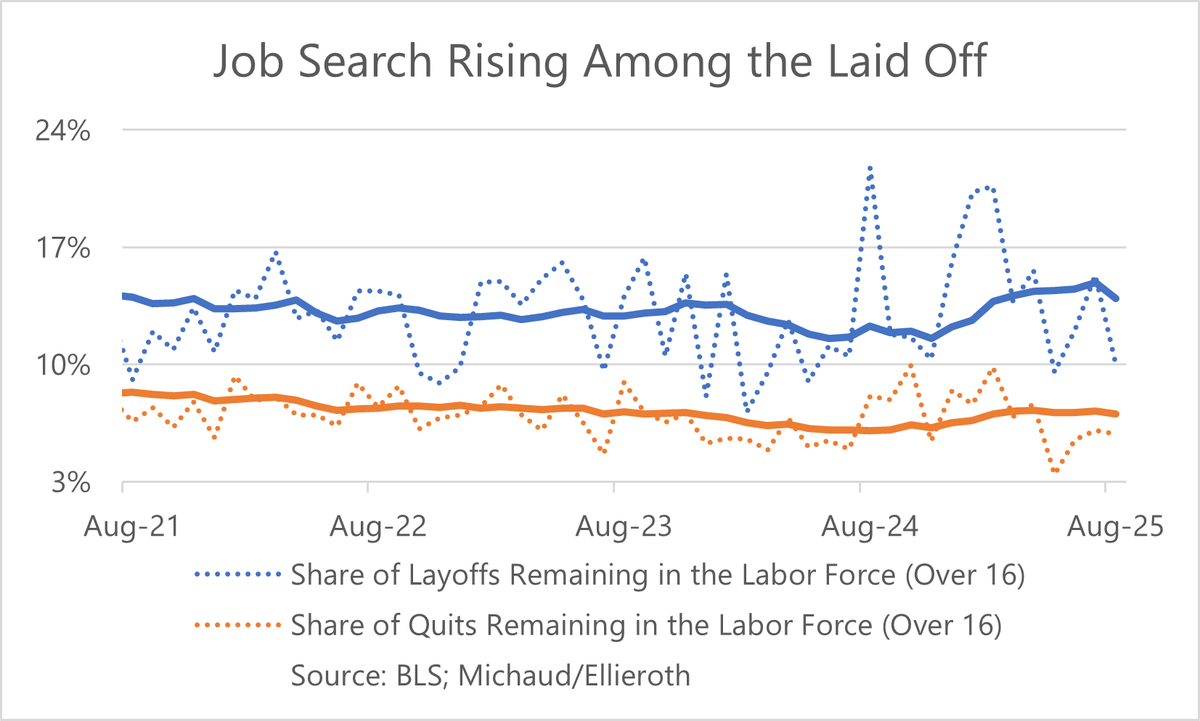
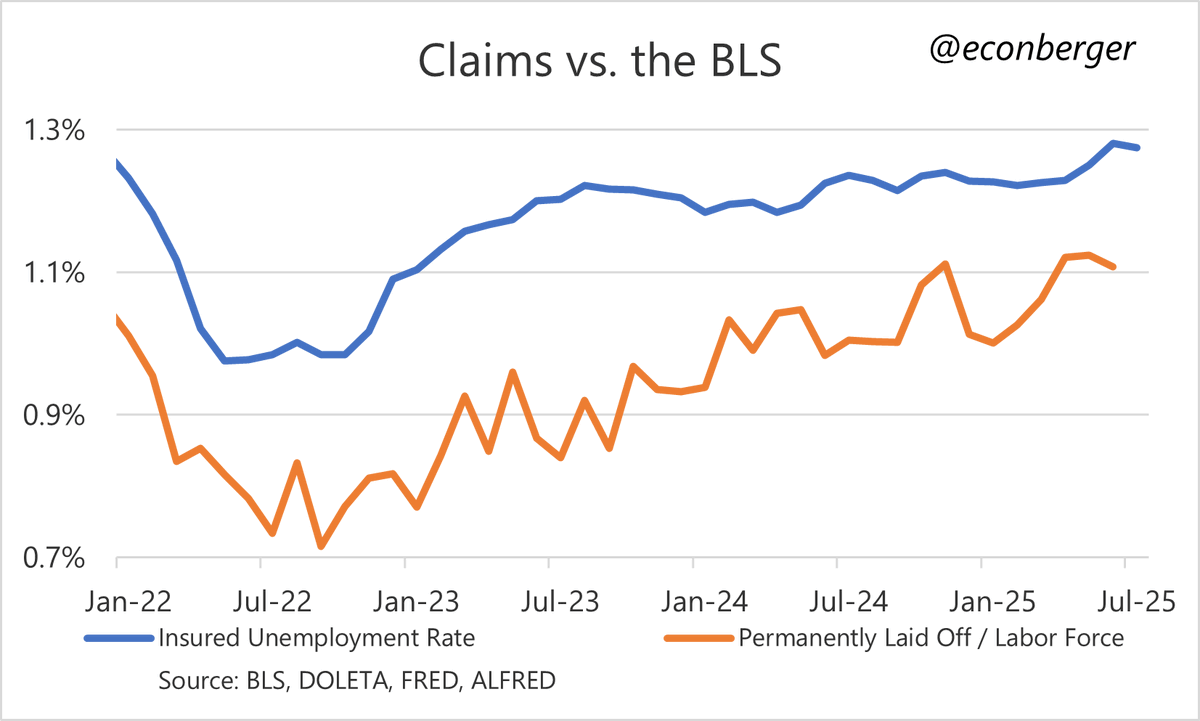
4/ This is really something Image
5/ This is the nowcast for unemployment due to permanent layoff, which whiffed last month. Image

• • •

Missing some Tweet in this thread? You can try to force a refresh
 

Keep Current with Guy Berger

Guy Berger Profile picture

Stay in touch and get notified when new unrolls are available from this author!

Read all threads

This Thread may be Removed Anytime!

PDF

Twitter may remove this content at anytime! Save it as PDF for later use!

Try unrolling a thread yourself!

how to unroll video
  1. Follow @ThreadReaderApp to mention us!

  2. From a Twitter thread mention us with a keyword "unroll"
@threadreaderapp unroll

Practice here first or read more on our help page!

More from @EconBerger

Jan 12
U-6 vs the Unemployment Rate, a thread:

1/ On Friday, I saw several folks lean on an expanded measure of underemployment (U-6) to argue that the jobs report was "worse than it looked".

I'd characterize this as "true, but not in the business cycle sense".

More downthread. Image
2/ Some definitions first.

U-3 is the standard unemployment rate. It defines unemployed as "doesn't have a job, but is actively looking in the past month" (or temporarily furloughed and expect to be recalled to work)
3/ This isn't the only way to think about labor market distress. Some ways are narrower, others are wider. You can find them in table A-15 of the monthly jobs report.

The broadest is U-6, which includes 2 groups that are not "unemployed" but also measure arguable distress...
Read 8 tweets
Nov 13, 2025
The final "scrapped together" claims data before the DOL begins publishing weekly reports again...

1/ Regular initial claims were "well-behaved" again in the week ended 11/08, no sign of a layoff surge, just modestly above year-ago levels (and nearly identical to 2 years ago) Image
2/ Maybe something bad is around the corner but it hasn't happened yet.

Next week's IC data will be the last to include part of the shutdown period. Image
3/ Nothing troubling in regular continuing claims either (week ended 11/01). Modestly above year-ago levels, consistent with the same very slow ongoing deterioration of the past >2 years. Image
Read 7 tweets
Sep 25, 2025
Claims:

1/ Continuing claims running about 15K above my benchmark.

There's residual seasonality in the published series that paints an overly rosy picture of what is going on with this data... Image
2/ There's been a mild reacceleration in the CC data recently. We'll see if it goes anywhere; the May/June mild acceleration petered out. Image
3/ After a few weeks of being elevated, initial claims are back below my benchmark.

Speaking of the benchmark, it's going to misfire in the next month or two due to the devastating hurricanes we had last year (Helene, Milton). Image
Read 7 tweets
Sep 18, 2025
1/ I've been curious how to reconcile the relatively upbeat "flows" from the CPS (hiring & quits rising modestly; layoffs falling modestly) with the downbeat stocks (esp upward-creeping unemployment rate)
2/ Out of the @mander_michaud / @KathrinPhD data, we see that job search after layoff has gone up non-trivially over the past year, but job search after quits has increased by less.

Still digesting, but my instinct is to think this is (on net) a positive development? Image
@mander_michaud @KathrinPhD 3/ And if you look at hiring out of non-employment, most of the recent fluctuation (including the small recent) is due to hiring from non-employment. Image
Read 6 tweets
Sep 18, 2025
Some surprisingly upbeat news out of the CPS flows data for August (even as the CPS "stock" data was downbeat)...

1/ Hiring out of non-employment has stopped falling in recent months. May even be rising a little. Image
2/ We also have, courtesy of @mander_michaud and @KathrinPhD , measures of quits & layoffs into non-employment.

Neither of these are getting worse at present. As with hiring, may actually be improving! Image
@mander_michaud @KathrinPhD 3/ Michaud & Ellieroth also calculate this for prime working age Americans, and it's a similar picture (albeit less slightly less upbeat). Image
Read 5 tweets
Sep 11, 2025
Claims:

1/ An extremely concerning jump in initial claims to 263K (highest since the fall of 2021). This data includes Labor Day weekend, so maybe it's holiday noise, but I'm worried. Image
2/ It's well above last year's level. Image
I deleted this tweet because I misread a news story about an extension of benefit deadlines in Texas pertaining to the July floods.

Not obvious this would have affected this week's data.
(Texas initial claims really did jump by a lot.) kcentv.com/article/news/s…Image
Read 8 tweets

Did Thread Reader help you today?

Support us! We are indie developers!


This site is made by just two indie developers on a laptop doing marketing, support and development! Read more about the story.

Become a Premium Member ($3/month or $30/year) and get exclusive features!

Become Premium

Don't want to be a Premium member but still want to support us?

Make a small donation by buying us coffee ($5) or help with server cost ($10)

Donate via Paypal

Or Donate anonymously using crypto!

Ethereum

0xfe58350B80634f60Fa6Dc149a72b4DFbc17D341E copy

Bitcoin

3ATGMxNzCUFzxpMCHL5sWSt4DVtS8UqXpi copy

Thank you for your support!

Follow Us!

:(