🚨 Inflation’s back but not like before.
Prices are up, savings are down, and consumers are squeezed.
Here’s what the PCE report really says about the economy.
(Save this thread)
Prices are up, savings are down, and consumers are squeezed.
Here’s what the PCE report really says about the economy.
(Save this thread)

Let’s start with what the PCE Price Index actually is.
The Personal Consumption Expenditures (PCE) Index measures how much Americans are actually spending on goods and services adjusting for changes in behavior.
It’s the Federal Reserve’s preferred inflation gauge.
The Personal Consumption Expenditures (PCE) Index measures how much Americans are actually spending on goods and services adjusting for changes in behavior.
It’s the Federal Reserve’s preferred inflation gauge.
Why does it matter more than CPI?
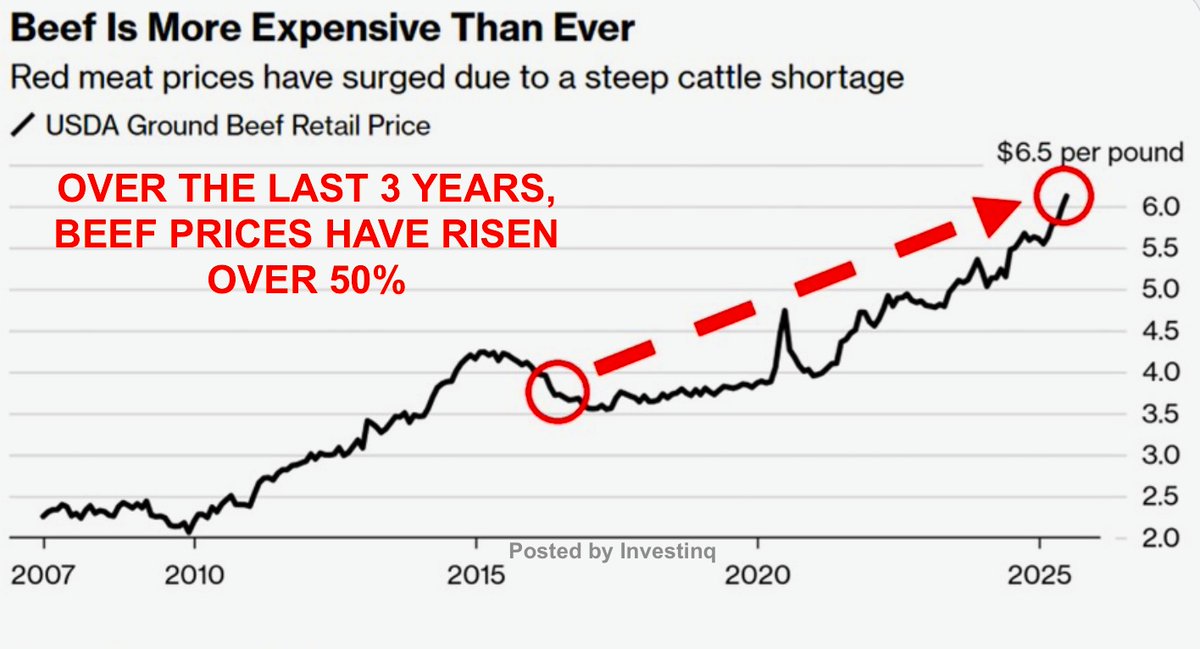
While CPI (Consumer Price Index) just tracks sticker prices, PCE adjusts for substitutions like if beef gets expensive and you switch to chicken.
So it paints a better picture of what people are really paying.
While CPI (Consumer Price Index) just tracks sticker prices, PCE adjusts for substitutions like if beef gets expensive and you switch to chicken.
So it paints a better picture of what people are really paying.
There are two flavors of PCE:
→ Headline PCE: includes everything (food, gas, rent, etc.)
→ Core PCE: excludes food and energy, which are volatile, giving a better view of long-term inflation trends.
Core is what the Fed watches most.
→ Headline PCE: includes everything (food, gas, rent, etc.)
→ Core PCE: excludes food and energy, which are volatile, giving a better view of long-term inflation trends.
Core is what the Fed watches most.
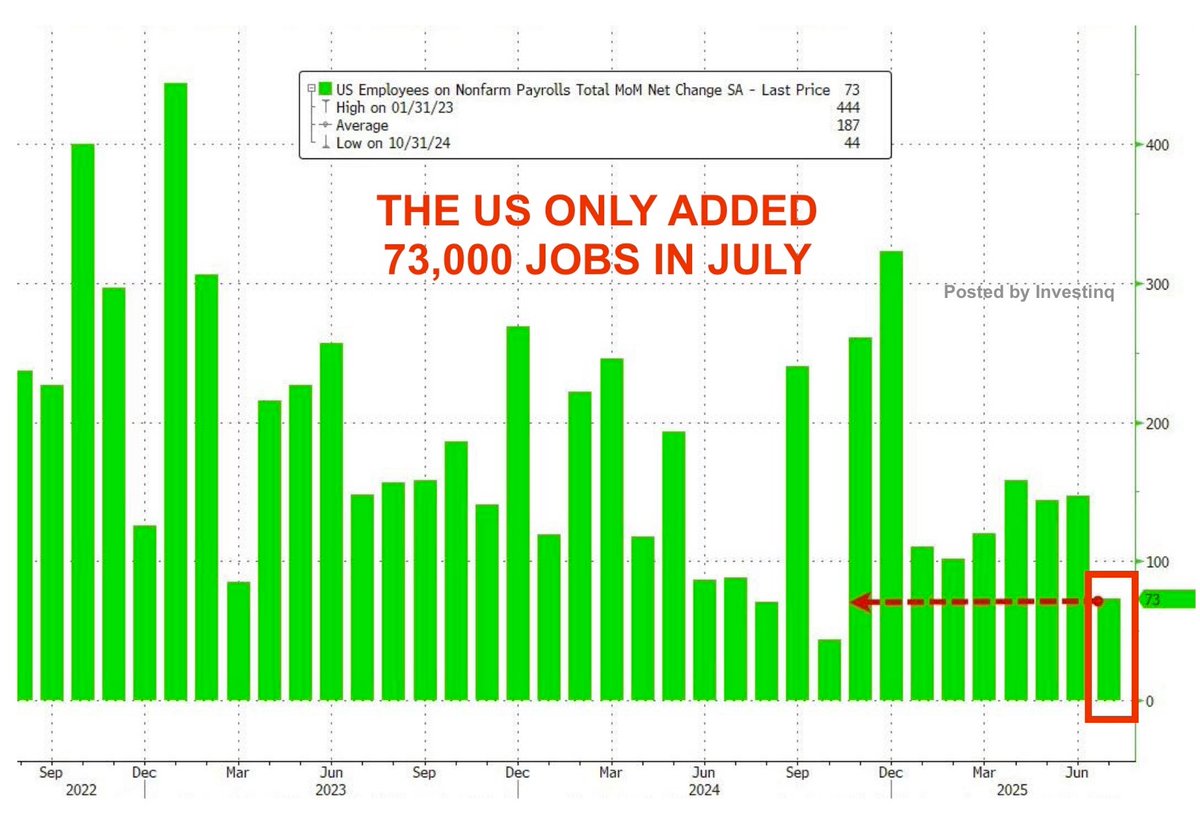
In June, Core PCE rose 0.3% MoM and 2.8% YoY.
That’s hotter than expected (2.7%) and matches the highest level since February.
This suggests inflation isn't cooling the way the Fed had hoped.
That’s hotter than expected (2.7%) and matches the highest level since February.
This suggests inflation isn't cooling the way the Fed had hoped.

Headline PCE also came in warm:
→ +0.3% month-over-month
→ +2.6% year-over-year
So inflation is heating up at the top level and the core level across both essentials and discretionary items.
→ +0.3% month-over-month
→ +2.6% year-over-year
So inflation is heating up at the top level and the core level across both essentials and discretionary items.
Where’s the inflation pressure coming from? It’s not evenly spread.
According to the data, just four categories accounted for most of the rise in spending:
→ Housing & utilities: +$16.3B
→ Healthcare: +$17.5B
→ Energy goods: +$11.5B
→ Financial services: +$9.4B
According to the data, just four categories accounted for most of the rise in spending:
→ Housing & utilities: +$16.3B
→ Healthcare: +$17.5B
→ Energy goods: +$11.5B
→ Financial services: +$9.4B

Meanwhile, many categories declined:
→ Motor vehicles: -$6.1B
→ Recreation services: -$4.9B
→ Nonprofit services: -$3.9B
→ Transportation: -$2.8B
→ Food services: down slightly
This wasn’t consumers going on a spending spree, it was price pressure in non-negotiables.
→ Motor vehicles: -$6.1B
→ Recreation services: -$4.9B
→ Nonprofit services: -$3.9B
→ Transportation: -$2.8B
→ Food services: down slightly
This wasn’t consumers going on a spending spree, it was price pressure in non-negotiables.
So what’s happening?
People aren’t buying more, they’re being forced to spend more on basics like shelter, electricity, insurance, and healthcare.
This is what economists call inelastic demand, you can’t easily skip a hospital bill or stop paying rent.
People aren’t buying more, they’re being forced to spend more on basics like shelter, electricity, insurance, and healthcare.
This is what economists call inelastic demand, you can’t easily skip a hospital bill or stop paying rent.
And here’s where things get more troubling: Goods inflation is back.
For much of the past year, services drove price pressure but in June, durable goods prices jumped 0.5% MoM, the biggest increase in nearly two years.
Why? One word: tariffs.
For much of the past year, services drove price pressure but in June, durable goods prices jumped 0.5% MoM, the biggest increase in nearly two years.
Why? One word: tariffs.

The latest tariff hikes from the Trump administration’s 2025 trade policy are starting to ripple through import prices.
When tariffs raise the cost of Chinese batteries, equipment, or materials, companies either eat the cost or pass it to you.
Guess which they picked.
When tariffs raise the cost of Chinese batteries, equipment, or materials, companies either eat the cost or pass it to you.
Guess which they picked.
That’s why we’re now seeing cost-push inflation when prices rise not because of higher demand, but because it costs more to supply the same goods.
Durables like appliances, electronics, and furniture are now more expensive even though people are buying less.
Durables like appliances, electronics, and furniture are now more expensive even though people are buying less.
So what did Americans actually spend on?
→ Durables: spending fell, yet prices rose = cost pressure
→ Non-durables: slight increase (food, fuel, household items)
→ Services: modest growth, concentrated in healthcare and finance
This is a classic squeeze: fewer goods, higher bills.
→ Durables: spending fell, yet prices rose = cost pressure
→ Non-durables: slight increase (food, fuel, household items)
→ Services: modest growth, concentrated in healthcare and finance
This is a classic squeeze: fewer goods, higher bills.
Let’s zoom in on healthcare, one of the biggest inflation drivers this month.
→ Healthcare consumption jumped by $17.5B in June alone
→ That’s over 20% of total monthly PCE growth
It’s a structural cost, one families can’t skip and the Fed can’t control.
→ Healthcare consumption jumped by $17.5B in June alone
→ That’s over 20% of total monthly PCE growth
It’s a structural cost, one families can’t skip and the Fed can’t control.

Now let’s talk wages and income.
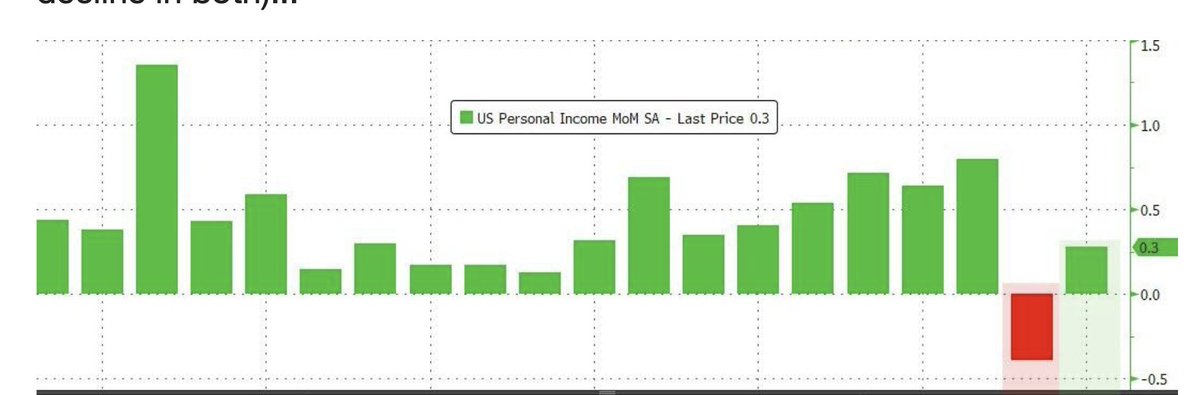
→ Personal income rose 0.3% MoM
→ Disposable income (after taxes) rose 0.3%
→ But real disposable income (after inflation) was flat
That means your paycheck is rising but so is the price of everything else.
→ Personal income rose 0.3% MoM
→ Disposable income (after taxes) rose 0.3%
→ But real disposable income (after inflation) was flat
That means your paycheck is rising but so is the price of everything else.
Wages by employer type:
→ Private sector: +4.7% YoY
→ Government sector: +5.5% YoY
Solid nominal gains but again, the inflation offset means real wage growth is weak. The illusion of income growth doesn’t help when costs eat it up.
→ Private sector: +4.7% YoY
→ Government sector: +5.5% YoY
Solid nominal gains but again, the inflation offset means real wage growth is weak. The illusion of income growth doesn’t help when costs eat it up.
Consumers are reacting accordingly.
→ Nominal spending rose 0.3%
→ But real spending (adjusted for inflation) rose just 0.1%
That’s weak especially for June, which usually sees a summer boost from travel, weddings, and vacations.
→ Nominal spending rose 0.3%
→ But real spending (adjusted for inflation) rose just 0.1%
That’s weak especially for June, which usually sees a summer boost from travel, weddings, and vacations.

And what’s happening with savings?
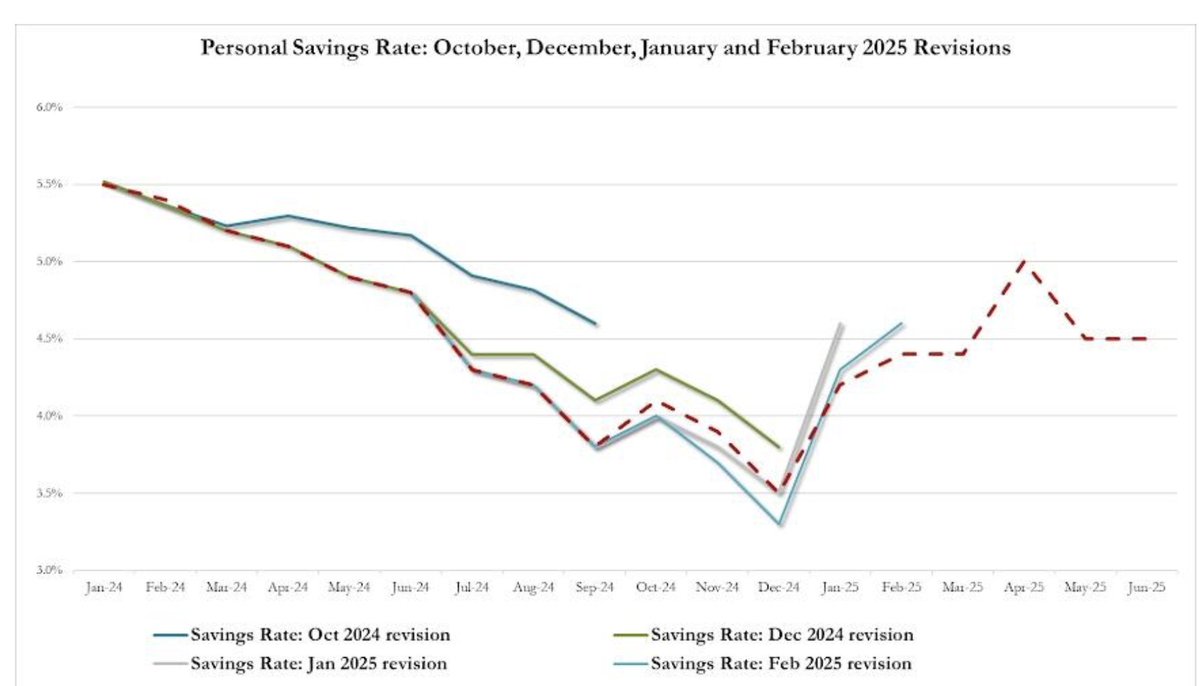
→ Personal savings rate held at 4.5%
→ Total savings fell by $8.5 billion
Households are keeping up appearances but by draining their cash reserves. And we’re now near post-pandemic lows for savings.
→ Personal savings rate held at 4.5%
→ Total savings fell by $8.5 billion
Households are keeping up appearances but by draining their cash reserves. And we’re now near post-pandemic lows for savings.
For comparison:
→ Pre-pandemic savings rate: ~8–9%
→ Current: 4.5%
In other words, Americans are saving half as much as they used to, just to stay afloat.
→ Pre-pandemic savings rate: ~8–9%
→ Current: 4.5%
In other words, Americans are saving half as much as they used to, just to stay afloat.
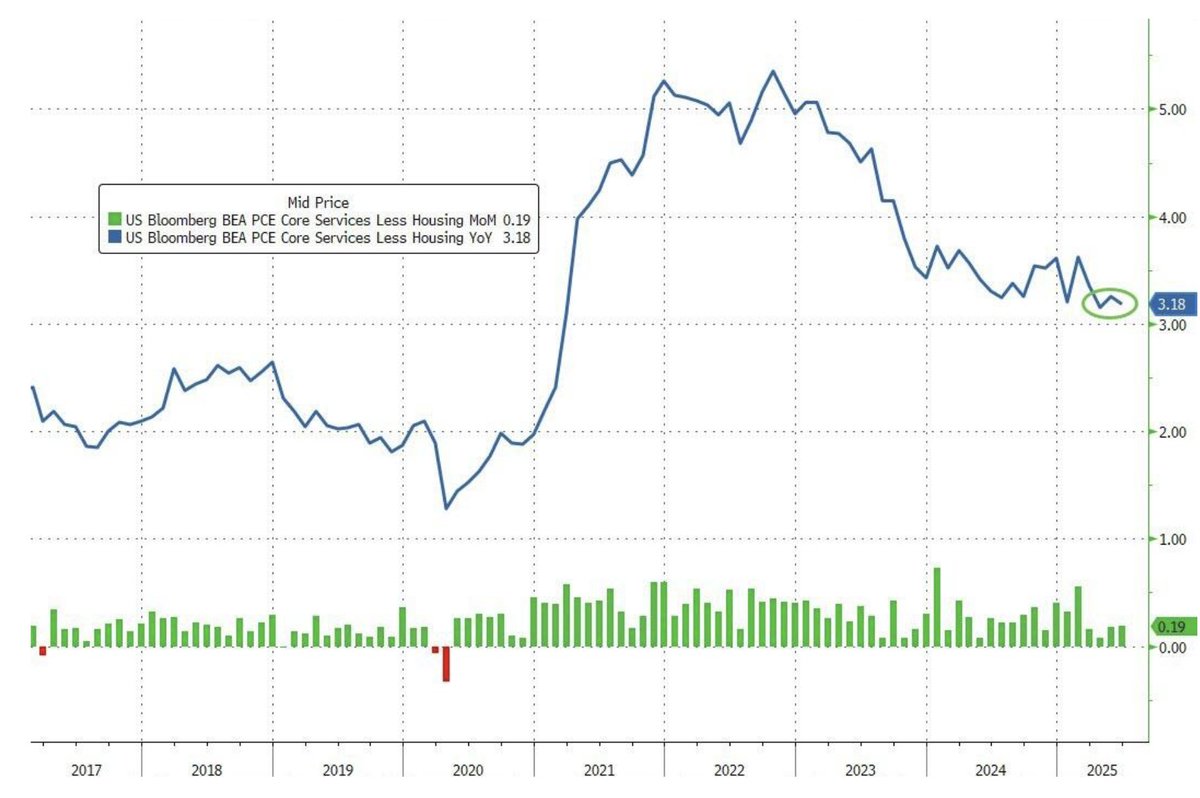
Let’s talk about one bright spot: supercore inflation. This is a sub-index that excludes housing and energy from services, the most “sticky” part of inflation.
→ In June, supercore slowed to +3.18% YoY, its lowest in over two years.
That’s encouraging, but not enough to sway the Fed alone.
→ In June, supercore slowed to +3.18% YoY, its lowest in over two years.
That’s encouraging, but not enough to sway the Fed alone.
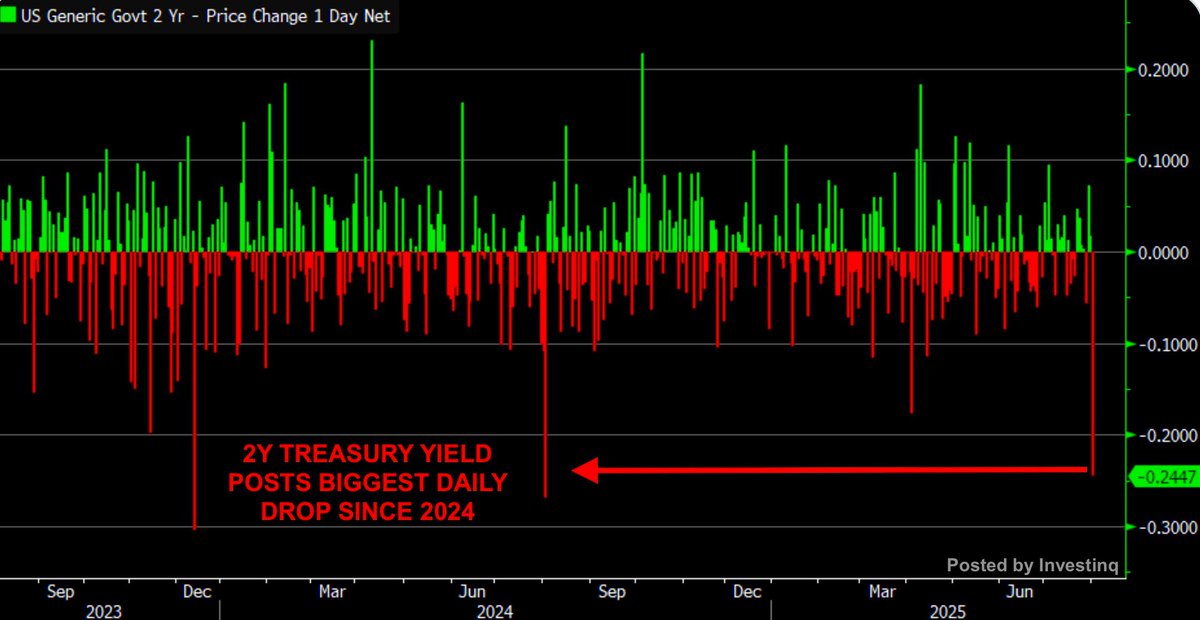
So where does this leave the Fed? At the July meeting, policymakers held rates steady again for the fifth time in a row.
But for the first time in years, two members dissented arguing for a rate cut.
It shows pressure is building.
But for the first time in years, two members dissented arguing for a rate cut.
It shows pressure is building.
Powell has been consistent:
→ The Fed won’t cut until inflation cools clearly
→ Or growth weakens meaningfully
This PCE report offers neither.
→ Inflation isn’t falling
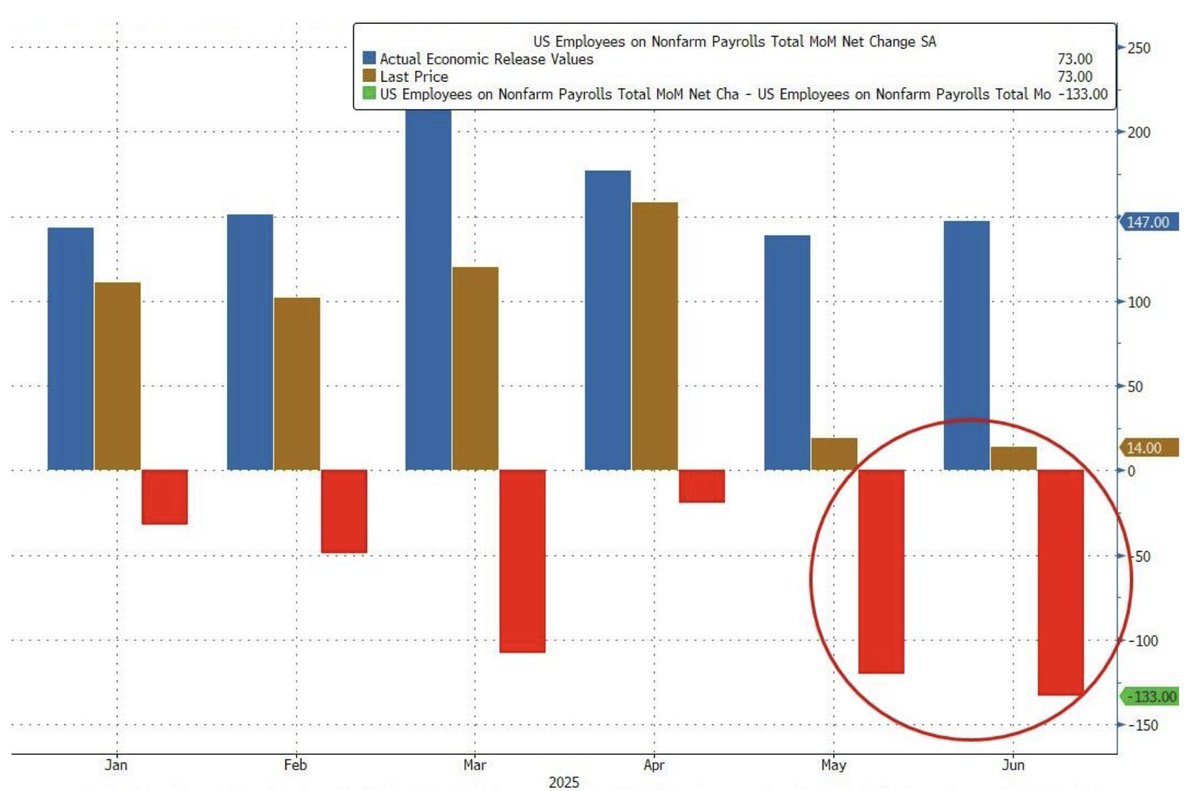
→ Growth is slowing but still positive
That means the Fed remains stuck.
→ The Fed won’t cut until inflation cools clearly
→ Or growth weakens meaningfully
This PCE report offers neither.
→ Inflation isn’t falling
→ Growth is slowing but still positive
That means the Fed remains stuck.
Cutting rates now could reignite inflation especially with tariffs adding new fuel.
Holding too long could over-tighten credit, slow investment, and burden consumers already squeezed by housing and healthcare.
It’s a policy trap.
Holding too long could over-tighten credit, slow investment, and burden consumers already squeezed by housing and healthcare.
It’s a policy trap.
Markets had priced in a September rate cut earlier this year.
Now? Expectations have shifted to November or even December, contingent on several soft inflation readings in a row.
That’s not guaranteed.
Now? Expectations have shifted to November or even December, contingent on several soft inflation readings in a row.
That’s not guaranteed.
This inflation cycle is fundamentally different from 2021–2022.
→ Then: demand-driven, stimulus-fueled, overheated economy
→ Now: supply-driven, tariff-fueled, with weak real wage growth and soft consumption
And it’s much harder to fix.
→ Then: demand-driven, stimulus-fueled, overheated economy
→ Now: supply-driven, tariff-fueled, with weak real wage growth and soft consumption
And it’s much harder to fix.
So what’s the path forward?
→ A slower, more cautious Fed
→ Households gradually weakening
→ Services costs stubbornly high
→ Tariff effects compounding each month
→ A growing risk of stagflation (high inflation + low growth)
→ A slower, more cautious Fed
→ Households gradually weakening
→ Services costs stubbornly high
→ Tariff effects compounding each month
→ A growing risk of stagflation (high inflation + low growth)
The next two months will be critical. We’re entering a high-stakes window where:
→ The Fed must decide between patience and pressure
→ Households must navigate back-to-school and energy bills
→ Politicians may start questioning the cost of tariffs
Comment your thoughts below!
→ The Fed must decide between patience and pressure
→ Households must navigate back-to-school and energy bills
→ Politicians may start questioning the cost of tariffs
Comment your thoughts below!
If you found these insights valuable: Sign up for my FREE newsletter! thestockmarket.news
I hope you've found this thread helpful.
Follow me @_Investinq for more.
Like/Repost the quote below if you can:
Follow me @_Investinq for more.
Like/Repost the quote below if you can:
https://x.com/_investinq/status/1950932282983788741?s=46
• • •
Missing some Tweet in this thread? You can try to
force a refresh