"Buy The Dip!"
A phrase you've likely heard numerous times... but have you ever bought a dip that kept on dipping?
Is there a way to identify buyable dips and dips that might not be worth taking?
Here's how I identify "buyable dips" 🧵
A phrase you've likely heard numerous times... but have you ever bought a dip that kept on dipping?
Is there a way to identify buyable dips and dips that might not be worth taking?
Here's how I identify "buyable dips" 🧵

There is quite a bit that goes into identifying buyable dips for me, and if you are new to my content (welcome) or not in Galaxy Trading, I need to break down a few key concepts first...
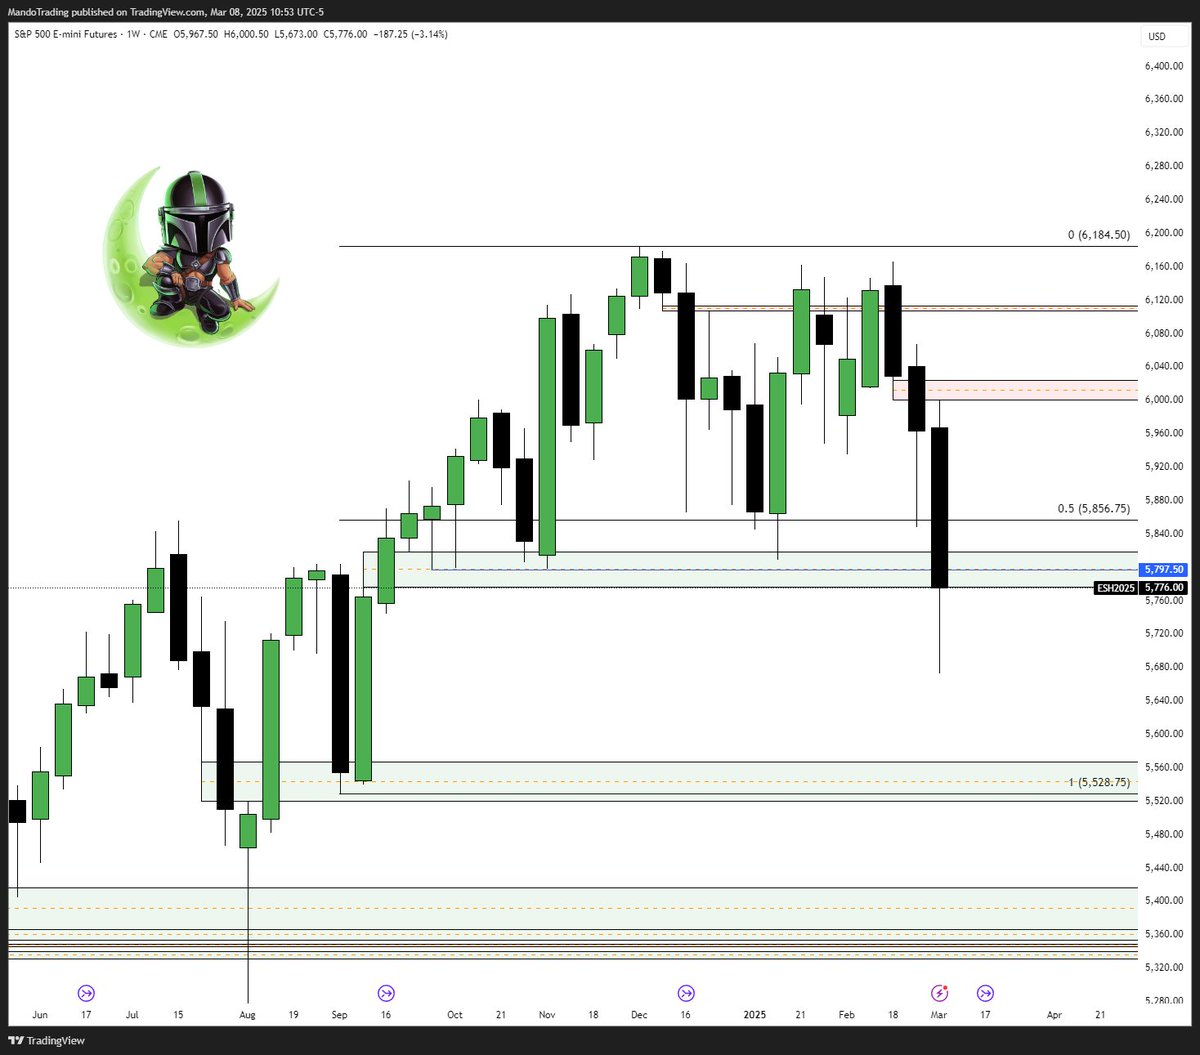
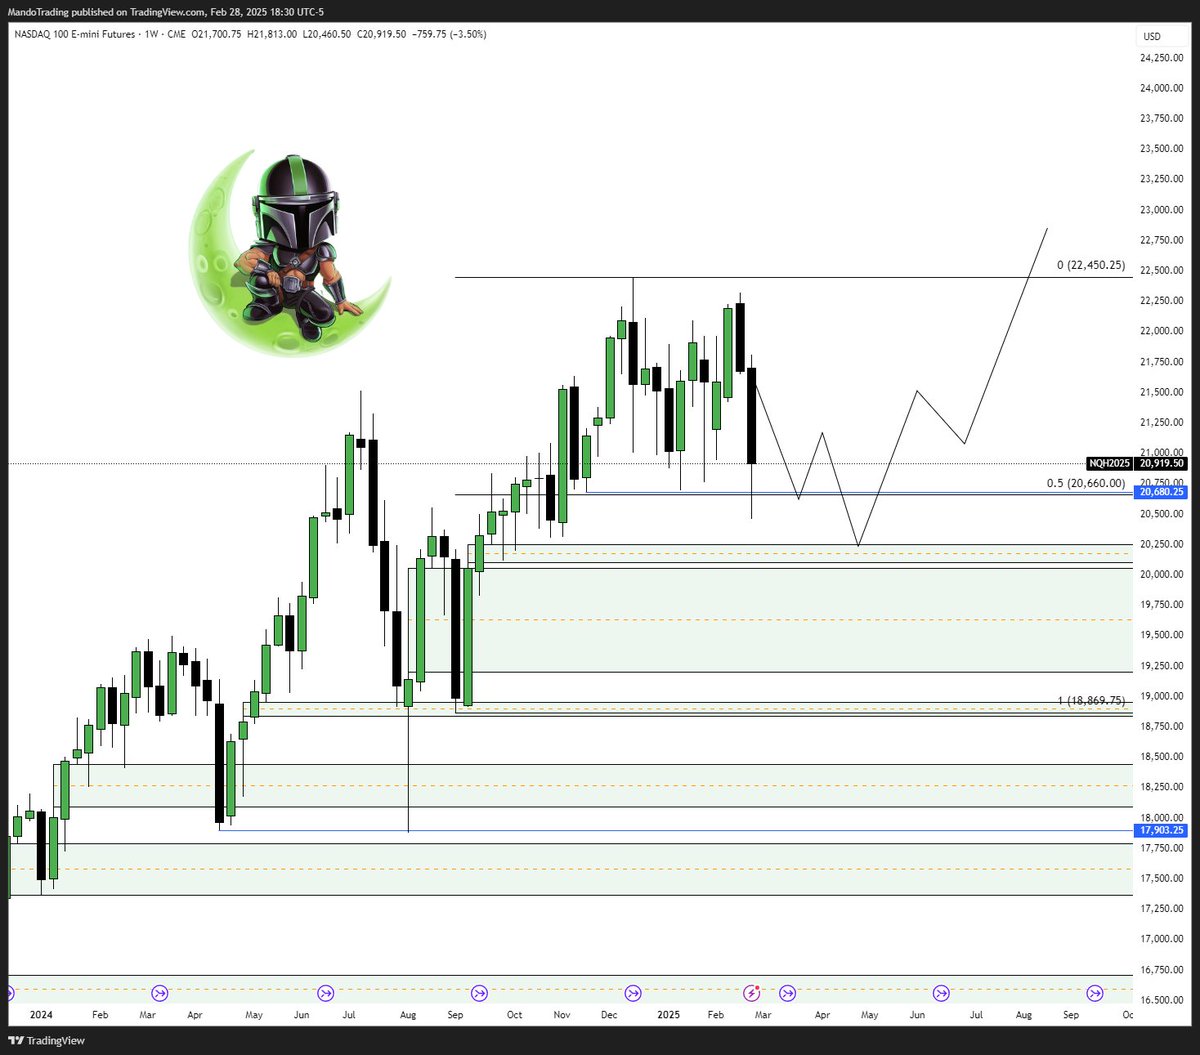
First is understanding higher time frame context:
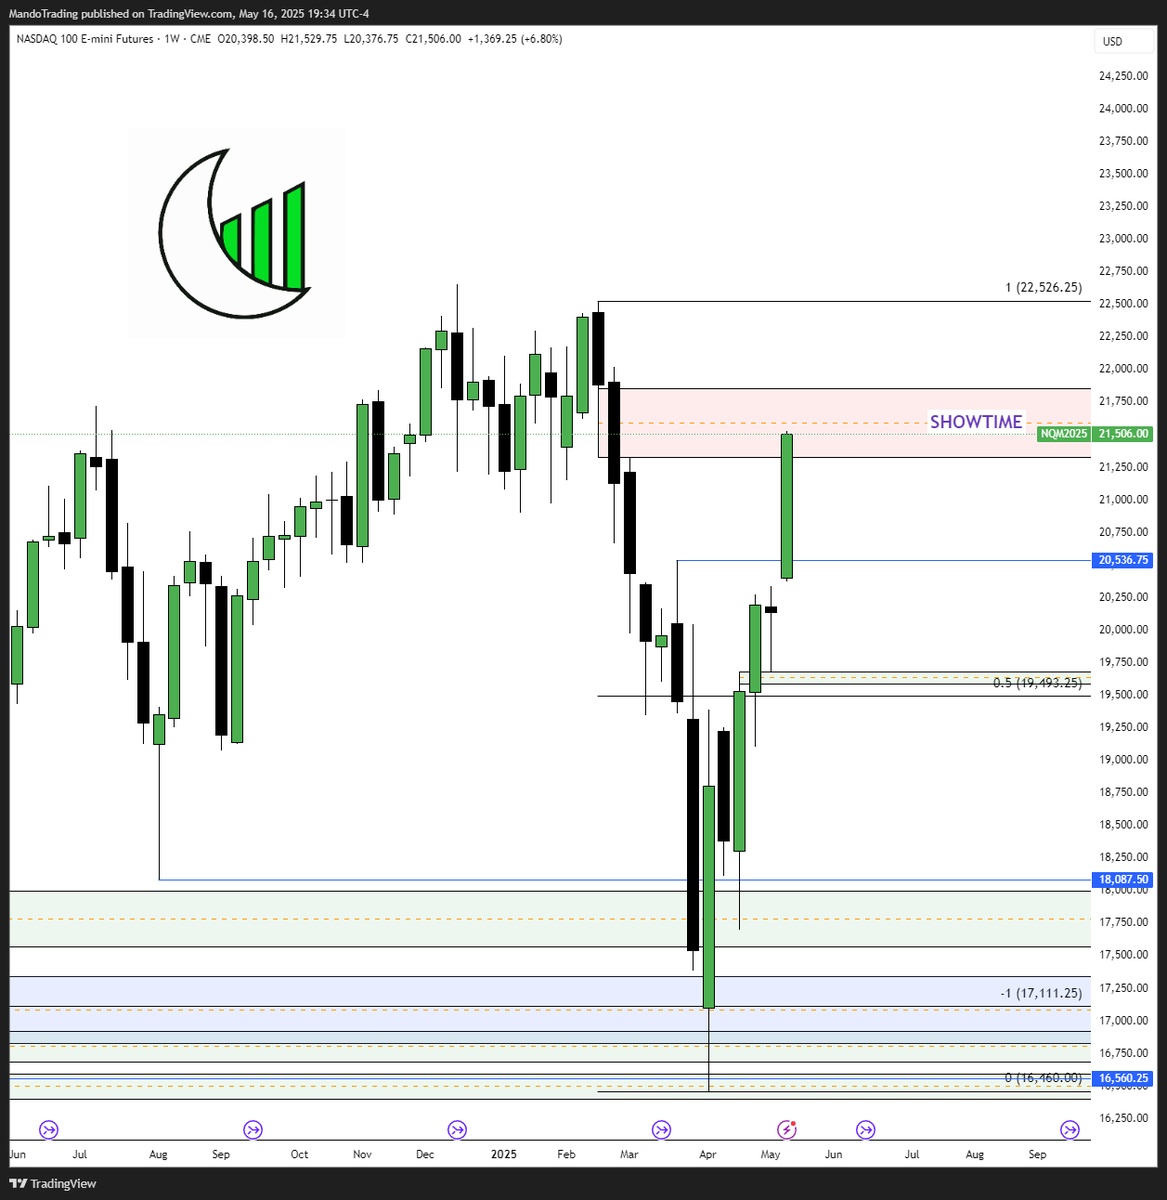
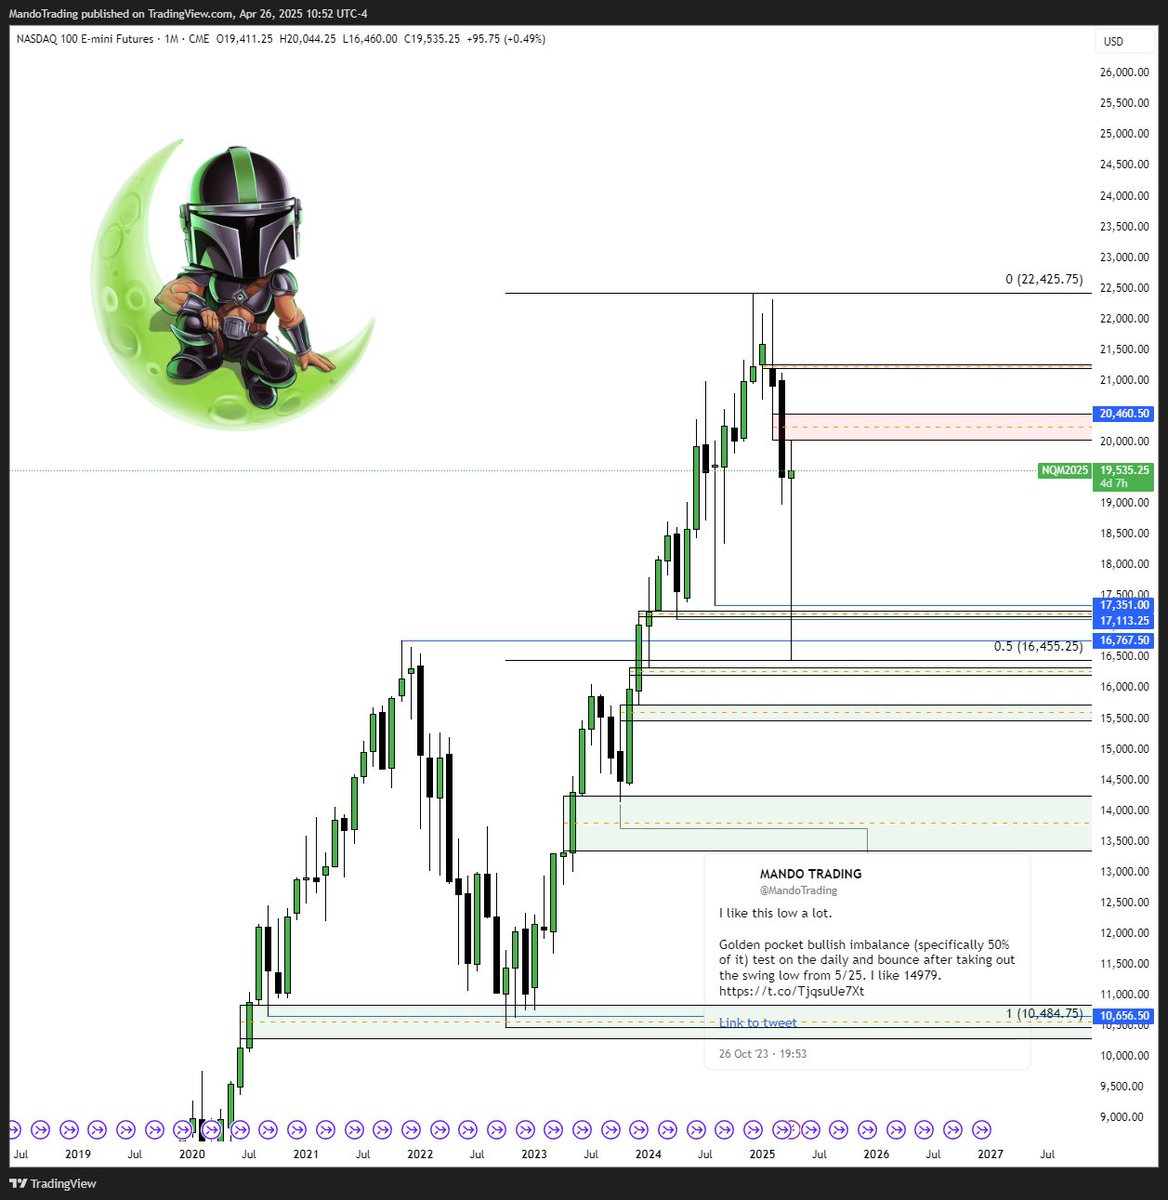
Every candle should be viewed as information. Which candles offer you more information? Higher time frame candles because there is more time for orders to come in before closing the candle. So using the higher time frame to offer additional insight to what you are seeing on smaller time frames is paramount.
First is understanding higher time frame context:
Every candle should be viewed as information. Which candles offer you more information? Higher time frame candles because there is more time for orders to come in before closing the candle. So using the higher time frame to offer additional insight to what you are seeing on smaller time frames is paramount.
Now it is time to identify the draw on liquidity aka where is price likely to go...
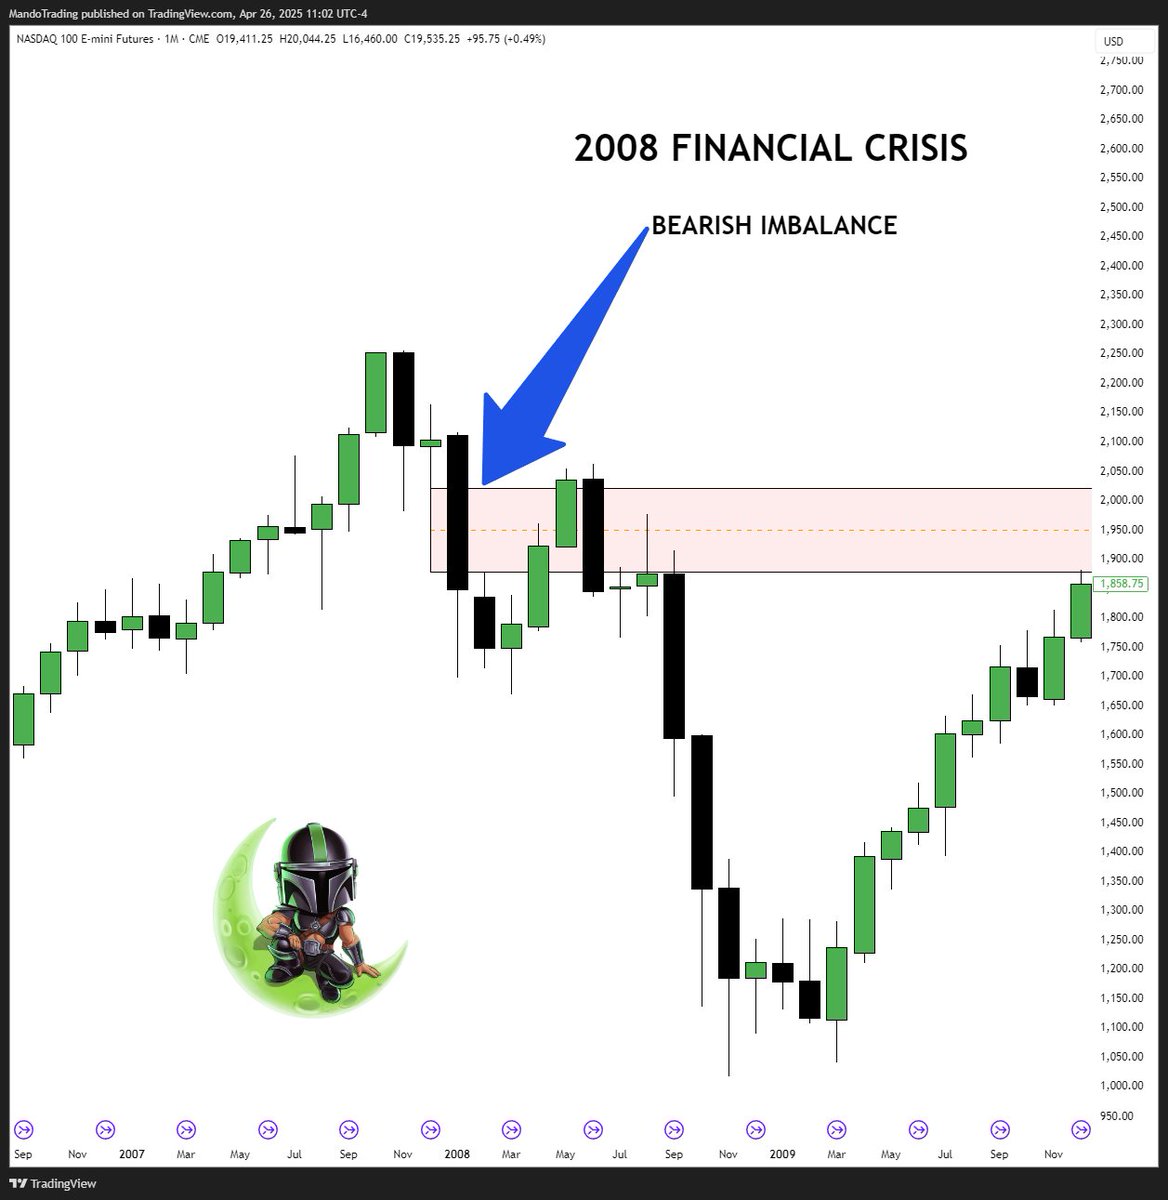
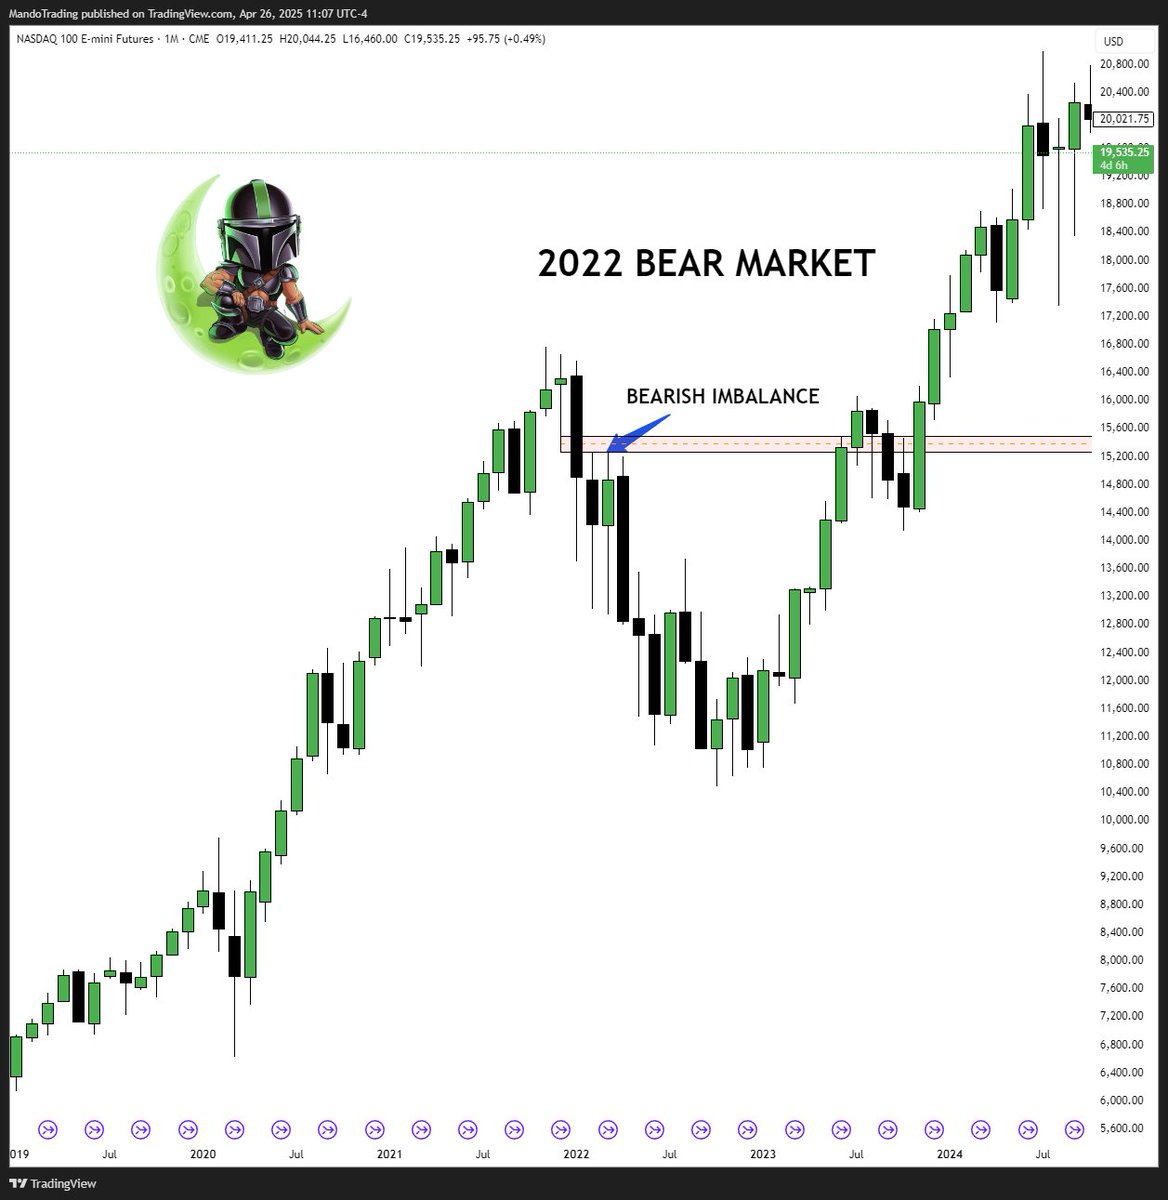
Where is liquidity found? Swing highs and swing lows...
Why? Think logically... for a swing high or low to be put in, what is the only logical explanation for price putting its foot in the ground at that specific price? For swing highs, there has to be sellers or a lack of buyers for price to be offered lower, and vice versa... If that is the case, orders are left behind and orders (money) is what I'm referring to when talking about liquidity.
How do we form a directional bias?
Current structure... Look left. Have we recently taken out a swing high or swing low? If so, we can now identify our current structure or "trend"
If we say our trend or structure is bullish, we can identify the draw on liquidity as the swing high in this case.
Current structure... Look left. Have we recently taken out a swing high or swing low? If so, we can now identify our current structure or "trend"
If we say our trend or structure is bullish, we can identify the draw on liquidity as the swing high in this case.
Here is where the "buyable dips" idea comes into play...
If we haven't reached our higher time frame draw, and price is dipping into a bullish imbalance, that is what I would deem a buyable dip, as we have not yet reached the ultimate and final destination for the overarching idea.
Identifying imbalances in price would lead me to posting 4 more pieces to this thread, so I'll save it for another time. or just watch a video on my channel.
This gives me structure for the idea, with a well thought out trade plan in place prior to my entry (take profit, stop loss, etc.)
In the case the draw on liquidity is higher, I anticipate bullish order flow (or levels) to be respected on the incline to the final destination.
In the case the draw on liquidity is higher, I anticipate bullish order flow (or levels) to be respected on the incline to the final destination.
I hope this was insightful. Best of luck!
• • •
Missing some Tweet in this thread? You can try to
force a refresh