18 months in, up 200%.
Am I selling?
Not a single share.
Because $SOFI is just getting started.
🚨 Here's a brief overview of my investment thesis:
Am I selling?
Not a single share.
Because $SOFI is just getting started.
🚨 Here's a brief overview of my investment thesis:

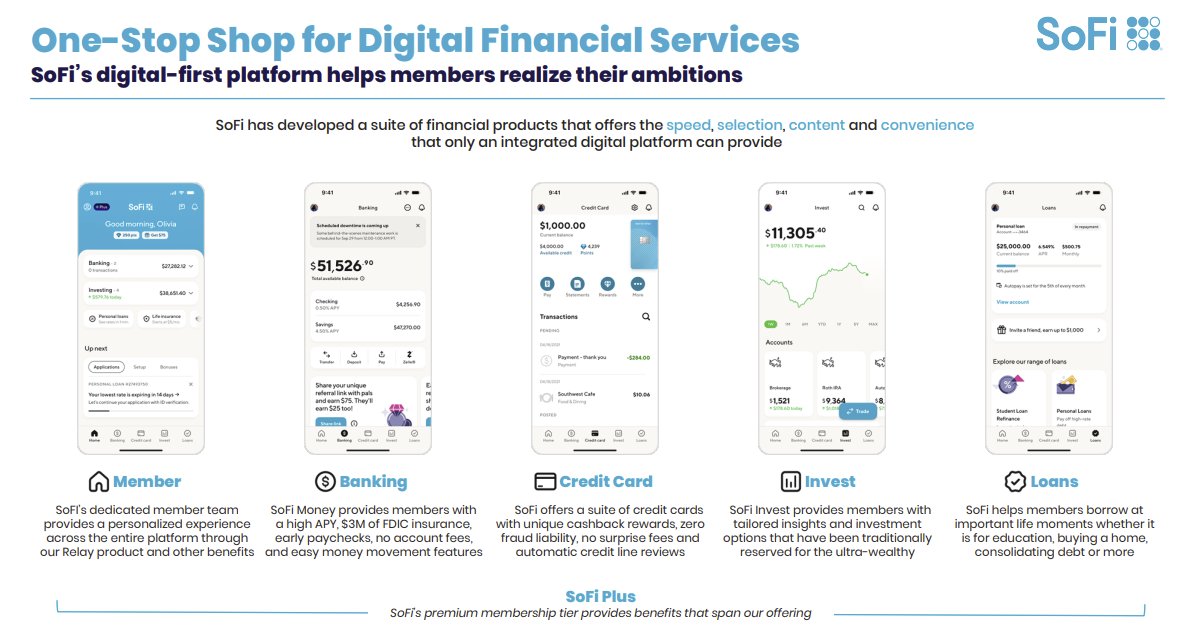
1) The One-Stop Shop for All Things Finance
$SOFI is disrupting traditional banking through its all-in-one financial platform, offering digital financial services such as banking, investing, lending, and more.
For enterprise clients, it also offers banking-as-a-service solutions through its technology platform, Galileo.
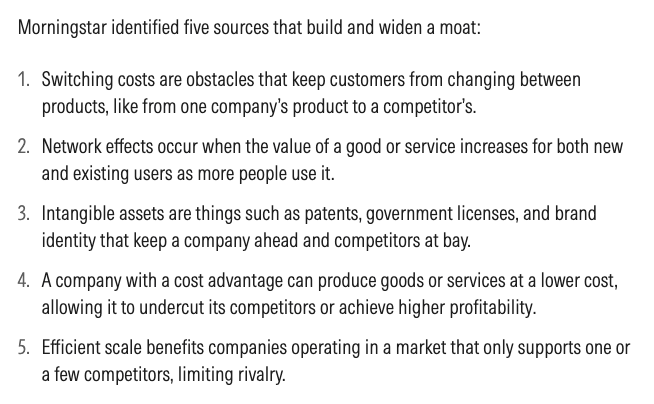
$SOFI's competitive moat stems from:
- its vertically-integrated fintech stack — no other company offers such a complete suite of financial offerings.
- a strong brand presence among the younger demographic, enabling $SOFI to acquire customers early on and cross-sell its products over time.
- a cost advantage over peers, fueled by the Financial Services Productivity Loop, banking charter, and neobank structure.
$SOFI is disrupting traditional banking through its all-in-one financial platform, offering digital financial services such as banking, investing, lending, and more.
For enterprise clients, it also offers banking-as-a-service solutions through its technology platform, Galileo.
$SOFI's competitive moat stems from:
- its vertically-integrated fintech stack — no other company offers such a complete suite of financial offerings.
- a strong brand presence among the younger demographic, enabling $SOFI to acquire customers early on and cross-sell its products over time.
- a cost advantage over peers, fueled by the Financial Services Productivity Loop, banking charter, and neobank structure.
2) Only 3.3% Market Penetration
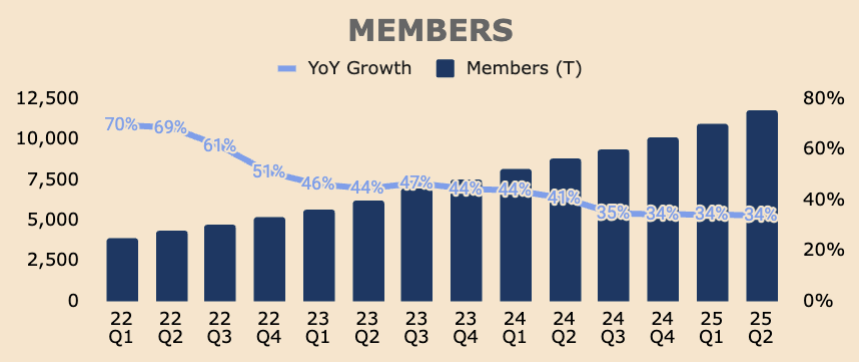
$SOFI has experienced extreme growth over the last five years, with Members, Products, and Revenue growing at a CAGR of 58%, 60%, and 50%, respectively.
In Q2, $SOFI added a record 846K New Members, bringing its Total Members to 11.7M, up 34% YoY.
Despite the exceptional growth momentum, $SOFI's 11.7M Member base is just a mere 3.3% of the 347M people in the US.
For context, $JPM and $BAC serve 84M and 68M consumers, respectively. That's 24% and 20% of the US population.
In other words, it’s not too crazy to assume that $SOFI can amass 50M members in its lifetime, or 15% of the US population.
That's a 4x from here.
Given its strong Member growth, $SOFI is continually taking market share from the big banks, and eventually, it'll become a top 10 financial institution.
3) Financial Services Hypergrowth
$SOFI's Financial Services segment is experiencing extreme growth. In Q2, Financial Services Revenue grew 106% YoY to $363M.
This was driven by several factors, including:
- a 35% YoY growth in Financial Services Product
- a 52% YoY improvement in monetization
- a 37% QoQ growth in the Loan Platform Business
Interestingly, multi-product adoption is still low at 1.46 Products Per Member. This means that members, on average, use fewer than two products. This is quite low, considering that SOFI offers nine major products.
However, I expect members to adopt more products over time, as they are continually exposed to other products in $SOFI's all-in-one app.
Just imagine how much more Revenue $SOFI could extract if Product Per Member rises to three or even four.

4) Lending Reacceleration
The Lending segment is $SOFI's bread and butter, its largest and most profitable segment.
After years of growth pressure due to the student loan moratorium, housing reset, and high interest rates, the Lending segment is showing signs of life as growth has accelerated for five straight quarters.
In Q2, Lending Adjusted Revenue was $447M, up 32% YoY.
Total Loan Originations were a record $8.8B in Q2, up 64% YoY.
Safe to say, the Lending segment is back in full force.
But here's why the segment will continue to accelerate:
- the Loan Platform Business is gaining steam
- Student loan volumes were $994M, nowhere near its pre-pandemic peak of $2.4B — the potential is there.
- New products like flexible student loan refinancing and home equity offering are seeing solid traction.
Also, interest rates haven't even come down yet — just imagine how much demand will come $SOFI's way when it does.

5) Tech Platform Deal Pipeline
The "AWS of Fintech" narrative has waned as growth for the Tech Platform segment remain muted.
- Tech Platform Revenue was $110M, up 15% YoY.
- Tech Platform Accounts were 160M, up only 1% YoY.
However, a robust deal pipeline awaits the segment.
During the earnings call, management mentioned that $SOFI
- signed two additional companies that are expected to launch later this year.
- anticipates 10 new clients that will contribute to Revenue growth strating in Q1 2026.
In other words, expect the Tech Platform to reaccelerate in the near future.

6) Turning Capital-Light
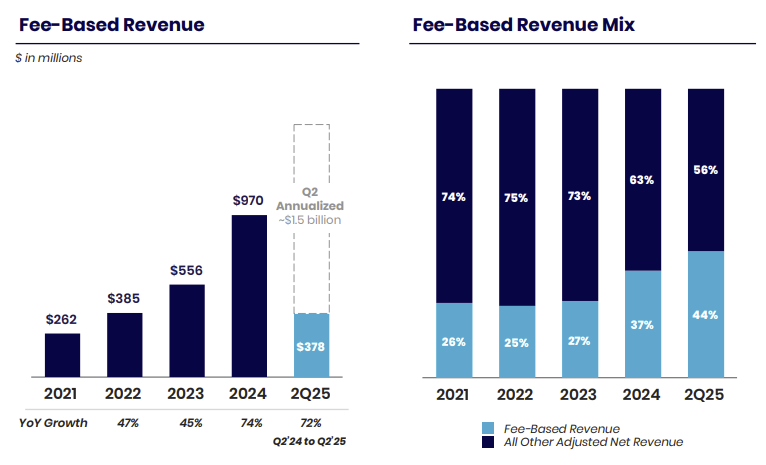
$SOFI is transitioning to fee-based, capital-light, high-margin Revenue streams.
As of Q2, Fee-Based Revenue makes up 44% of Total Revenue, up from just 27% in 2023.
This was mainly driven by the growth of the Loan Platform Business, which generated $131M of Revenue, up 37% QoQ.
In Q2 last year, it generated only $12M.
This growth spurt was due to a pivot in Q3 2024, where the LPB began originating loans on behalf of third parties — instead of just referring them to third parties, as they have historically done via its Lantern marketplace.
This way, $SOFI could:
- Scale in a capital-light manner, generating high-margin Revenue with no credit risk.
- Serve more members, well beyond its credit box, thus monetizing $100B in unmet loan demand.
- Retain member relationships, keeping them in the Financial Services Productivity Loop.
The LPB is experiencing unprecedented demand at the moment, securing a total of $10.2B of LPB agreements from capital partners, and so far, the LPB has originated $6.1B of loans.
In Q2 alone, the LPB originated $2.4B, an annual runrate of nearly $10B.
Given its rapid origination cadence, I expect the LPB to sign more deals in the near future.
This will generate more high-margin, Fee-Based Revenue, thus contibuting to the company's bottom line.
7) Strong Operating Leverage
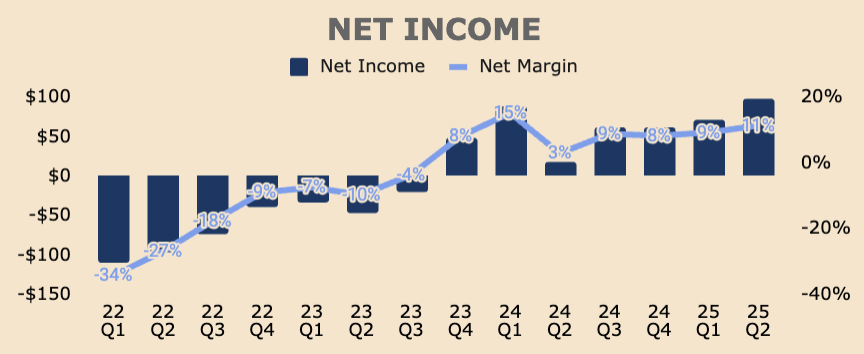
$SOFI is gaining strong operating leverage with each passing quarter. In Q2:
- Contribution Profit was $466M at a 54% Margin, up 6pp YoY.
- Adjsuted EBITDA was $249M at a 29% Margin, up 6pp YoY.
- Net Income was $97M at an 11% Margin, up 8pp YoY.
Best of all, $SOFI has a clear pathway to expand margins further.
For one, Incremental Adjusted EBITDA Margin was 43%, meaning $SOFI has the potential to expand Adjusted EBITDA Margins to as high as 40%.
In addition, the big banks have Net Margins of as high as 30%+. This means that $SOFI has the potential to 3x its current Net Margin.
In other words, $SOFI's profitability journey is still very early.
8) Balance Sheet Expansion
$SOFI continues to expand its balance sheet:
- Total Loans were $32.2B, up $3.1B QoQ.
- Total Deposits were $29.5B, up $2.2B QoQ.
- Total Debt was $3.9B, up $0.9B QoQ.
Importantly, $SOFI is growing its balance sheet responsibly, maintaing strong credit perfomance, with recent loan vintages outperforming old vintages by a wide margin.

9) Flawless Execution
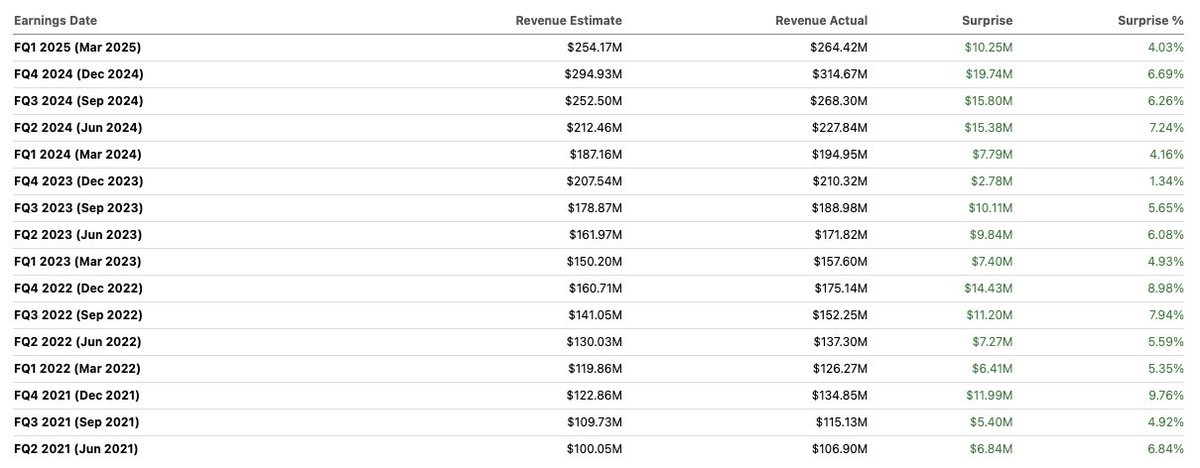
$SOFI has a perfect track record of beating analyst Revenue estimates, displaying impeccable execution by management.
They have also beaten and raised their guidance countless times, showing a knack for outperformance.
Recently, management raised their FY2025 Revenue, Adjusted EBITDA, and EPS guidance by $100M, $75M, and $0.04, respectively!
Noto & Co. is definitely not messing around.
They have shown, time and time again, that they're serious about taking $SOFI to being a top 10 financial institution.

10) Still Undervalued
Despite running more than 200% in the last few months, $SOFI — believe it or not — is still undervalued.
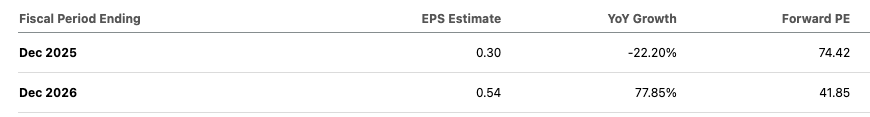
Case in point. $SOFI currently trades at a Forward PE of about 74x, but that's based on 2025 EPS estimate of $0.30, which is below management’s revised guidance of $0.31.
In addition, analysts estimate 2026 EPS to be $0.54, which is also below management's guidance of $0.55 to $0.80.
Analysts forget that management likes to not only sandbag their guidance but also destroy it in the process.
That said, I believe $SOFI will achieve an EPS of $1.00 in 2026, valuing SOFI at a 2026 Forward PE of about 21x today.
Now that looks like a good valuation to pay.
Some catalysts to consider include:
- new deals for the Loan Platform Business
- acquisitions
- relaunch of crypto offerings
- interest rate cuts
Despite running more than 200% in the last few months, $SOFI — believe it or not — is still undervalued.
Case in point. $SOFI currently trades at a Forward PE of about 74x, but that's based on 2025 EPS estimate of $0.30, which is below management’s revised guidance of $0.31.
In addition, analysts estimate 2026 EPS to be $0.54, which is also below management's guidance of $0.55 to $0.80.
Analysts forget that management likes to not only sandbag their guidance but also destroy it in the process.
That said, I believe $SOFI will achieve an EPS of $1.00 in 2026, valuing SOFI at a 2026 Forward PE of about 21x today.
Now that looks like a good valuation to pay.
Some catalysts to consider include:
- new deals for the Loan Platform Business
- acquisitions
- relaunch of crypto offerings
- interest rate cuts
That's a wrap!
If you would like to read my full investment thesis on $SOFI, do check out my deep dive article here:
These posts take a lot of time and energy to write, so I would appreciate a like, share, and subscribe.
Thank you for your support!rscapital.substack.com/p/a-deep-dive-…
If you would like to read my full investment thesis on $SOFI, do check out my deep dive article here:
These posts take a lot of time and energy to write, so I would appreciate a like, share, and subscribe.
Thank you for your support!rscapital.substack.com/p/a-deep-dive-…
• • •
Missing some Tweet in this thread? You can try to
force a refresh