Job revisions have a well-known strong cyclical component; as the economy slows it is more difficult to estimate business births and deaths.
Here's average revisions as % employment for 18 months before and after a recession, from 1979 to 2025. It's negative in the slowdown. /1
Or consider the last decade. Essentially zero pre-covid.
Sharply negative under lockdowns. But very positive when the economy was gaining millions of jobs back in 2021, as the models couldn't keep up with recovery. But then negative as that recovery leveled out in 2023-2024. /2
Here you can see that with a longer-timeframe. This is very common.
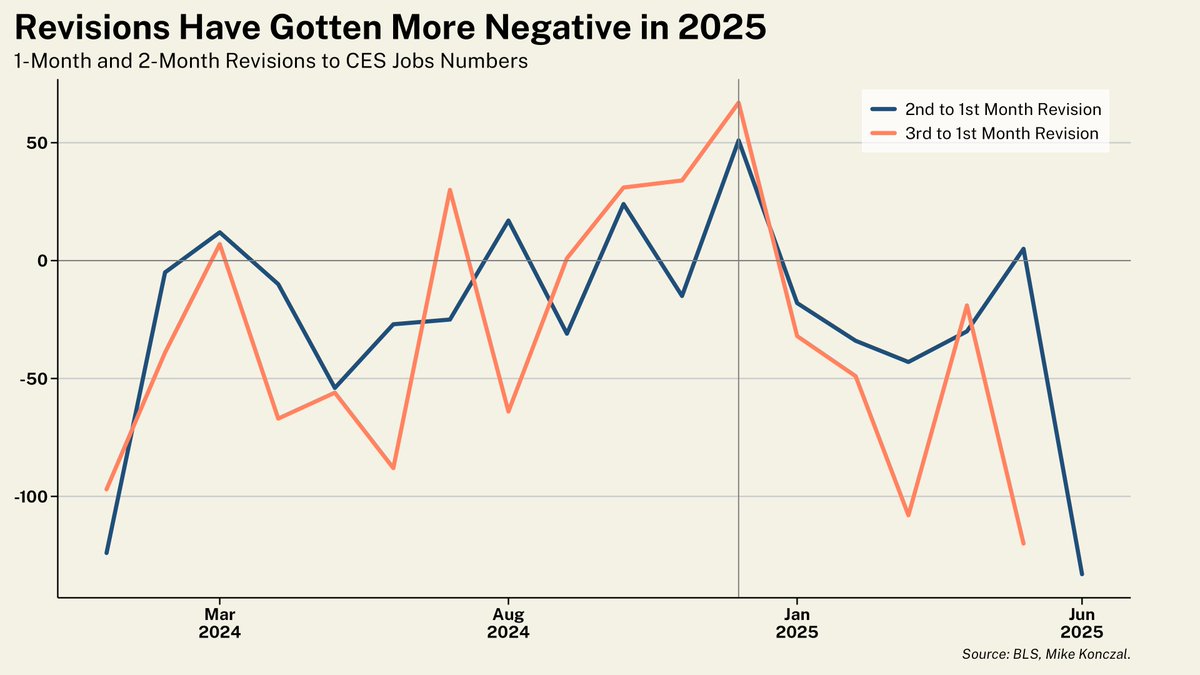
The question right now, as it was in 2023, is whether the revisions indicate slowing into a lower stable steady-state (as it did then), or an actual downward freefall. 3/4
Trump firing Erika Mcentarfer is despicable by itself and threaten our general prosperity.
But make no mistake: there is nothing abnormal about revisions at this point in a business cycle. This administration is slowing the economy in the short-term and revisions result. 4/4
• • •
Missing some Tweet in this thread? You can try to
force a refresh
This is a bad jobs report. 73,000 jobs would have been worrisome to begin with, but deeply negative revisions to the previous two-months wiped out much of the recent gains. 2025 looks a lot worse the further we get into it.
There's a lot to cover, let's dig in. /1
First: revisions. Negative revisions naturally occur at the end of recoveries/economic turning points from complexities of estimating business births, deaths, and seasonal adjusts.
While it was negative in early 2024 alongside strong jobs growth, it is collapsing now in 2025. /2
Middle column here is just May and June incorporating the revision, where private education and health services account for 170% of all private sector job growth.
Manufacturing jobs are being lost at a comparable clip to Federal jobs, -11/-12 in July and -13/-18 previously. /3
The GDP numbers for the 2nd quarter, like in the first, are being driven by wild swings in exports and inventories.
While GDP rebounds for a still weak 1.22% in the first half of 2025, under the hood final sales to private domestic purchasers looks quite weak. Let's dig in. /1
You can see this in the components of GDP, where investment (driven by inventories) and net exports are doing wild, probably historically unique, things.
But look at the last two consumptions prints. People are spending less, and it's a notable drag. /2
With 6 months we can compare 1st half of 2025 to the 2nd half of 2024 and note that, across the board, GDP and labor market, 2025 is doing worse.
In 2024 everything looked great except for the unemployment rate; in 2025 everything looks worse except for the unemployment rate. /3
Solid jobs numbers today. Headline unemployment unchanged, and 139,000 new jobs.
But a few things I'd flag for underlying cooling: (1) Last two months revised down -95K. 2-month monthly revisions have averaged -63K in 2025. So reasonable chance this ends up under 100K. /1
The rounding gods were kind this month, with unemployment ticking up to 4.24 percent. You can see the slow increase over the past few months.
At that slow but steady pace you are at ~4.7 percent unemployment at the end of year, consistent with some forecasts on tariff impact. /2
More, the composition gods were very kind this month, with unemployment falling because people aren't leaving their jobs, which helped offset the new entrants who can't find work.
The last 2 recessions were crazy; but weakness leaving unemployment drives smaller recessions. /3
As we risk stagflation and chaos to bring back manufacturing jobs, I took a look at how manufacturing workers reacted to the hot labor market of 2022-2023.
A result that surprised me: it turns out they were the industry with the highest increases in their quits rate. 1/4
Link here, which builds off the recent manufacturing jobs polling and then NEC director Gary Cohn's 2018 (incorrect) dive into JOLTS data.
In terms of absolute increase in quits rate from an environment with some income security and plentiful job openings, manufacturing was only matched by low-wage work in leisure and hospitality. 3/4
Quits and hires rate are now a notable step below 2019 levels.
Quits does better predicting labor market conditions and there's an increasing trend in job openings across the 21C. So, at this critical moment, worth weighing quits more when we are watching labor market. /1
If the concern is in (wage-inertial?) services, hires and quits levels are also below there, and have been falling consistently.
There has been a lot of shifting and upgrading in the labor market during the recovery, and that process has played itself out. Time to reassess. /2
If you are still focused on job openings because you think 'openings over vacancies' is a proxy for output deviations that gives a nonlinear Phillips Curve that fits this recovery, well, sorry bub, that's over. It fell off months ago.
A year ago these numbers were above 4 percent. I understand the yawns and the sense it's old news, but this is just a massive and wild achievement. Let's dig in and discuss the last mile and what just happened. /1
Last mile: weighted contribution to overall inflation by major categories over past 6 months.
We are at 2%. Core goods pull that down about -0.5%; easy to see how to replace that. For all the fears on non-housing inflation, it's only pulling up 0.2% compared to 2018-2019. /2
Here's a different version of approaching that chart. Non-housing services is volatile month-to-month, both now and before 2020.
We can debate where underlying is between 2 and 2.5 percent right now, but rates are set as if underlying is between 4 and 5 percent. Or: too high. /3