In this THREAD I will explain “Pullbacks”
1. What is a Pullback?
2. What is a Retracement?
3. What is a Reversal?
🧵(1/14)
1. What is a Pullback?
2. What is a Retracement?
3. What is a Reversal?
🧵(1/14)

1. What is a Pullback?
A pullback refers to a temporary price decrease or pause within a larger upward trend.
It's a short-term retracement that doesn't signify a change in the overall direction of the trend.
A pullback refers to a temporary price decrease or pause within a larger upward trend.
It's a short-term retracement that doesn't signify a change in the overall direction of the trend.
1.2 What is a Pullback?
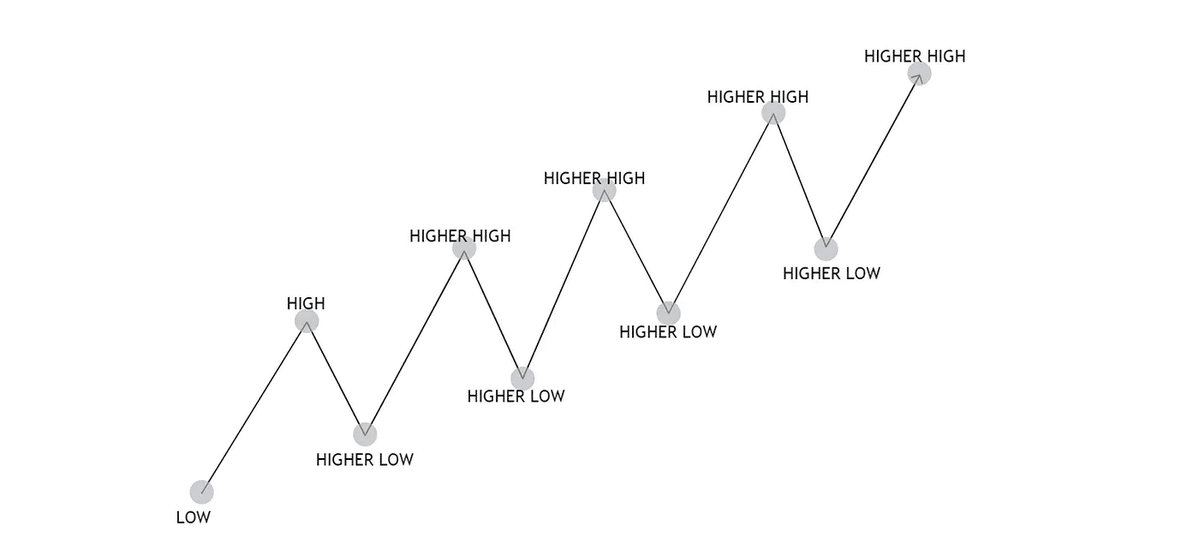
Pivots can be defined as significant Highs or Lows that act as potential reversal or support/resistance points.
Pivot point analysis helps traders identify pullbacks.
Pivots can be defined as significant Highs or Lows that act as potential reversal or support/resistance points.
Pivot point analysis helps traders identify pullbacks.
1.3 What is a Pullback?
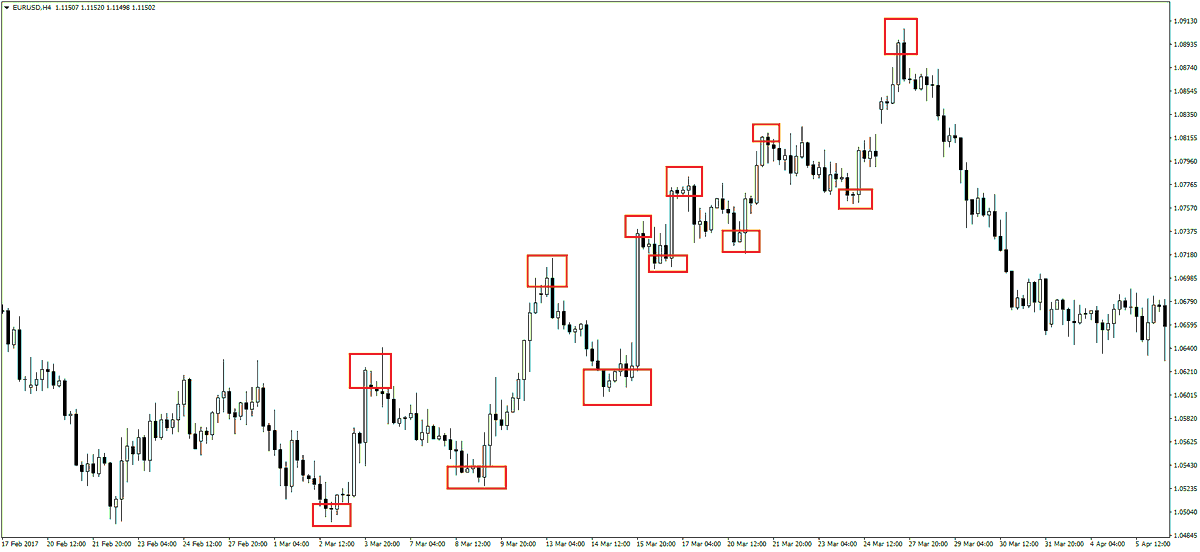
Pullbacks usually happen when volatility spikes.
That means when the market gets nervous and prices move fast, it often leads to short-term drops.
Once things calm down and volatility falls, prices tend to bounce back.
Pullbacks usually happen when volatility spikes.
That means when the market gets nervous and prices move fast, it often leads to short-term drops.
Once things calm down and volatility falls, prices tend to bounce back.
1.4 What is a Pullback?
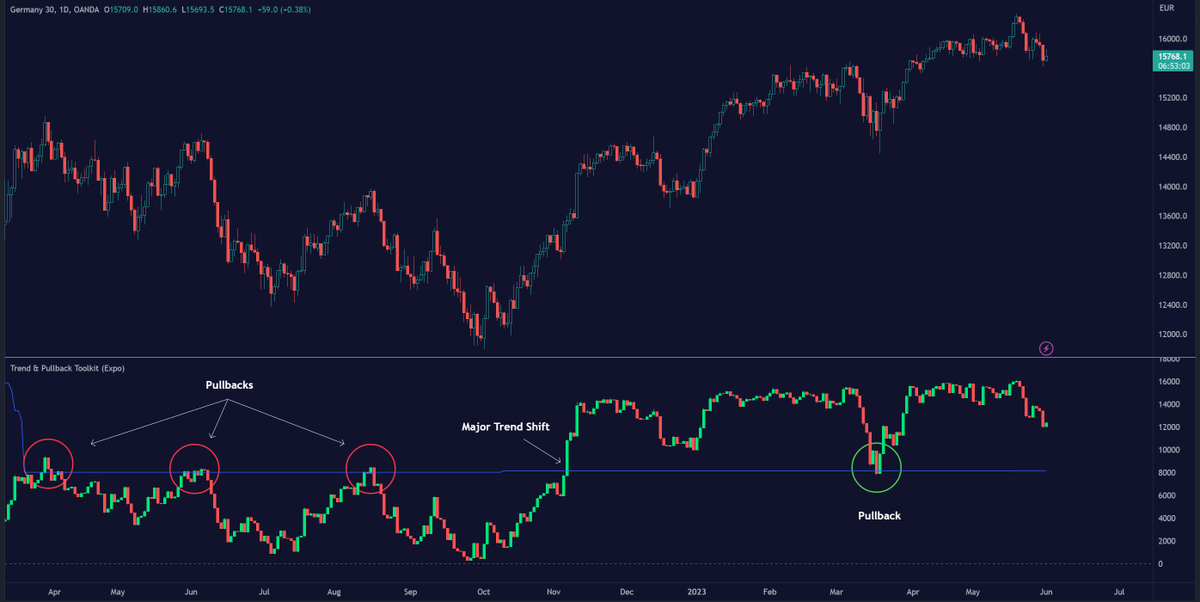
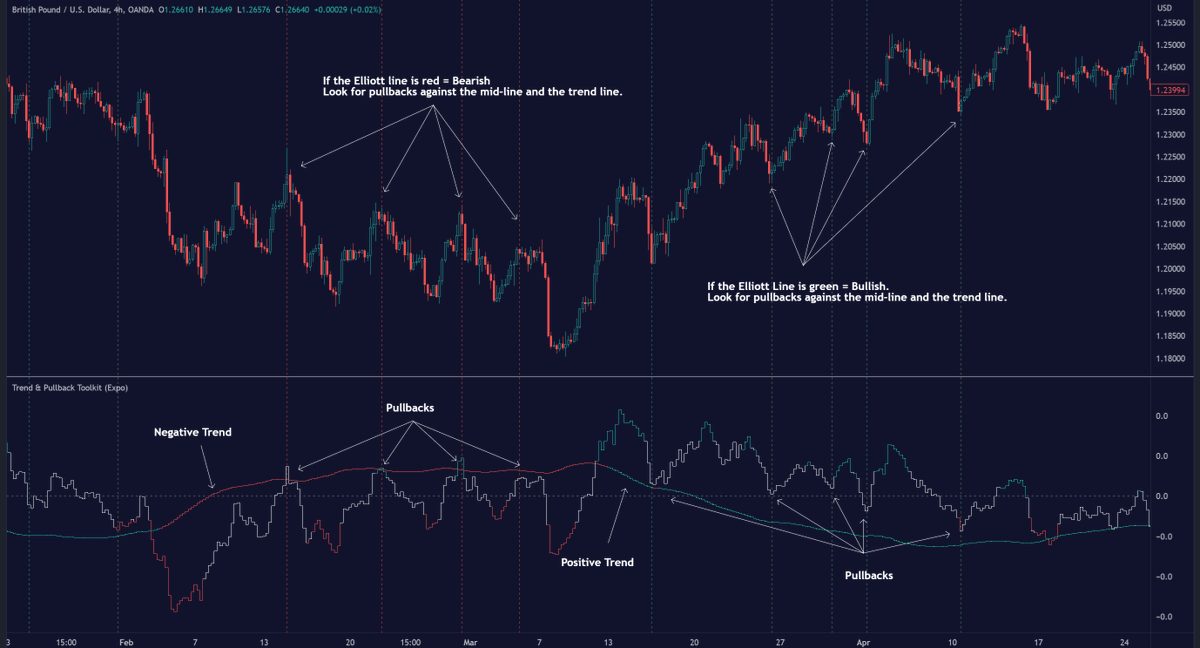
Elliott Wave theory asserts that markets move in repetitive cycles.
The core principle behind the theory is that prices alternate between an impulsive or driving phase.
And a corrective phase on all time scales of trend.
Elliott Wave theory asserts that markets move in repetitive cycles.
The core principle behind the theory is that prices alternate between an impulsive or driving phase.
And a corrective phase on all time scales of trend.
1.5 What is a Pullback?
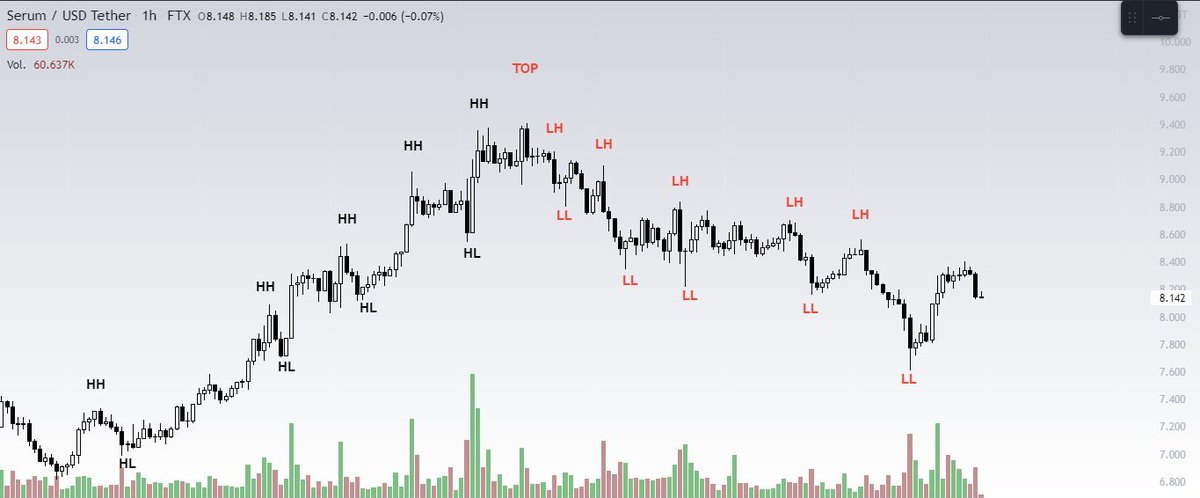
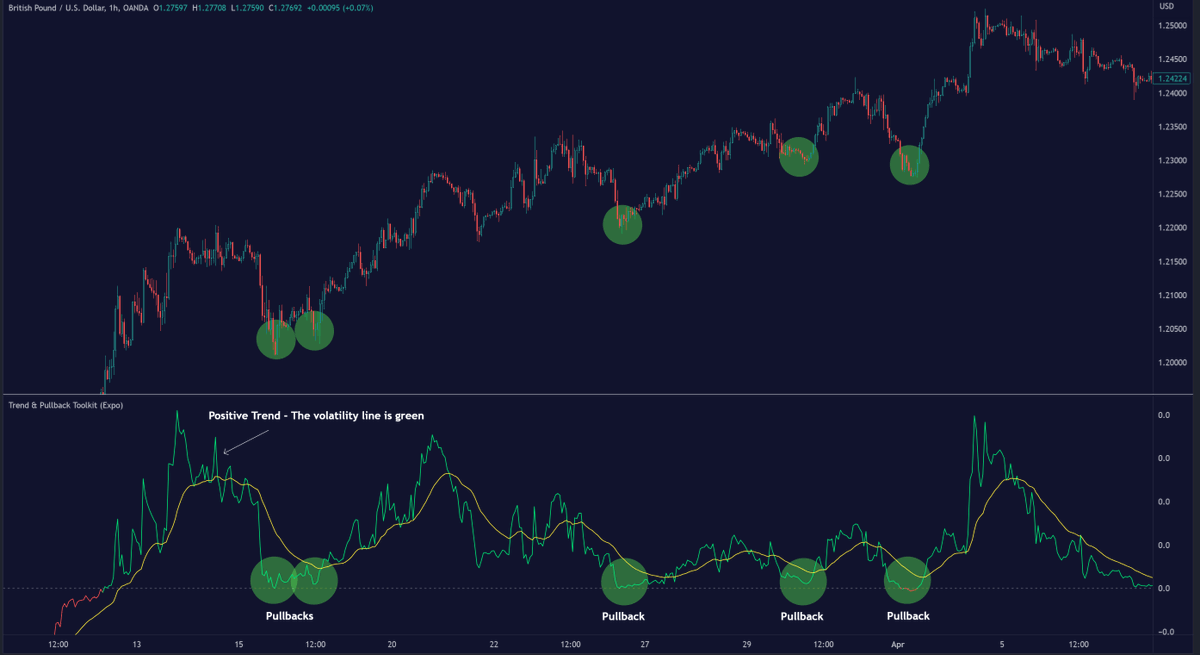
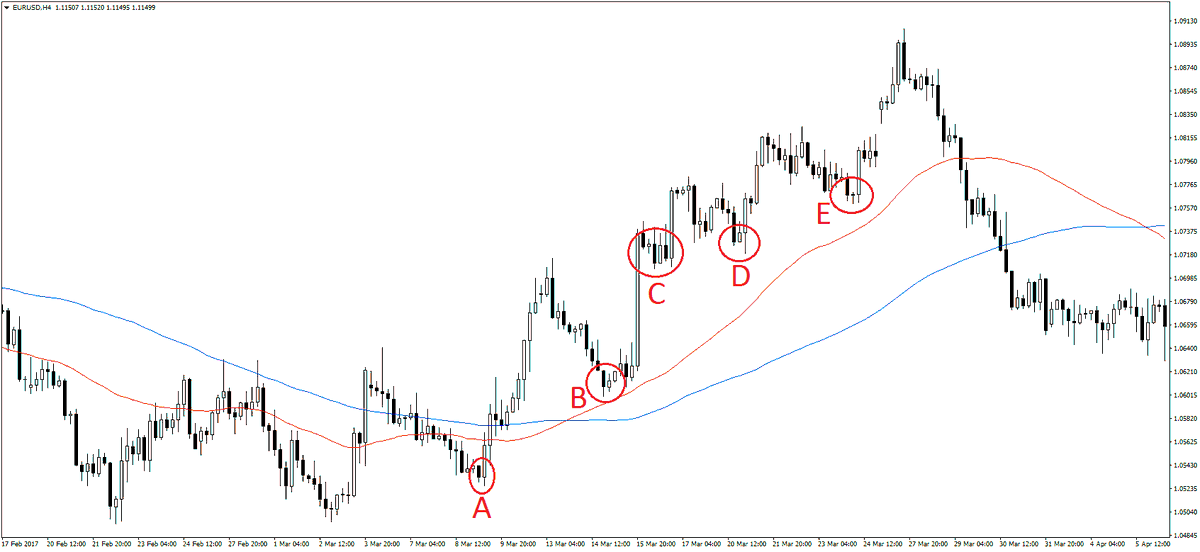
This chart shows a clear uptrend with multiple pullbacks (A to E)
Each dip finds support near the moving averages before the trend resumes.
They are healthy pullbacks in a strong trend.
Traders use these pauses as entry points in trending markets.
This chart shows a clear uptrend with multiple pullbacks (A to E)
Each dip finds support near the moving averages before the trend resumes.
They are healthy pullbacks in a strong trend.
Traders use these pauses as entry points in trending markets.
1.6 What is a Pullback?
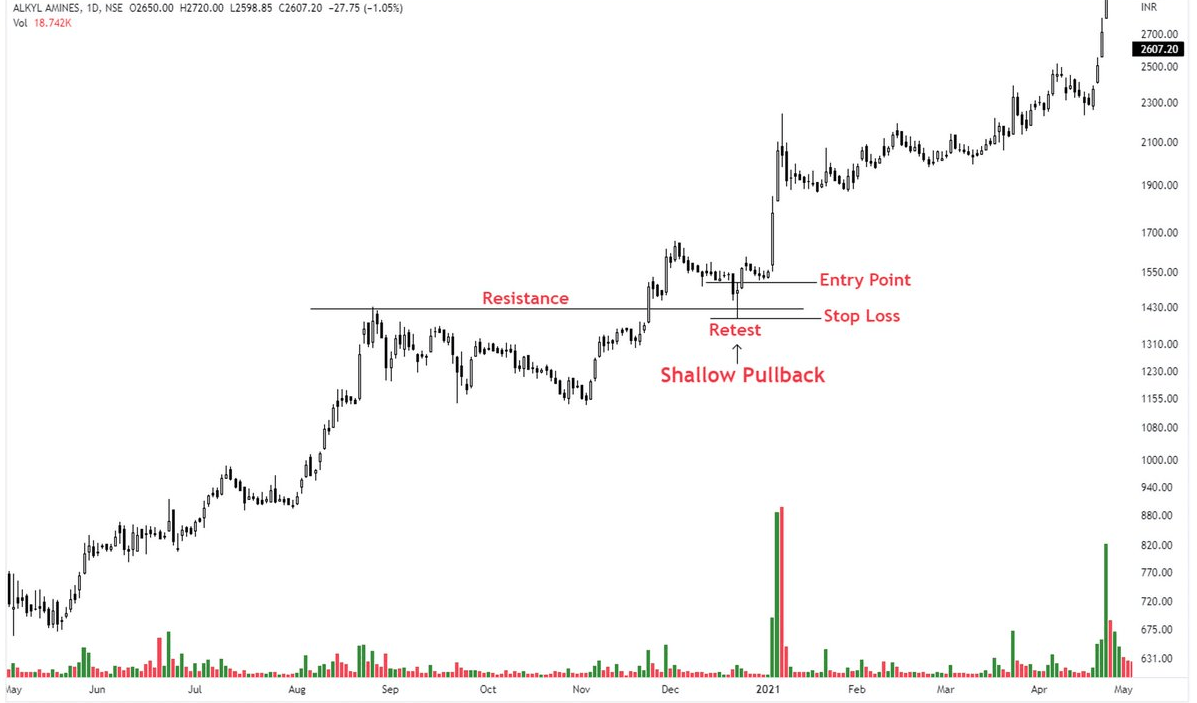
Shallow pullback is a brief and limited price retracement within a prevailing trend.
These pullbacks are typically characterized by a small price movement against the main trend.
Often less than 38.2% of the preceding price move
Shallow pullback is a brief and limited price retracement within a prevailing trend.
These pullbacks are typically characterized by a small price movement against the main trend.
Often less than 38.2% of the preceding price move
1.7 What is a Pullback?
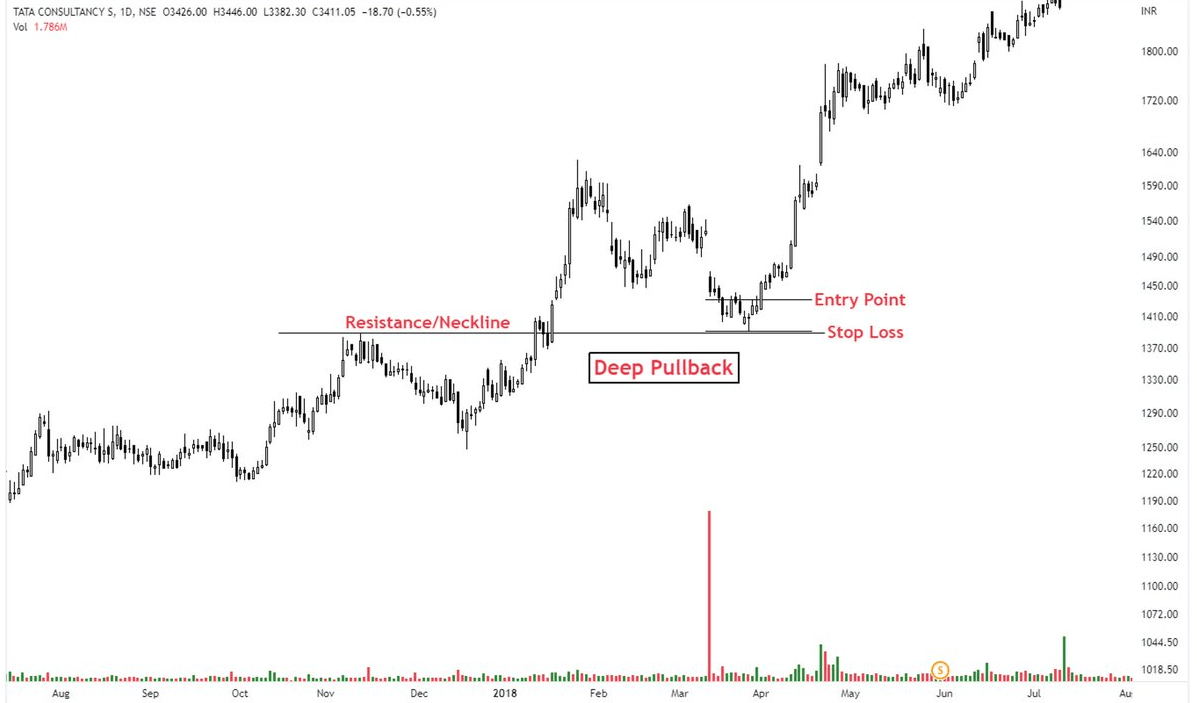
A deep pullback in trading is a substantial price retracement within an established uptrend or downtrend.
Typically retracing a large portion (50% to 78.6%) of the previous price move.
A deep pullback in trading is a substantial price retracement within an established uptrend or downtrend.
Typically retracing a large portion (50% to 78.6%) of the previous price move.
2. What is a Retracement?
A retracement is a temporary price movement against the prevailing trend.
It's a temporary pause or correction before the price continues in its original trend direction.
A retracement is a temporary price movement against the prevailing trend.
It's a temporary pause or correction before the price continues in its original trend direction.
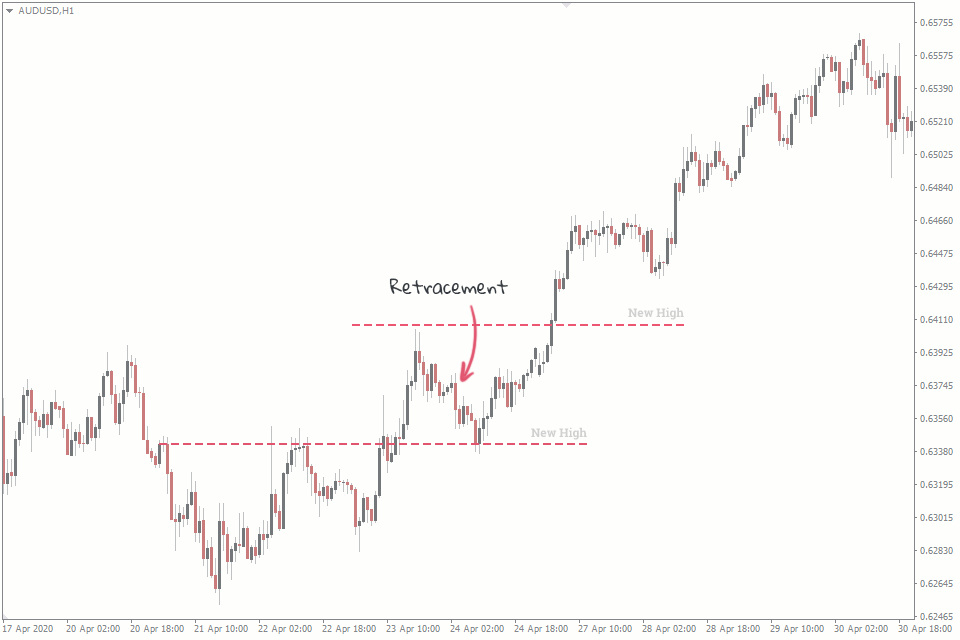
2.1 What is a Retracement?
A retracement is merely a temporary price reversal, taking place within a substantially larger trend.
There should be a continuation of the previous trend when a retracement is over.
A retracement is merely a temporary price reversal, taking place within a substantially larger trend.
There should be a continuation of the previous trend when a retracement is over.
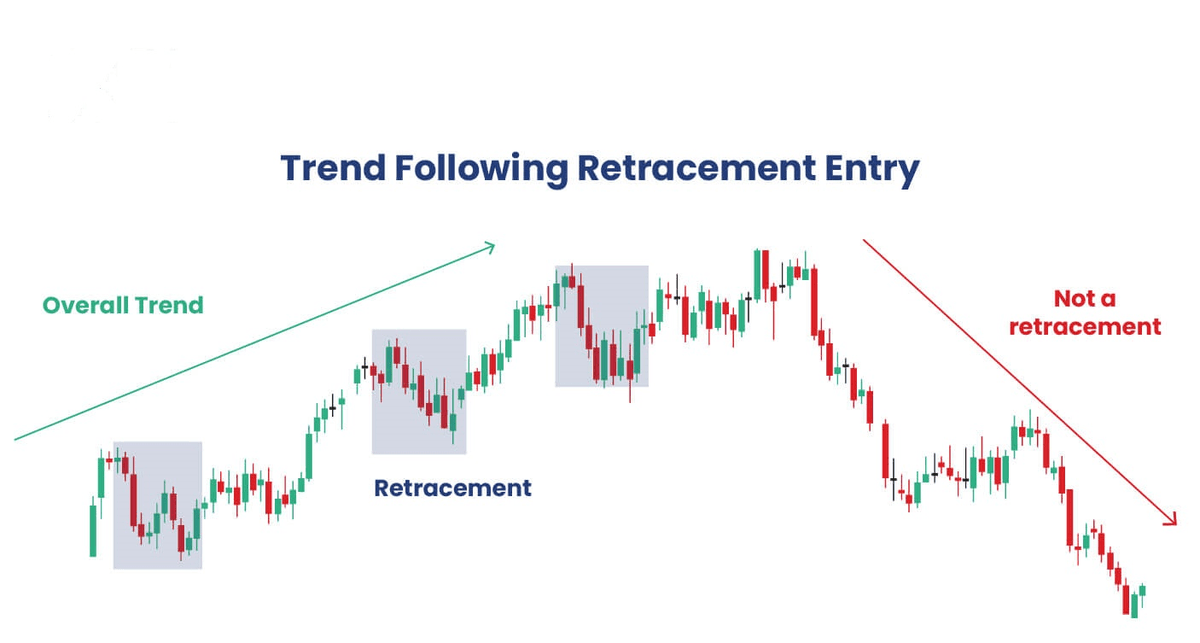
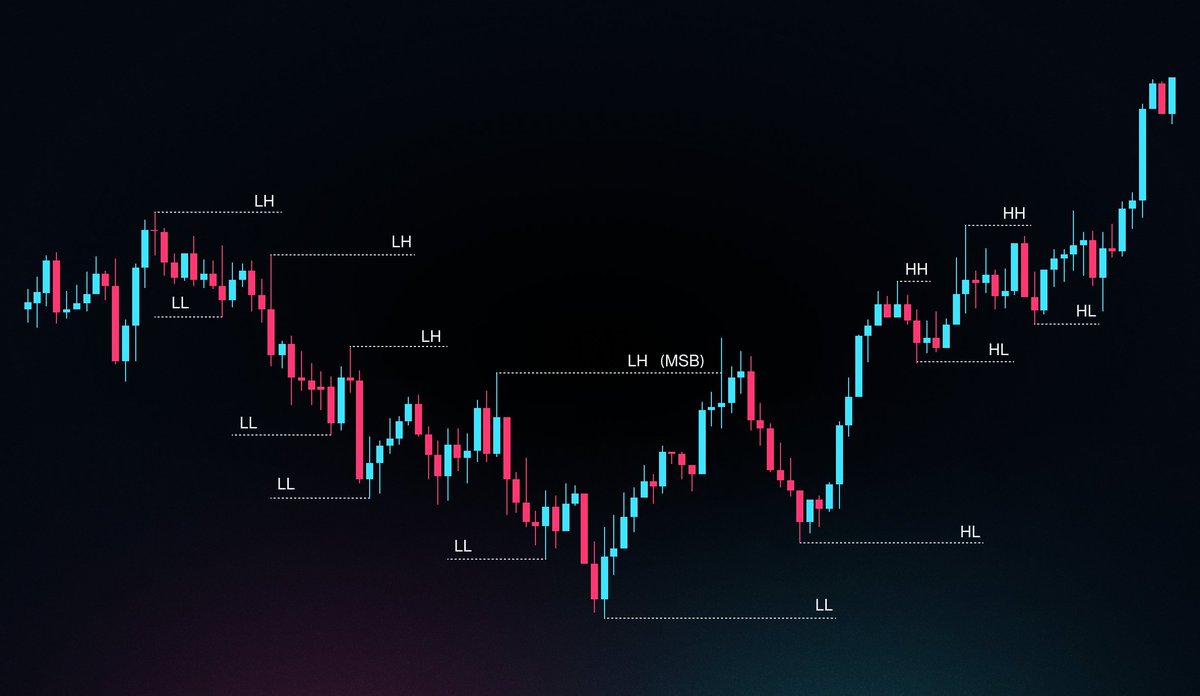
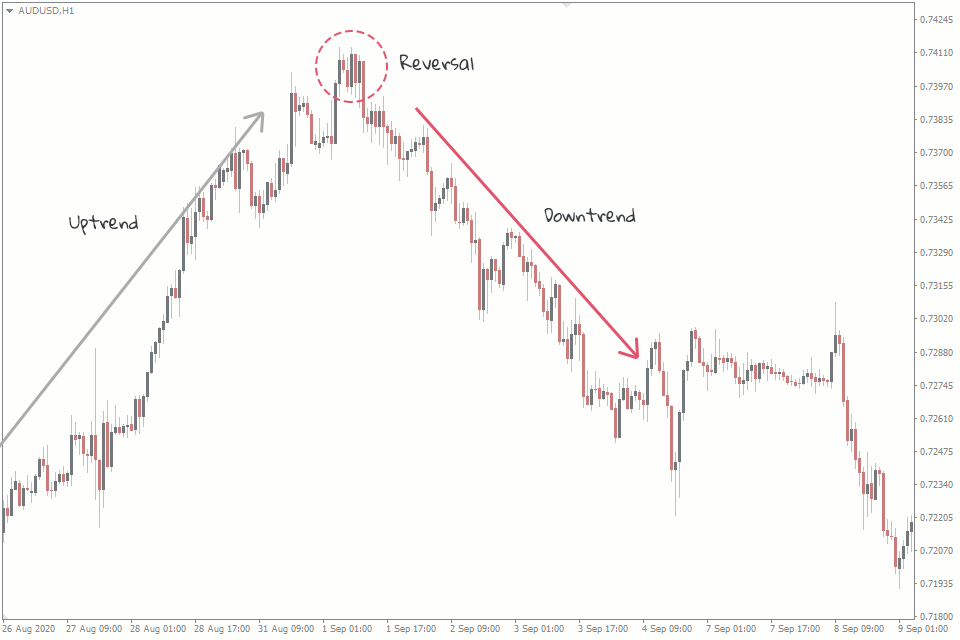
3. What is a Reversal?
A reversal means a shift in the direction of an asset's price movement.
It's when an upward trend (a rally) turns into a downward trend (a correction), or vice versa.
Essentially, it's a change in the prevailing price direction.
A reversal means a shift in the direction of an asset's price movement.
It's when an upward trend (a rally) turns into a downward trend (a correction), or vice versa.
Essentially, it's a change in the prevailing price direction.
3.1 What is a Reversal?
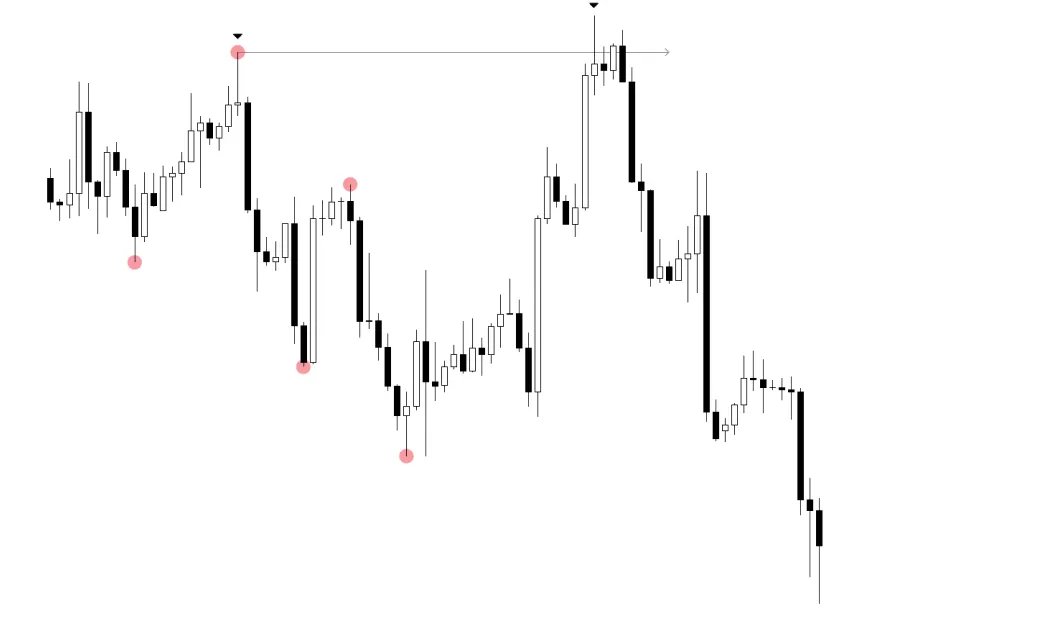
One of the simplest ways you can find high probability reversal trades on different time frames is with the Fibonacci Levels.
In the example below, the price is in a trend higher.
After the price pulls back lower, reverses at 50% Fibonacci Level.
One of the simplest ways you can find high probability reversal trades on different time frames is with the Fibonacci Levels.
In the example below, the price is in a trend higher.
After the price pulls back lower, reverses at 50% Fibonacci Level.

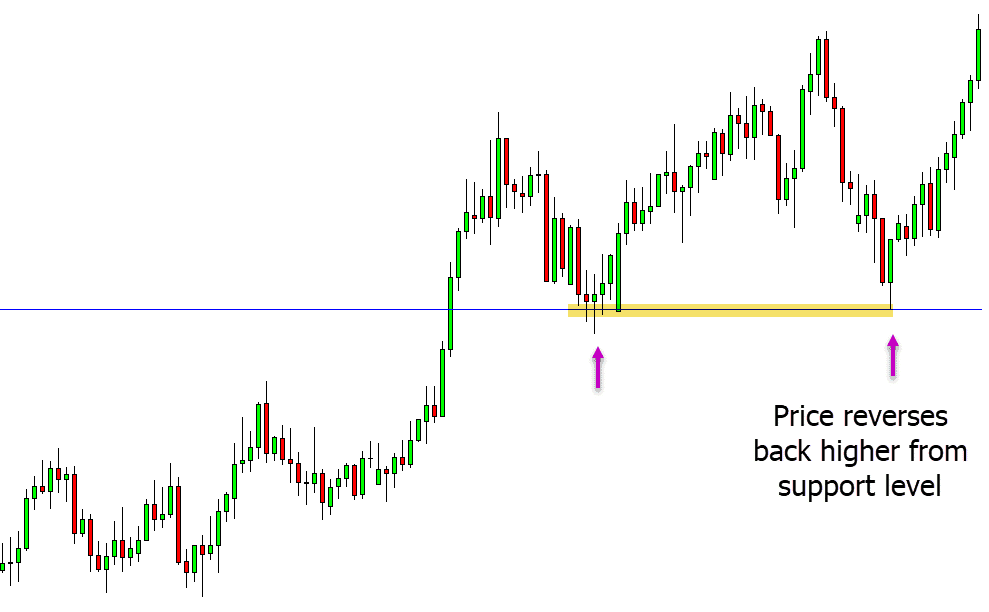
3.2 What is a Reversal?
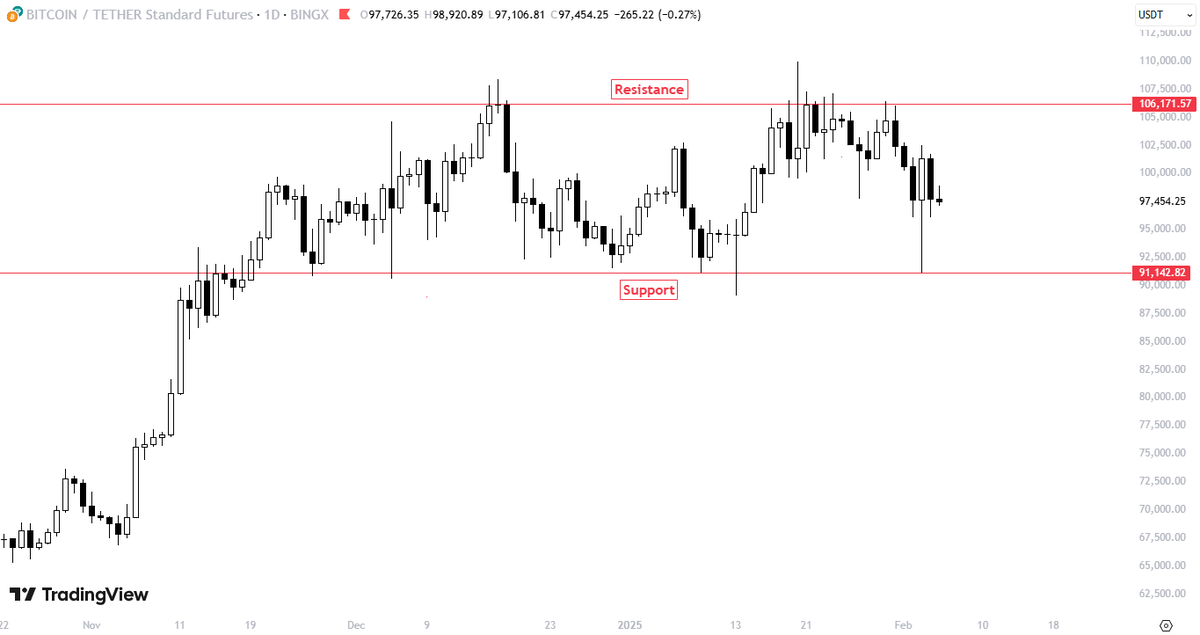
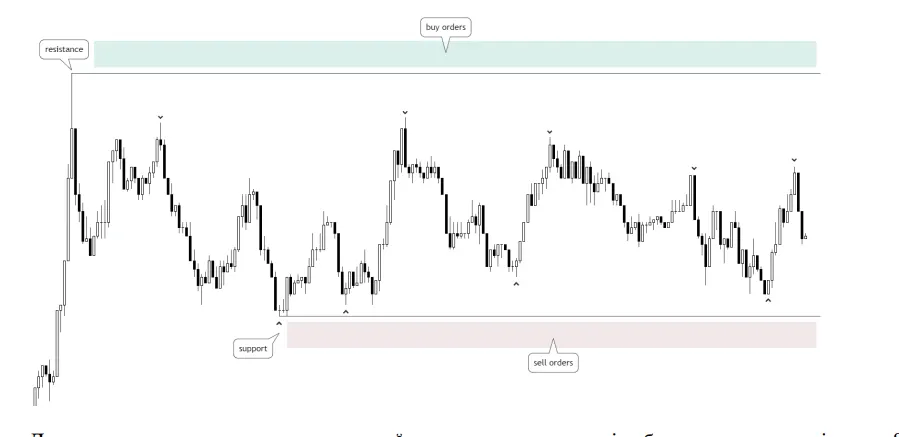
The key when reversal trading is to use the major levels as a guide.
If there is any clear momentum to trade with it and not against it.
When the price moves back lower into a clear support area, we could look to make long trades.
The key when reversal trading is to use the major levels as a guide.
If there is any clear momentum to trade with it and not against it.
When the price moves back lower into a clear support area, we could look to make long trades.
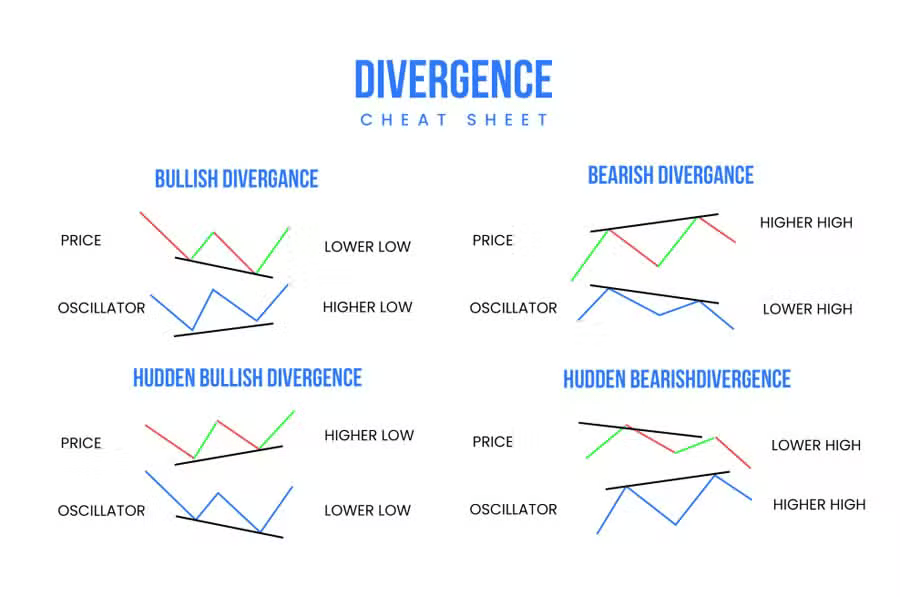
3.3 What is a Reversal?
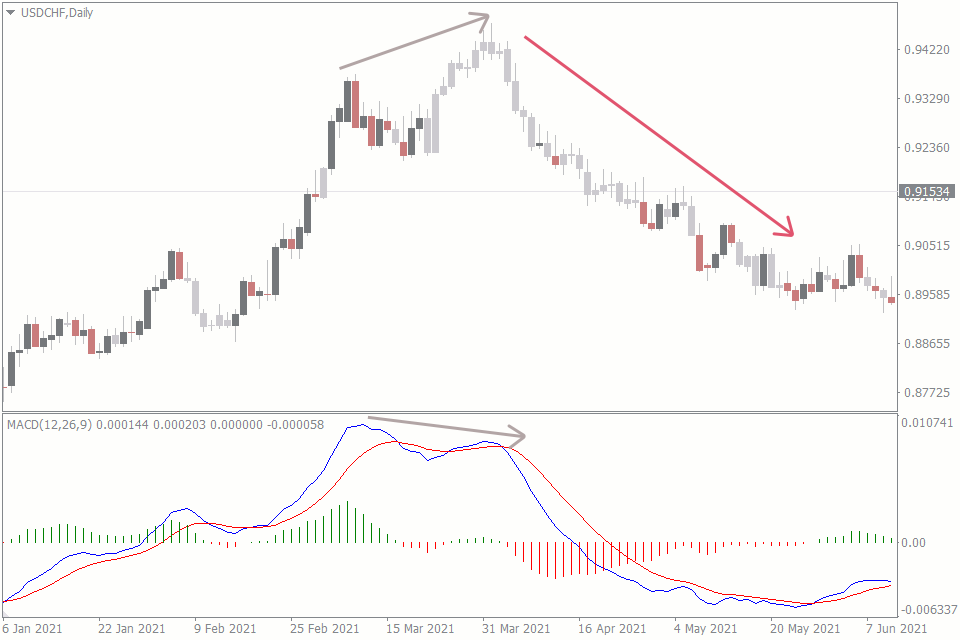
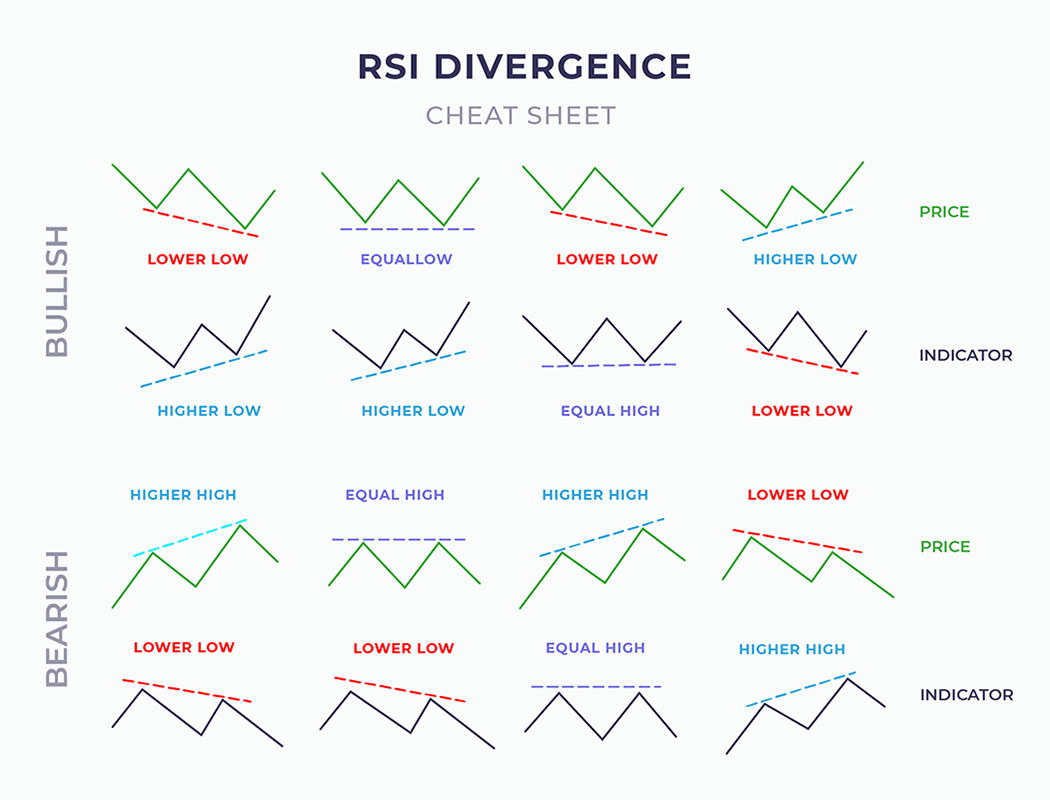
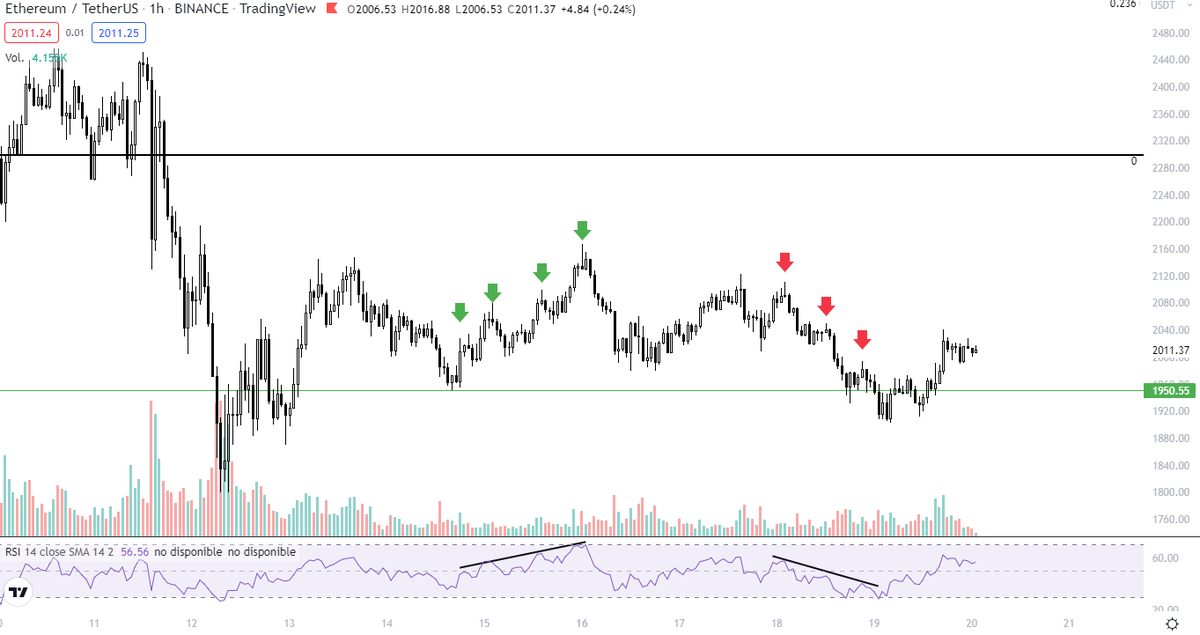
Divergence Trading occurs when the price is making new Highs or Lows, but the oscillator (RSI) fails to mirror this movement.
Signaling that the trend is losing momentum and a reversal could be imminent.
Divergence Trading occurs when the price is making new Highs or Lows, but the oscillator (RSI) fails to mirror this movement.
Signaling that the trend is losing momentum and a reversal could be imminent.
• • •
Missing some Tweet in this thread? You can try to
force a refresh