Principal Component Analysis (PCA) is the gold standard in dimensionality reduction.
But almost every beginner struggles understanding how it works (and why to use it).
In 3 minutes, I'll demolish your confusion:
But almost every beginner struggles understanding how it works (and why to use it).
In 3 minutes, I'll demolish your confusion:

1. What is PCA?
PCA is a statistical technique used in data analysis, mainly for dimensionality reduction. It's beneficial when dealing with large datasets with many variables, and it helps simplify the data's complexity while retaining as much variability as possible.
PCA is a statistical technique used in data analysis, mainly for dimensionality reduction. It's beneficial when dealing with large datasets with many variables, and it helps simplify the data's complexity while retaining as much variability as possible.

2. How PCA Works:
PCA has 5 steps; Standardization, Covariance Matrix Computation, Eigen Vector Calculation, Choosing Principal Components, and Transforming the data.
PCA has 5 steps; Standardization, Covariance Matrix Computation, Eigen Vector Calculation, Choosing Principal Components, and Transforming the data.
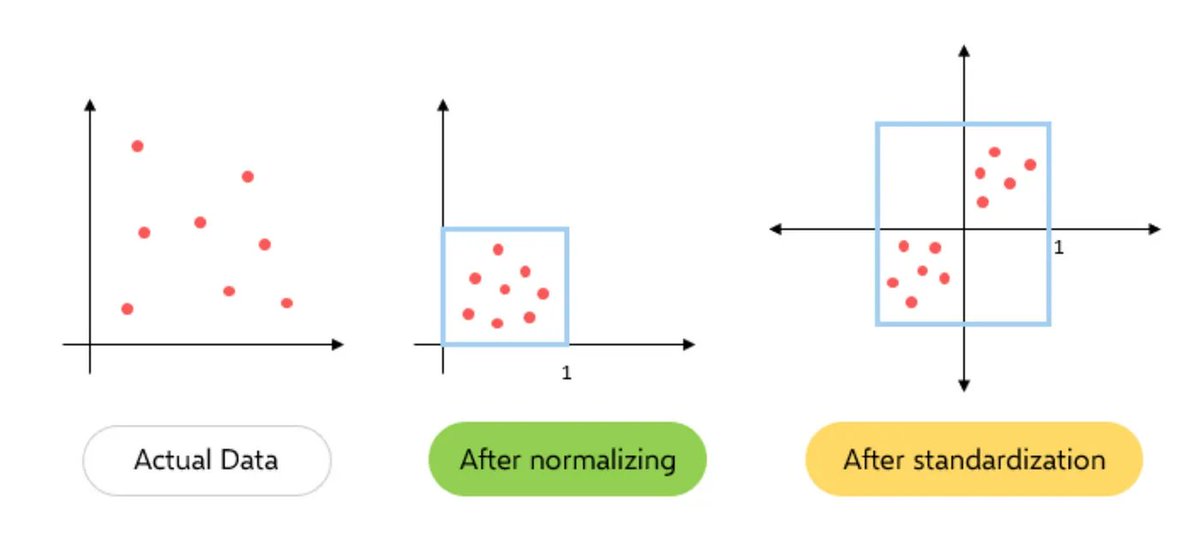
3. Standardization:
The first step in PCA is to standardize the data. Since the scale of the data influences PCA, standardizing the data (giving it mean of 0 and variance of 1) ensures that the analysis is not biased towards variables with greater magnitude.
The first step in PCA is to standardize the data. Since the scale of the data influences PCA, standardizing the data (giving it mean of 0 and variance of 1) ensures that the analysis is not biased towards variables with greater magnitude.
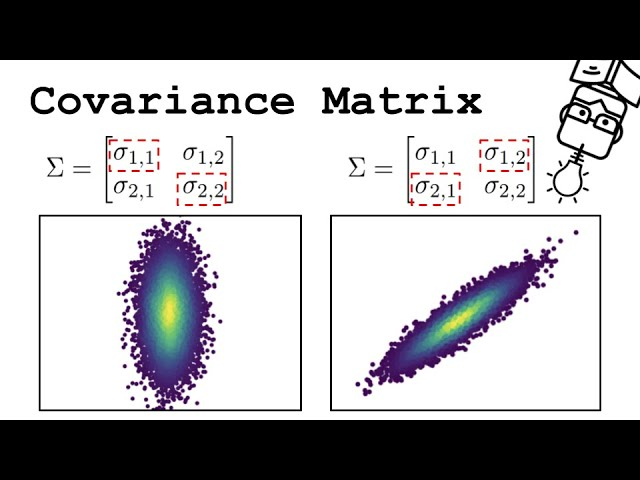
4. Covariance Matrix Computation:
PCA looks at the variance and the covariance of the data. Variance is a measure of the variability of a single feature, and covariance is a measure of how much two features change together. The covariance matrix is a table where each element represents the covariance between two features.
PCA looks at the variance and the covariance of the data. Variance is a measure of the variability of a single feature, and covariance is a measure of how much two features change together. The covariance matrix is a table where each element represents the covariance between two features.
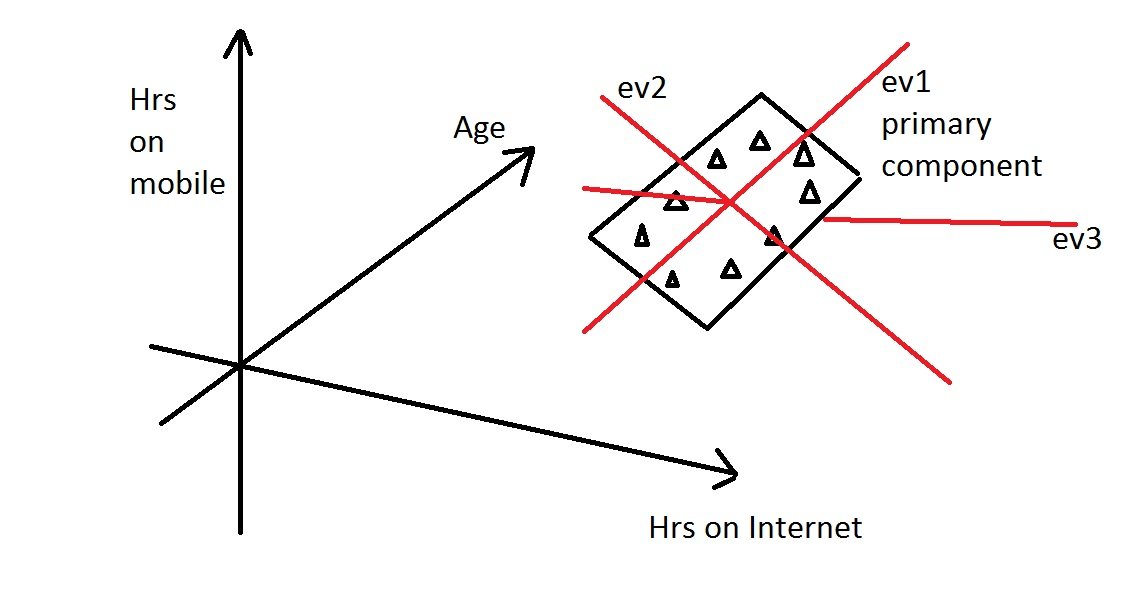
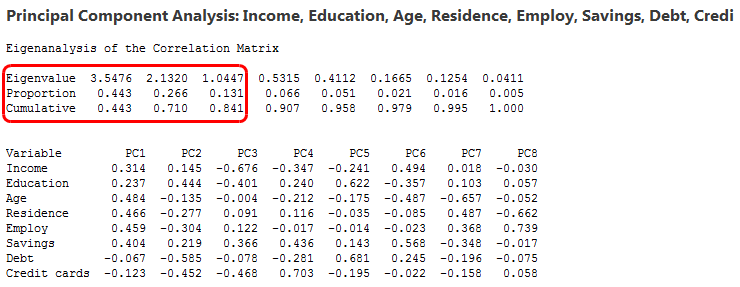
5. Eigenvalue and Eigenvector Calculation:
From the covariance matrix, eigenvalues and eigenvectors are calculated. Eigenvectors are the directions of the axes where there is the most variance (i.e., the principal components), and eigenvalues are coefficients attached to eigenvectors that give the amount of variance carried in each Principal Component.
From the covariance matrix, eigenvalues and eigenvectors are calculated. Eigenvectors are the directions of the axes where there is the most variance (i.e., the principal components), and eigenvalues are coefficients attached to eigenvectors that give the amount of variance carried in each Principal Component.
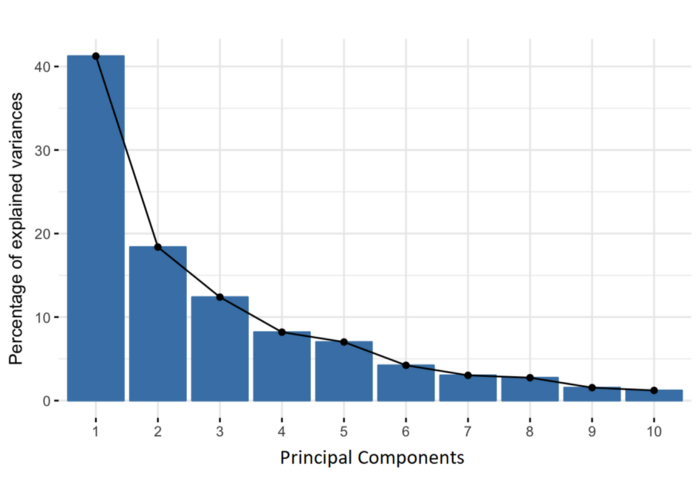
6. Principal Components:
The eigenvectors are sorted by their eigenvalues in descending order. This gives the components in order of significance. Here, you decide how many principal components to keep. This is often based on the cumulative explained variance ratio, which is the amount of variance explained by each of the selected components.
The eigenvectors are sorted by their eigenvalues in descending order. This gives the components in order of significance. Here, you decide how many principal components to keep. This is often based on the cumulative explained variance ratio, which is the amount of variance explained by each of the selected components.
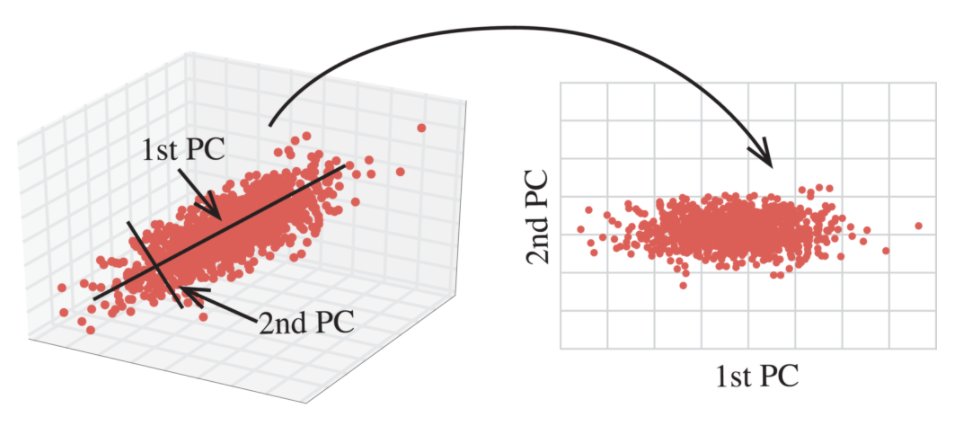
7. Transforming Data:
Finally, the original data is projected onto the principal components (eigenvectors) to transform the data into a new space. This results in a new dataset where the variables are uncorrelated and where the first few variables retain most of the variability of the original data.
Finally, the original data is projected onto the principal components (eigenvectors) to transform the data into a new space. This results in a new dataset where the variables are uncorrelated and where the first few variables retain most of the variability of the original data.
8. Evaluation:
Each PCA component accounts for a certain amount of the total variance in a dataset. The cumulative proportion of variance explained is just the cumulative sum of each PCA's variance explained. Often this is plotted on a Scree plot with Top N PCA components.
Each PCA component accounts for a certain amount of the total variance in a dataset. The cumulative proportion of variance explained is just the cumulative sum of each PCA's variance explained. Often this is plotted on a Scree plot with Top N PCA components.
9. EVERY DATA SCIENTIST NEEDS TO LEARN AI IN 2025.
99% of data scientists are overlooking AI.
I want to help.
99% of data scientists are overlooking AI.
I want to help.
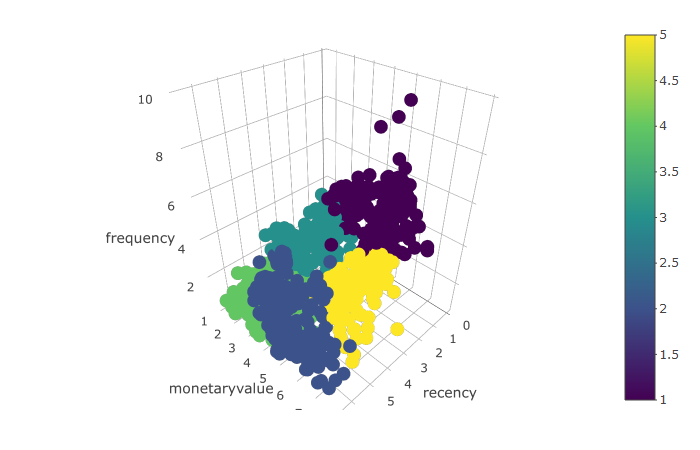
On Wednesday, August 6th, I'm sharing one of my best AI Projects: Customer Segmentation Agent with AI
👉Register here (500 seats): learn.business-science.io/ai-register
👉Register here (500 seats): learn.business-science.io/ai-register
That's a wrap! Over the next 24 days, I'm sharing the 24 concepts that helped me become an AI data scientist.
If you enjoyed this thread:
1. Follow me @mdancho84 for more of these
2. RT the tweet below to share this thread with your audience
If you enjoyed this thread:
1. Follow me @mdancho84 for more of these
2. RT the tweet below to share this thread with your audience
https://twitter.com/815555071517872128/status/1952752807120962027
• • •
Missing some Tweet in this thread? You can try to
force a refresh