Nick Gerli Profile picture
Aug 6 8 tweets 3 min read Read on X
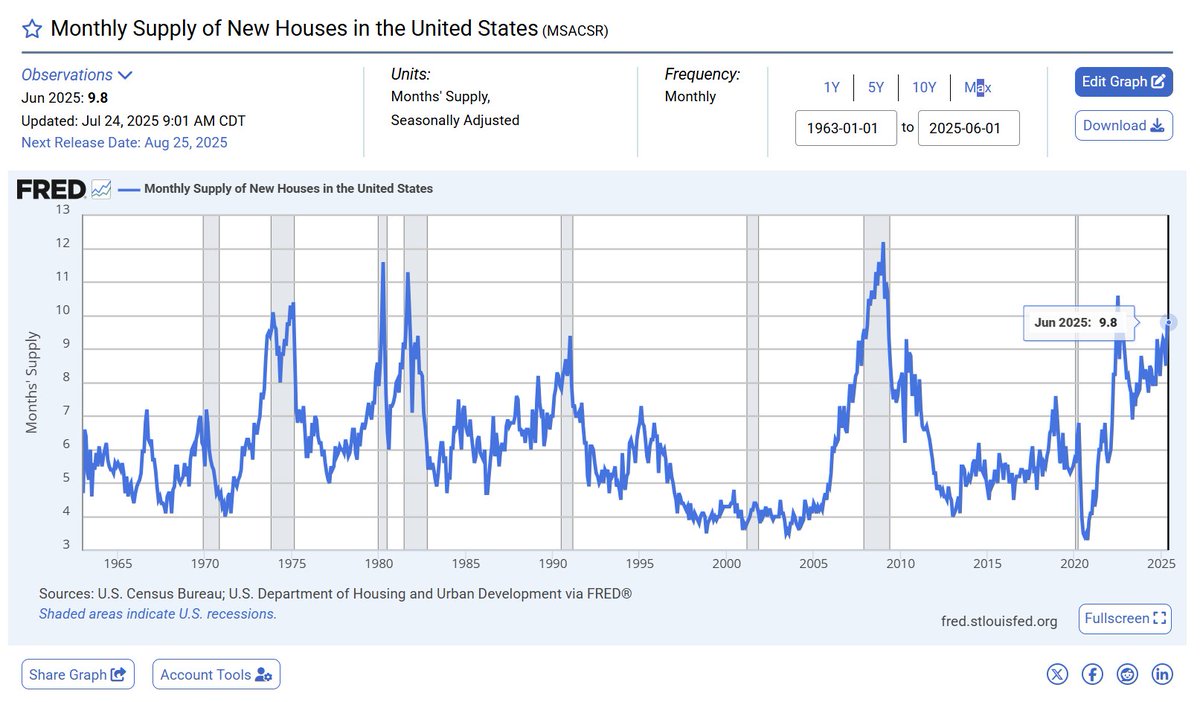
Dallas housing supply is through the roof.

Active listings measured almost 32,000 in July 2025.

The average for July going back to 2017 is only 20,000.

60% more inventory than normal. Image
1) The inventory spike is happening pretty much everywhere in DFW.

All major counties are now above a 50% inventory surplus. Image
2) Great news for DFW homebuyers.

There's the most selection the market has had since the tail end of the last downturn in 2011-12.

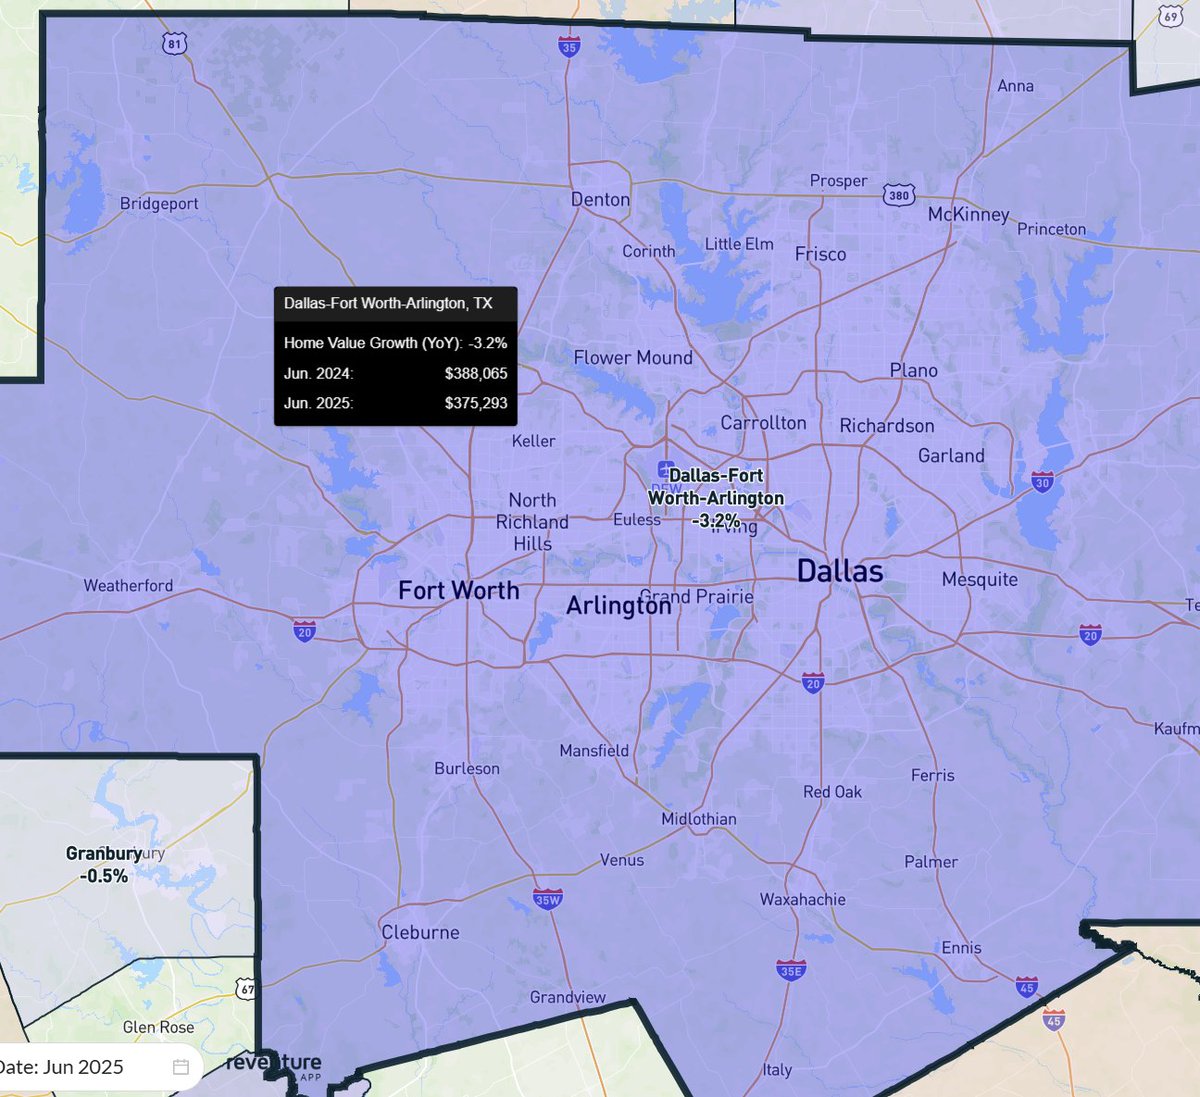
Meanwhile, values are now going down on a year-over-year basis.
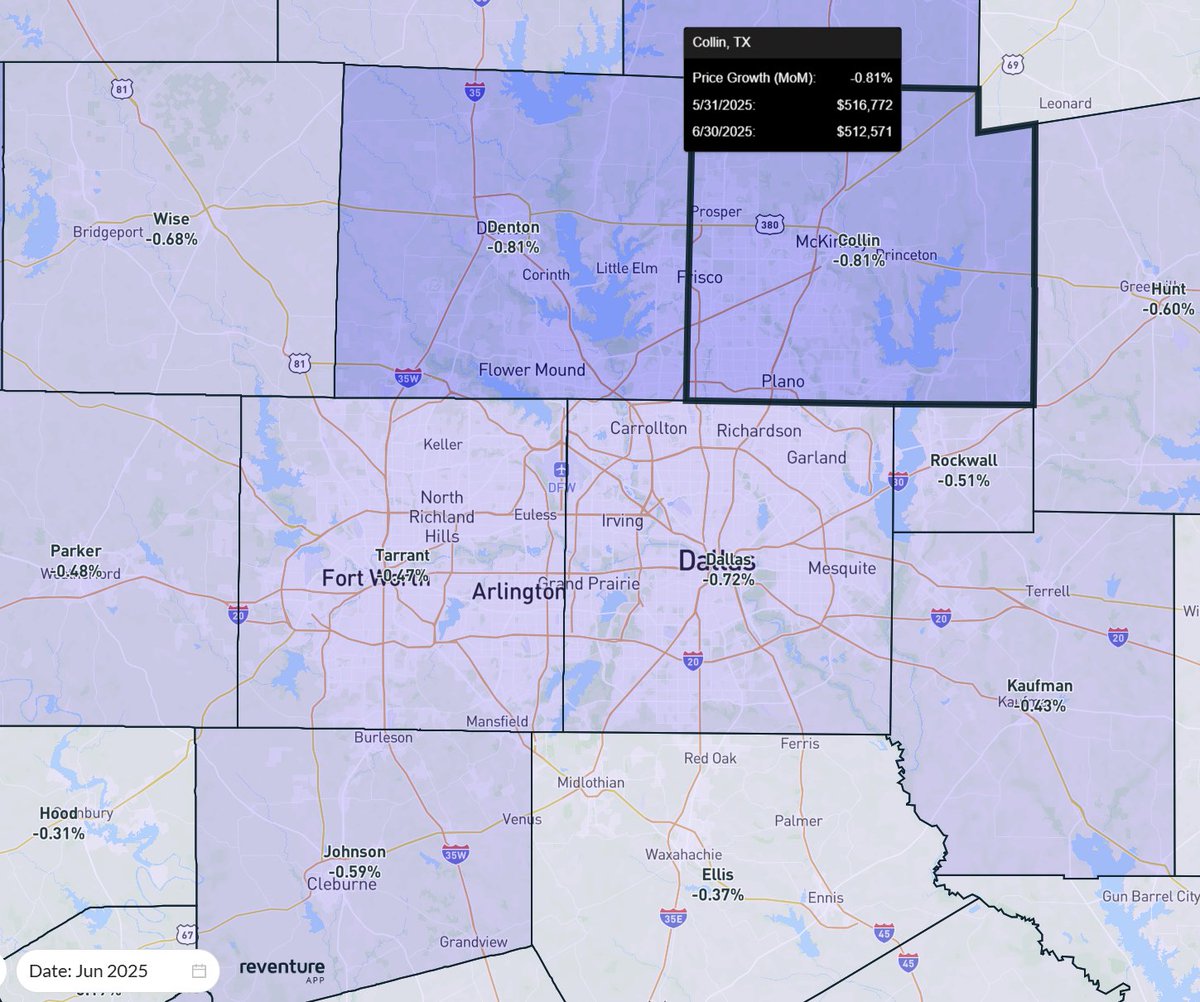
3) Values in the entire metro are down -3.2% YoY according to Zillow's value estimate. Image
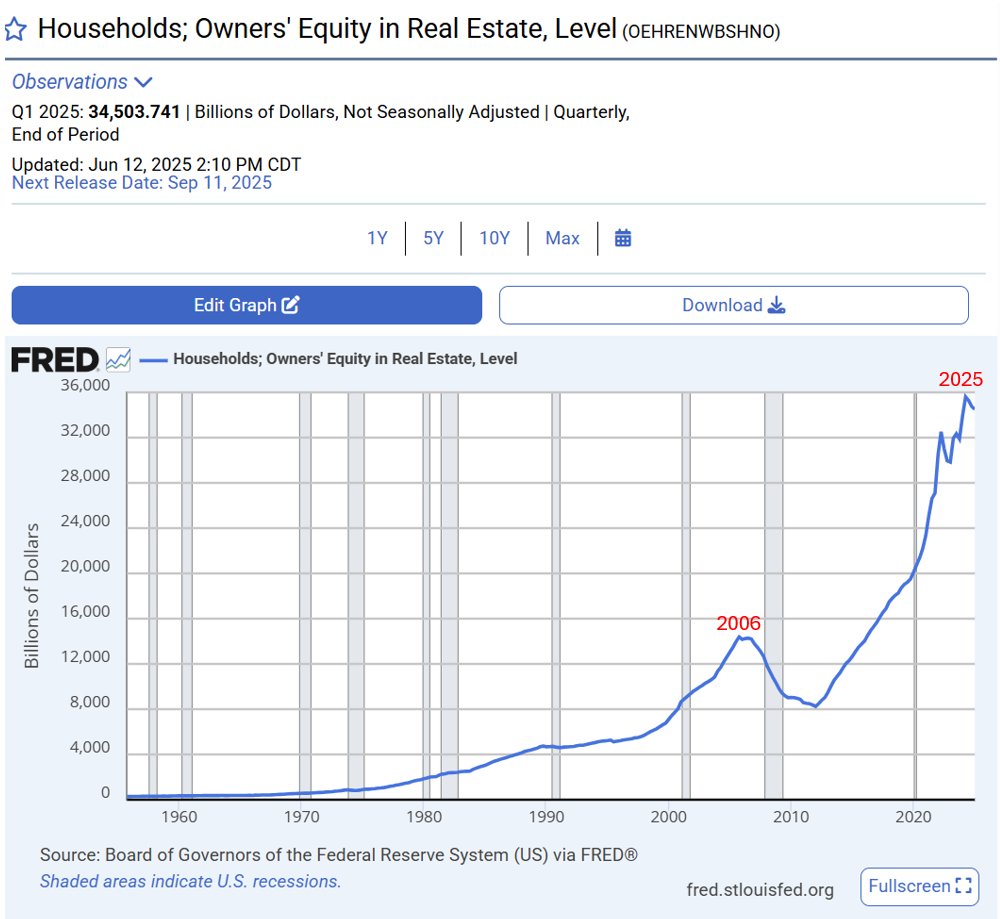
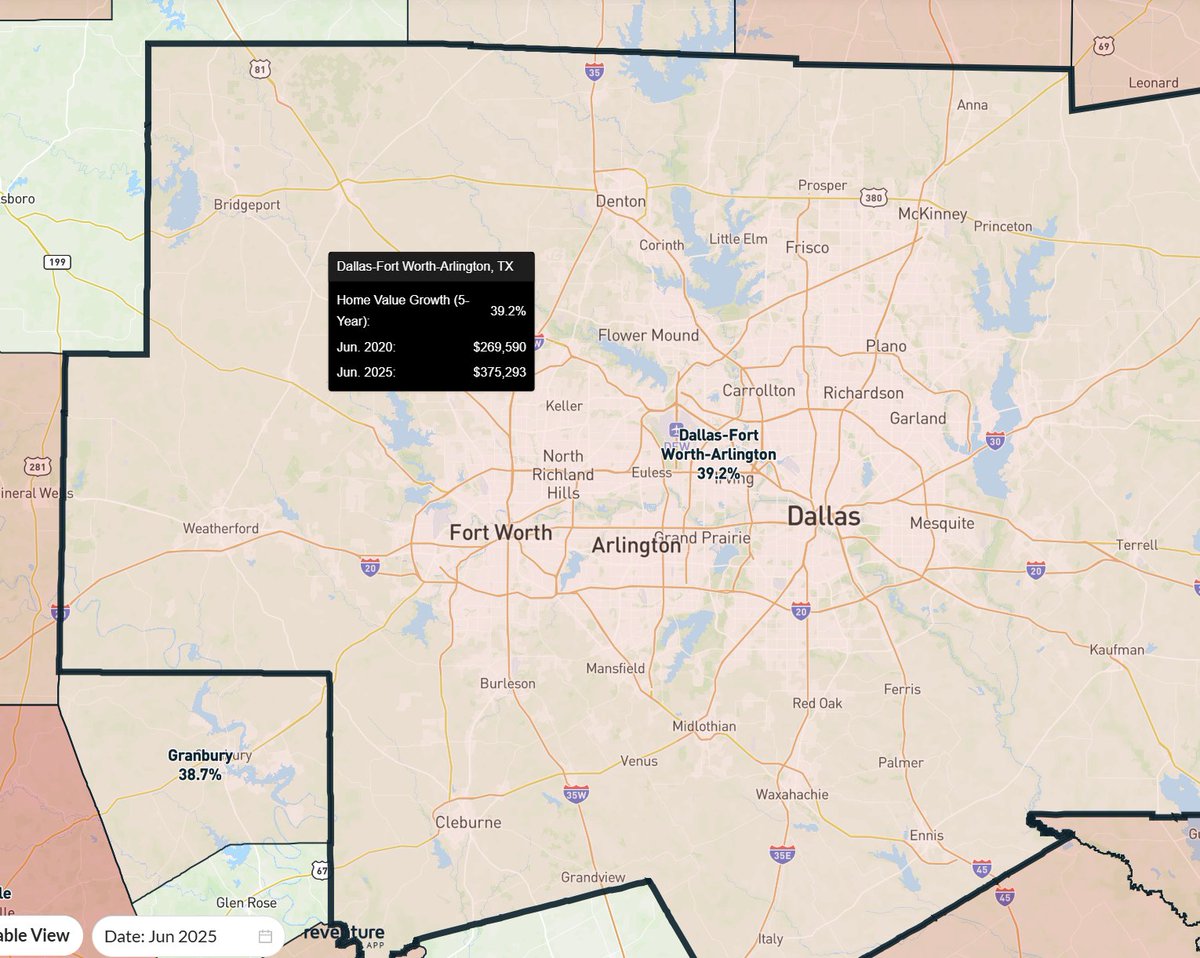
4) But they're still up 39% over the last 5 years. So still feels expensive. Image
5) Biggest monthly drops are happening in Collin and Denton counties to north.

-0.81% MoM. Image
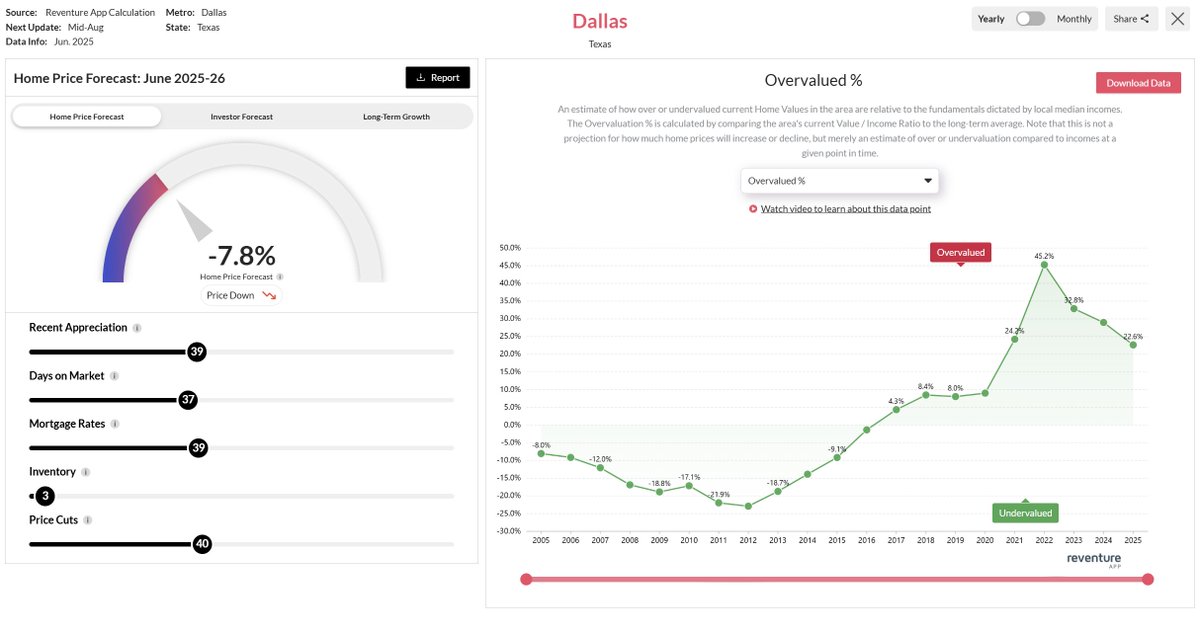
6) We're forecasting a -7.8% drop in DFW over the next 12 months.

Market is still pretty overvalued at 22%. But improving.

Wouldn't be surprised if we see prices drop for a couple years before market bottoms out. Image
7) Access the ZIP code-specific forecasts at under a premium plan.

Currently the premium plan costs $39/month.

On August 18th, it will increase to $49/month.

Lock in your subscription now to get the lower pricing.reventure.app

• • •

Missing some Tweet in this thread? You can try to force a refresh
 

Keep Current with Nick Gerli

Nick Gerli Profile picture

Stay in touch and get notified when new unrolls are available from this author!

Read all threads

This Thread may be Removed Anytime!

PDF

Twitter may remove this content at anytime! Save it as PDF for later use!

Try unrolling a thread yourself!

how to unroll video
  1. Follow @ThreadReaderApp to mention us!

  2. From a Twitter thread mention us with a keyword "unroll"
@threadreaderapp unroll

Practice here first or read more on our help page!

More from @nickgerli1

Aug 3
The biggest problem in today's housing market is not mortgage rates.

Rather - it's homeowners clutching onto an unsustainable amount of homeowner equity.

Today, homeowners have over $34 trillion in equity on their houses - more than 2x higher than the 2006 bubble.

It's the biggest homeowner equity bubble ever. And it's keeping hard-working Americans locked out from buying a house (because prices are too high).

Sellers who come to market today are often refusing to cut the price to the market-clearing price, and even de-listing their homes. This is further perpetuating the worst housing affordability crisis we've seen in 40 years.

The solution: home prices need to correct, by around 15-20% on a national basis, to bring the market back into balance with homebuyer incomes and interest rates. This type of correction will not be that damaging to the economy, since most homeowners would still have plenty of equity. (in this scenario, homeowner equity would drop to around $25 trillion - still almost double 2006).

It's important that lenders, realtors, investors, and government officials understand that unsustainable prices and homeowner equity levels are what is creating the worst home sales transaction market in decades.

Not mortgage rates.Image
1) For perspective, today's homeowner equity levels are north of 115% of GDP, the highest level of all-time.

Indicating that home prices and equity growth have far outstripped the growth of the economy, incomes, and inflation.

It's not sustainable, and needs to correct. Image
2) There's a whole host of reasons why this happened, the most obvious being Fed manipulation of the interest rate cycle over the last 20+ years.

Starting with the Fed Chair in 2001, the Fed became overly accommodative, lowering interest rates well below the rate of inflation.

This resulted in excess home price appreciation.
Read 15 tweets
Jul 31
Nashville's housing market was previously one of the biggest boom markets.

Now it has one of the biggest gluts of unsold inventory of any metro.

With nearly 11,000 homes for sale, the highest level in almost 10 years.

Nashville's inventory surplus is now at 62.7% above the long-term average. Indicative of a market that is in correction.Image
1) Home values in Nashville dropped -0.18% in June 2025 every month.

And the year-over-year value metrics in Nashville are now essentially flat, at +0.1% June 2024-25.

At Reventure, we are forecasting a -7.2% over the next 12 months.
2) The true story in Nashville is a normalization in demand to go along with a pandemic boomerang effect that is resulting in quite a people who moved to the city during the pandemic now selling their houses.

Of course - there is also a lot of new construction, of both houses and apartments, that is putting downward pressure on the market.
Read 13 tweets
Jul 28
Inventory in Nashville is through the roof.

Some neighborhoods now have 115% more supply than normal.

This excess supply is largely coming from investors selling, combined with a reduction in buyer demand.

Don't be surprised if home values across most of Nashville flip negative over the next 12 months.

Access the inventory map at reventure.app.Image
1) The supply run-up in some of these ZIP codes is wild.

Pre-pandemic inventory of 100 homes.

Now there's 300 homes. Image
2) Values are starting to to drop on a month-over-month basis, and are even negative in about half of Nashville ZIPs on a YoY basis.

However, there's huge bifurcation in how the market is trending.
Read 9 tweets
Jul 24
Home builders have 9.8 months of supply on their lots.

Has only happened 6 other times in U.S. history.

5 times it led to a recession. Image
1) Long-term median Months of Supply is around 5.8 months.

Meaning today's home building market is 70% more oversupplied than normal.
2) Months of Supply takes the number of homes builders have for sale, and divides by monthly sales volume, giving a relative indicator of demand.

The data is sourced from the U.S. Census Bureau, which has been tracking builder Months of Supply for over 60 years, making it one of the most consistent and reliable indicators of home building activity.
Read 11 tweets
Jul 23
U.S. homeowners have $34 trillion in equity.

That's almost triple the levels in the 2006 bubble.

As a % of GDP, it's the most housing wealth homeowners in the U.S. have ever had. Image
1) This record equity is a negative for the U.S. Housing Market.

It means sellers are holding onto an inordinate amount of housing wealth, locking prospective buyers out of the market.
2) The true "market-clearing" prices for houses are way below what current sellers are asking.

Which is why homebuyer demand is in the basement.

And home sales are at the lowest level in 30 years.
Read 11 tweets
Jul 22
Home prices in the U.S. are 16.5% overvalued in 2025.

This is a higher level of overvaluation than what we saw at the heights of the 2006 bubble.

After that last bubble, prices became undervalued, and the period from 2008-2019 was a great time to buy a house.

However, today the market has become too expensive, with home prices outpacing wage growth.

The result is an overvalued and unaffordable market.

This is the main reason why homebuyer demand is so low in 2025. Fix the overvaluation, fix the homebuyer demand problem.Image
1) This overvaluation data is based on the relationship of Home Values and Incomes in the U.S. Housing Market.

Home prices during the pandemic went up way faster than incomes, pricing out homebuyers, and resulting in the highest overvaluation we've seen in decades.
2) The median household in the U.S. earns around $83,000.

While the annual mortgage payment to buy a house is $33,000.

WIth the resulting payment/income ratio close to 40%.

That's simply too expensive for first-time buyers.
Read 8 tweets

Did Thread Reader help you today?

Support us! We are indie developers!


This site is made by just two indie developers on a laptop doing marketing, support and development! Read more about the story.

Become a Premium Member ($3/month or $30/year) and get exclusive features!

Become Premium

Don't want to be a Premium member but still want to support us?

Make a small donation by buying us coffee ($5) or help with server cost ($10)

Donate via Paypal

Or Donate anonymously using crypto!

Ethereum

0xfe58350B80634f60Fa6Dc149a72b4DFbc17D341E copy

Bitcoin

3ATGMxNzCUFzxpMCHL5sWSt4DVtS8UqXpi copy

Thank you for your support!

Follow Us!

:(