🧠 Why does price have memory?
Because pivots form where institutions choose to do business—again and again.
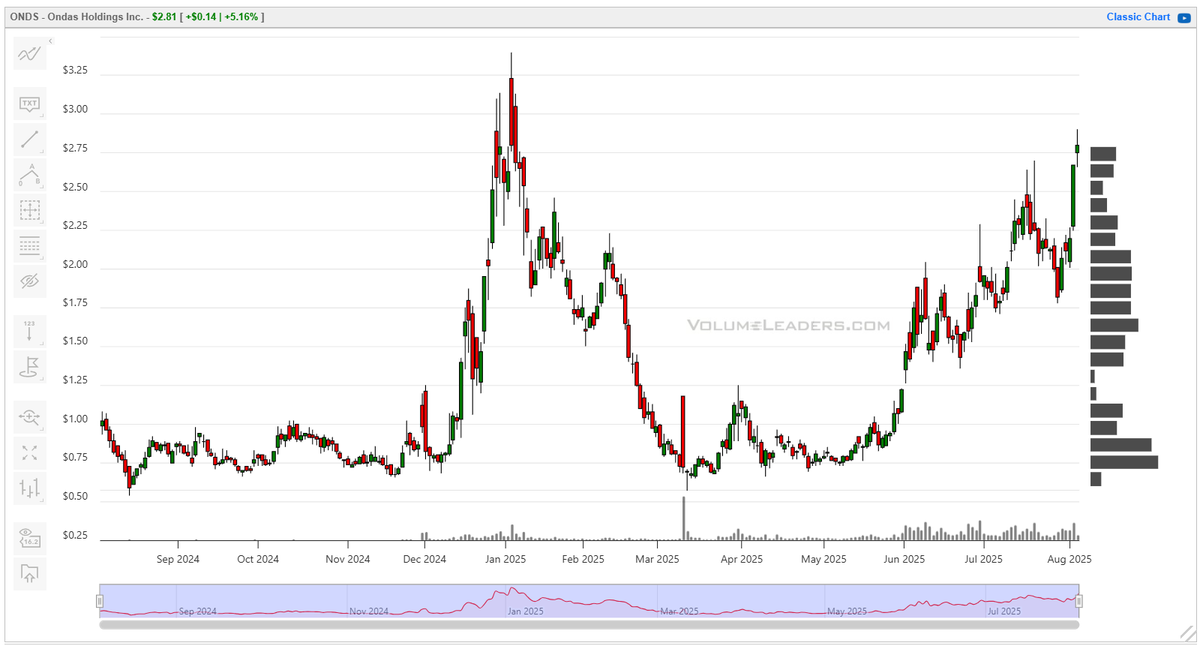
Here’s $SPY over the last 30 days using VolumeLeaders Levels. Notice how each turn aligns with footprints left by institutions.
Let’s walk through them 👇
Because pivots form where institutions choose to do business—again and again.
Here’s $SPY over the last 30 days using VolumeLeaders Levels. Notice how each turn aligns with footprints left by institutions.
Let’s walk through them 👇
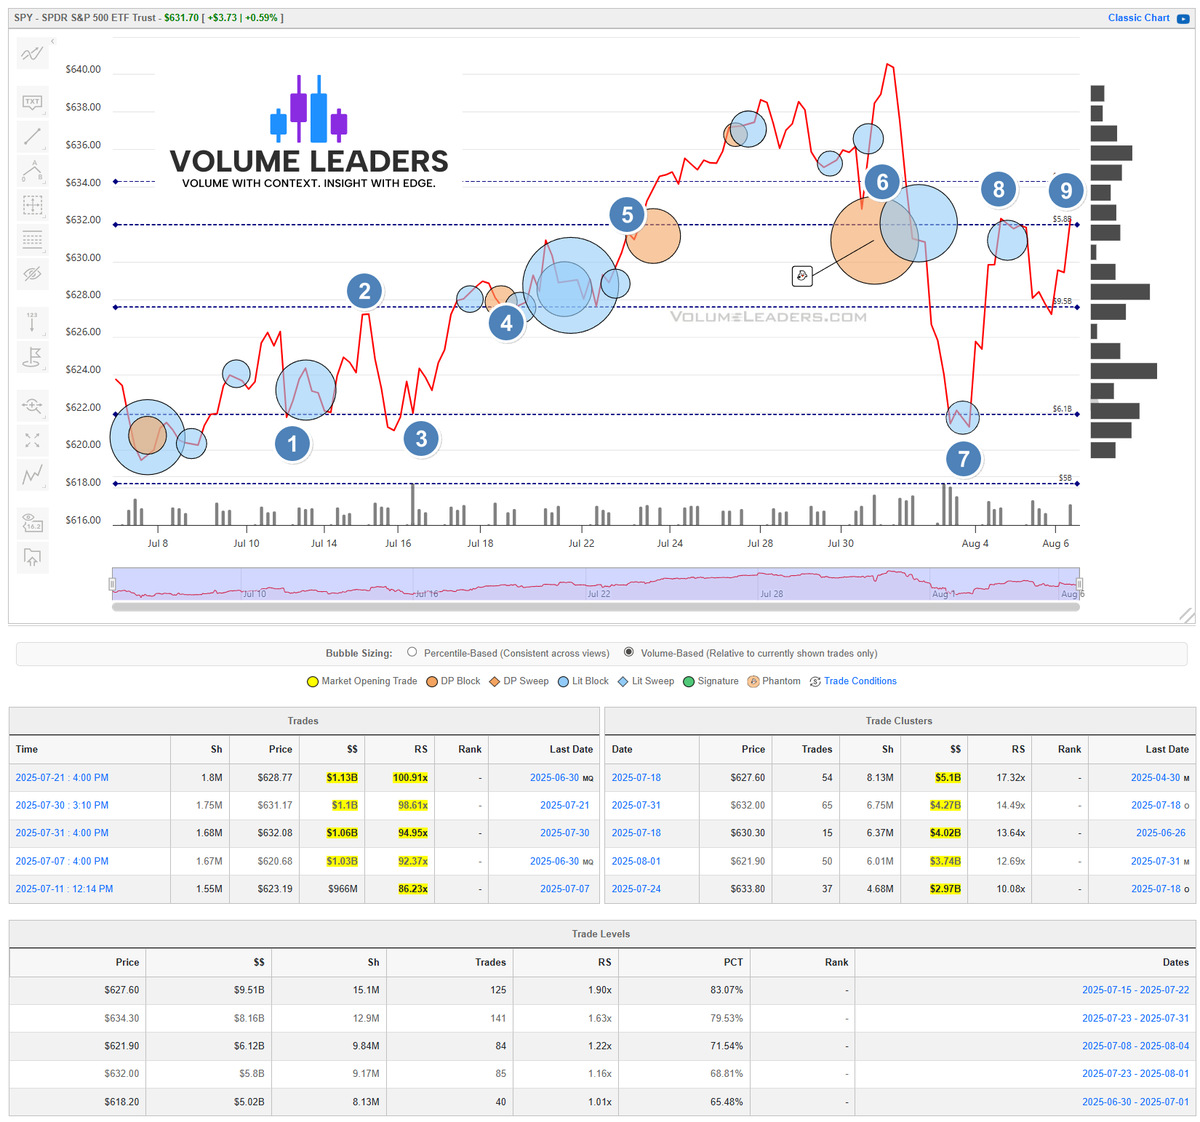
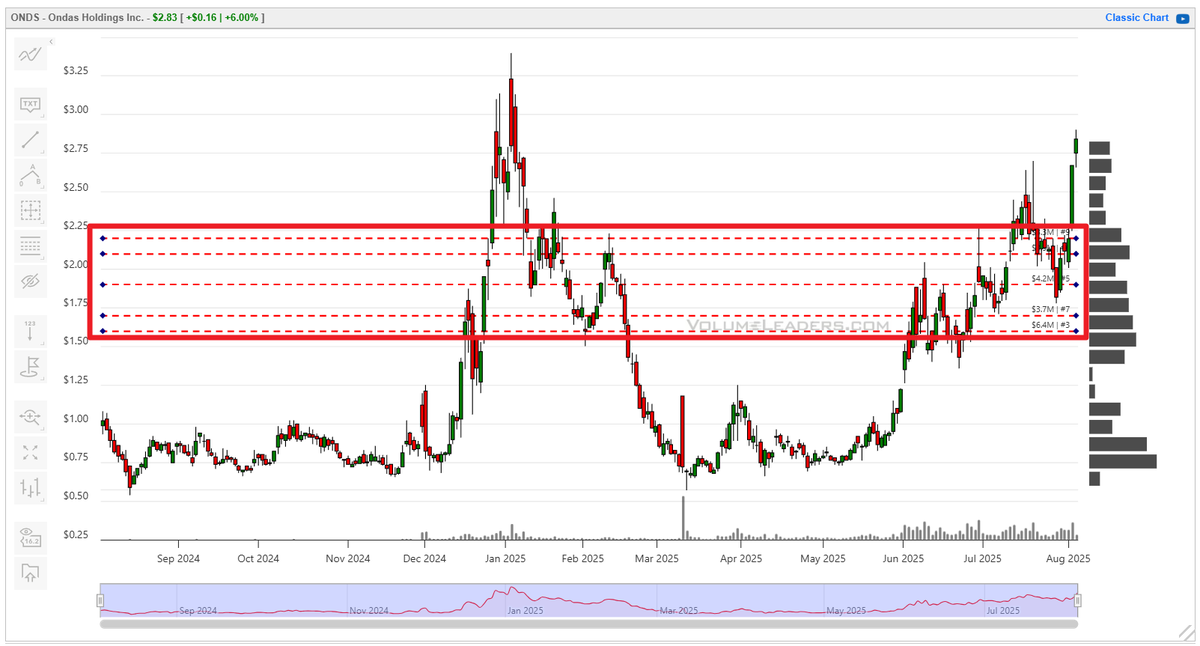
Pivot 1: Institutions load size at the bottom.
•Large clustered trades define the first memory zone
•Price reacts with a clean bounce
•Large clustered trades define the first memory zone
•Price reacts with a clean bounce
Pivot 2: Price approaches the next Level.
•Institutions defend
•Structure: support confirmed
This becomes your reference level for future tests.📏
•Institutions defend
•Structure: support confirmed
This becomes your reference level for future tests.📏
Pivot 3: Pullback into institutional zone.
•Price tags Level
•Bounces in line with prior activity
📌 This is price-memory in action.
•Price tags Level
•Bounces in line with prior activity
📌 This is price-memory in action.
Pivot 4: Reload zone. Institutions active again.
Pivot 5: Breakout push forms new upper reference.
•Institutions are campaigning—adding size without chasing price.
Pivot 5: Breakout push forms new upper reference.
•Institutions are campaigning—adding size without chasing price.
Pivot 6: Institutions defend upper Levels again.
•Notice how price pivots exactly where the big trades clustered.
•Notice how price pivots exactly where the big trades clustered.
Pivot 7: Sharp drop into lower Level.
•Institutions show up.
•Bounce aligns with previous pivot zone.
•Price “remembers” because money remembers. 💸
•Institutions show up.
•Bounce aligns with previous pivot zone.
•Price “remembers” because money remembers. 💸
Pivot 8: Another defense at upper Level.
Pivot(?) 9: Guess where we are today? Institutions active again.
•This repeated behavior is why Levels matter—clear structure for trades with defined risk 😍
Pivot(?) 9: Guess where we are today? Institutions active again.
•This repeated behavior is why Levels matter—clear structure for trades with defined risk 😍
Price has memory because institutions leave footprints.
VolumeLeaders Levels show:
•Where big money is active
•Where pivots are likely to form
•How to frame trades with context & risk
🎯 Arm yourself with the data to decisively navigate thousands of tickers for yourself →
#Trading #Orderflow #OptionsFlow $SPYvolumeleaders.com
VolumeLeaders Levels show:
•Where big money is active
•Where pivots are likely to form
•How to frame trades with context & risk
🎯 Arm yourself with the data to decisively navigate thousands of tickers for yourself →
#Trading #Orderflow #OptionsFlow $SPYvolumeleaders.com
• • •
Missing some Tweet in this thread? You can try to
force a refresh