Tivadar Danka Profile picture
Aug 8 10 tweets 3 min read Read on X
Conditional probability is the single most important concept in statistics.

Why? Because without accounting for prior information, predictive models are useless.

Here is what conditional probability is, and why it is essential: Image
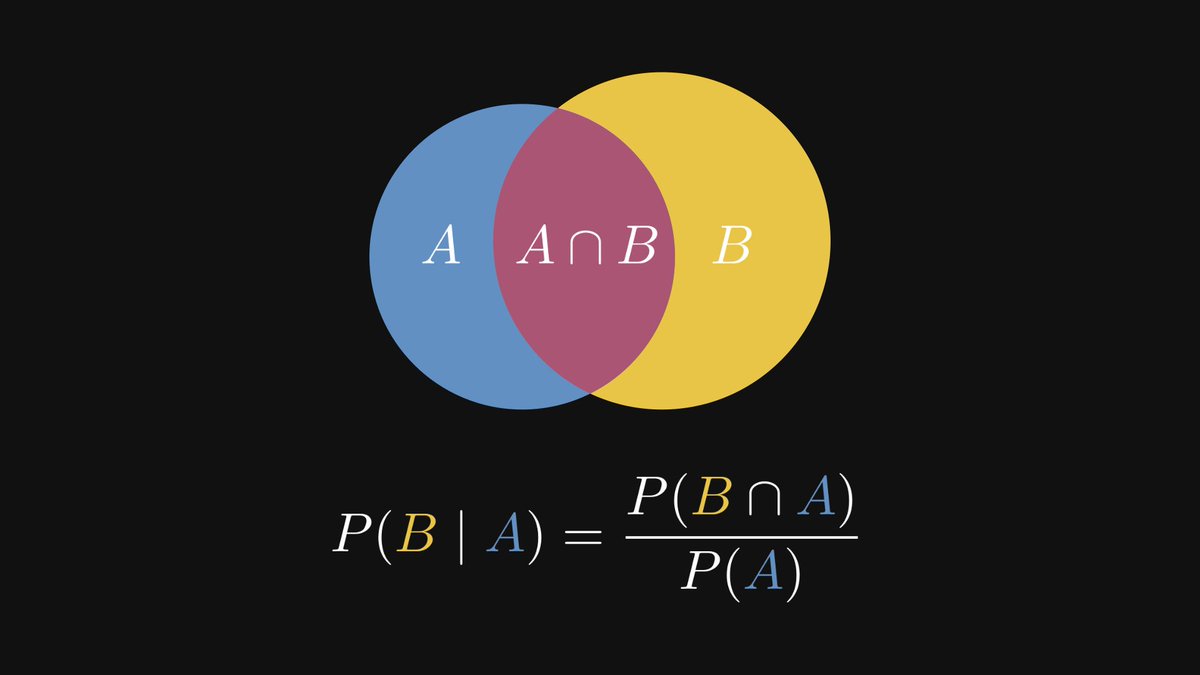
Conditional probability allows us to update our models by incorporating new observations.

By definition, P(B | A) describes the probability of an event B, given that A has occurred. Image
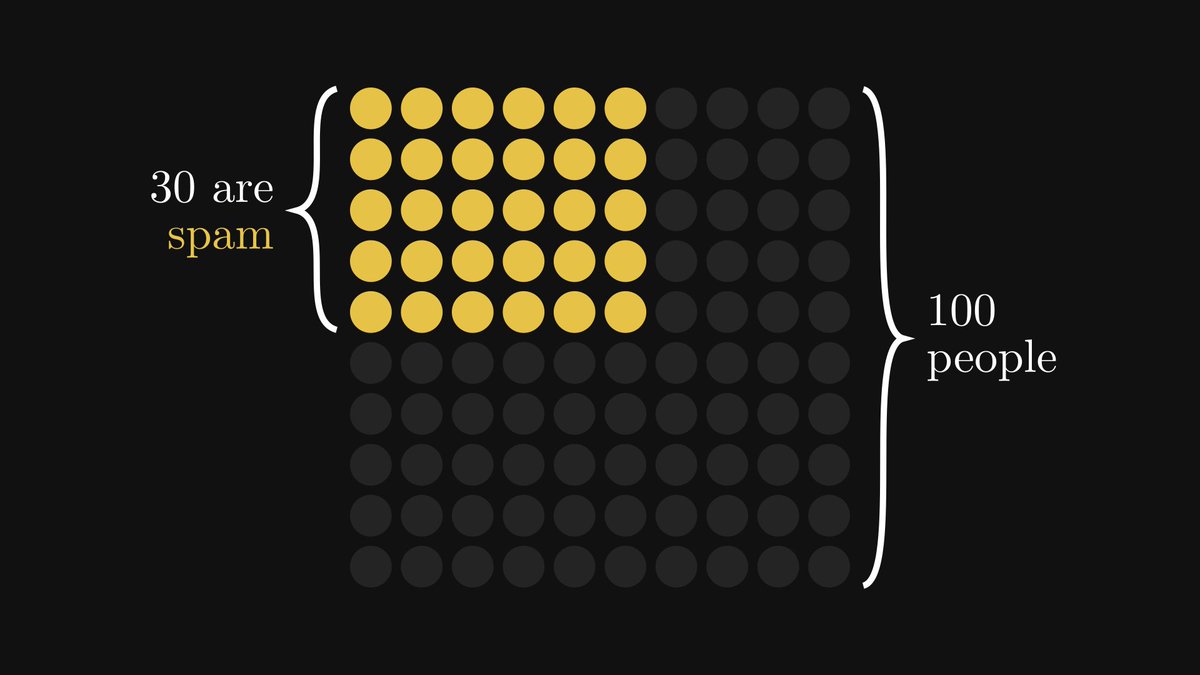
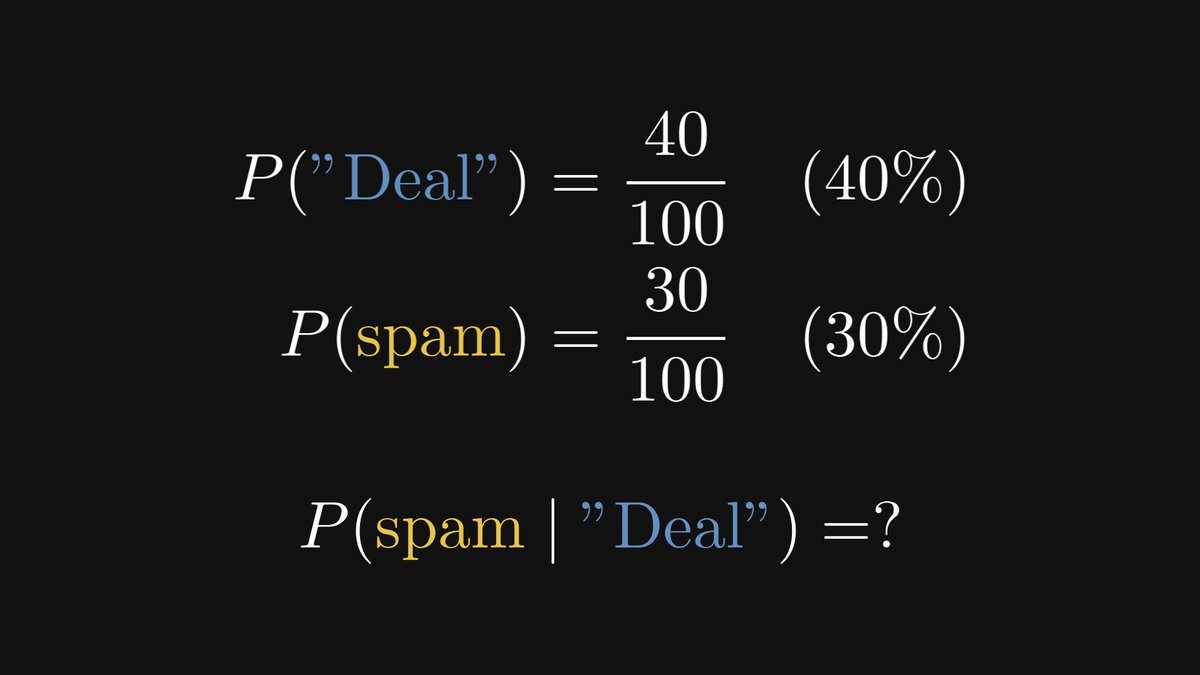
Here is an example. Suppose that among 100 emails, 30 are spam.

Based only on this information, if we inspect a random email, our best guess is a 30% chance of it being spam.

This is not good enough. Image
We can build a better model by looking at more information.

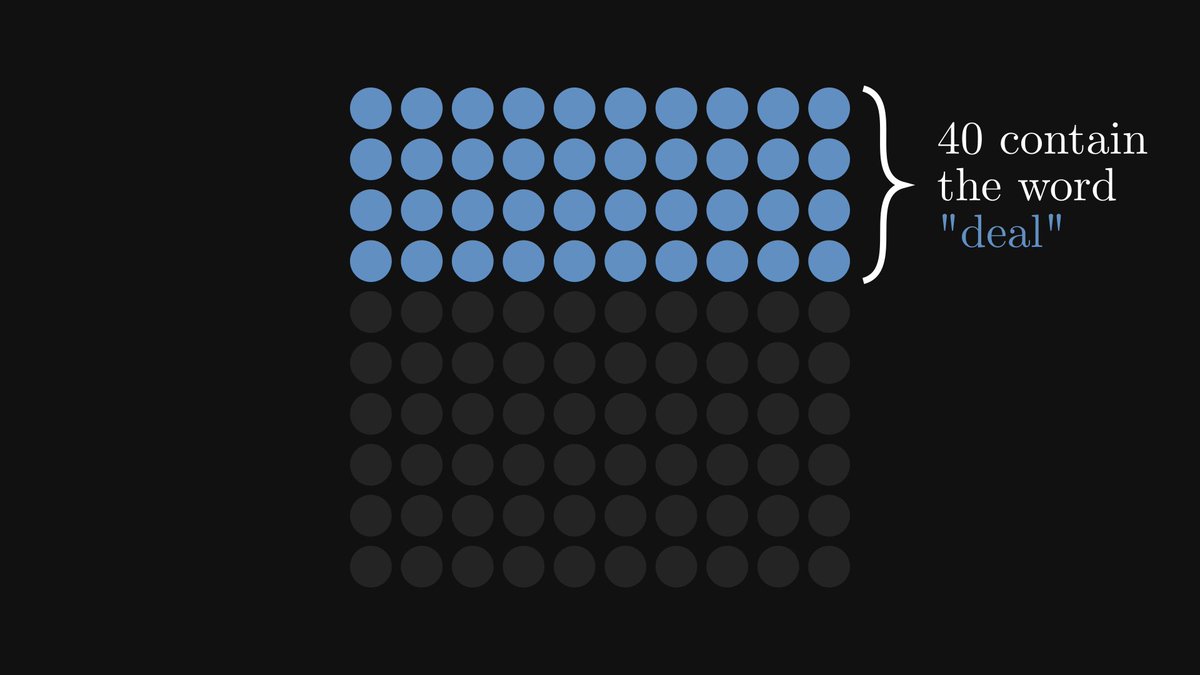
What about looking for certain keywords, like "deal"?

It turns out that among the 100 emails, 40 contain this word. Image
Let's say that an email contains the word "deal".

How does our probabilistic model change?

We can leverage the prior information to get a more precise prediction than the random 30%. Image
By taking a more detailed look, we notice that 24 emails with the word "deal" are spam. Image
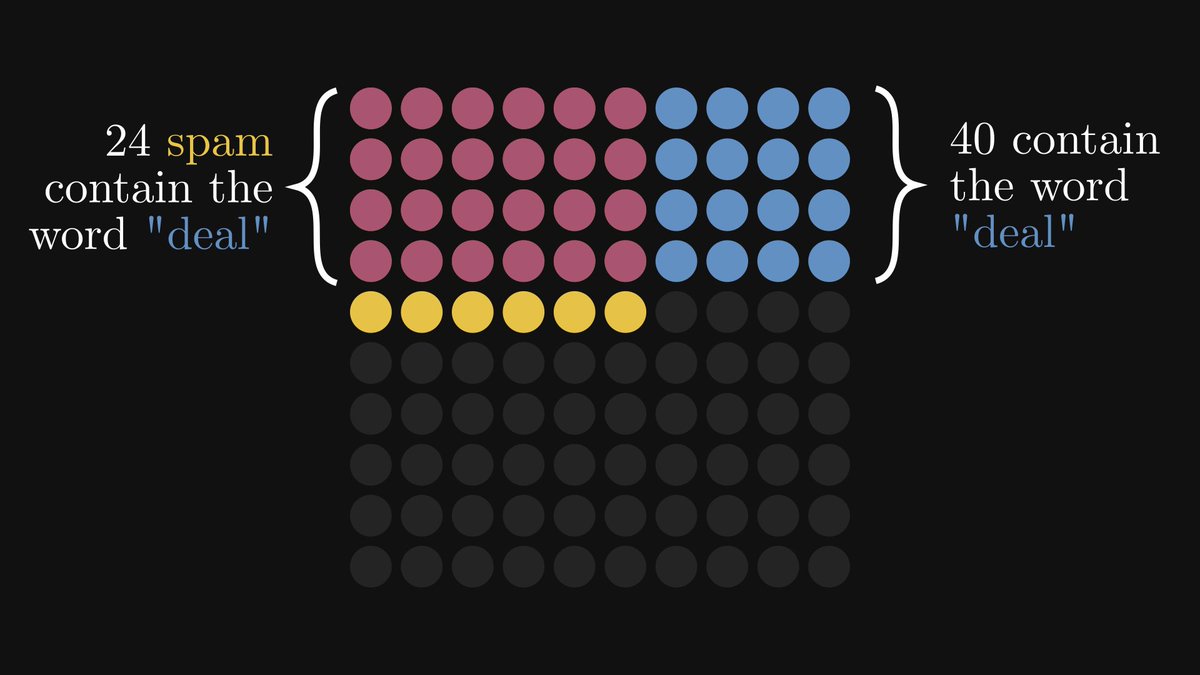
Thus, we can compute the conditional probability by focusing on the mails containing "deal". Image
Using a similar logic, we get that without the expression "deal", the probability of spam drops to 10%!

Quite a difference between our model with no prior information. Image
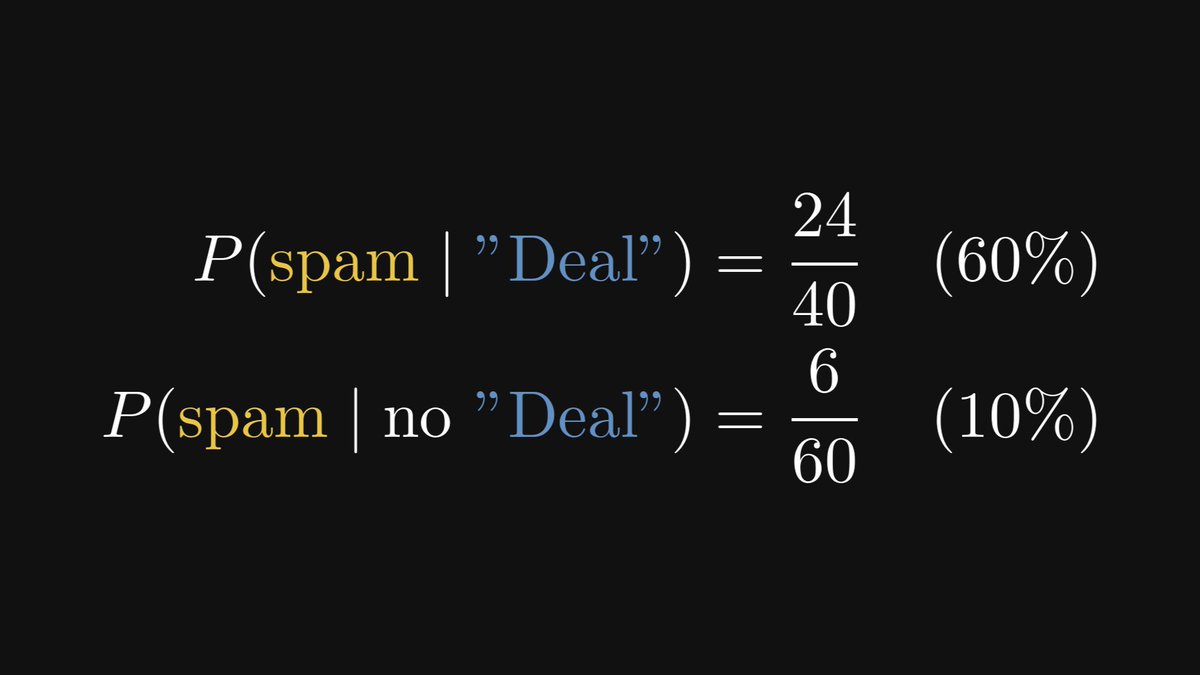
Conditional probability restricts the event space, thus providing a more refined picture.

This gives better models, leading to better decisions.
Join 20,000+ ML practitioners who get 2 actionable emails every week to help them understand the math behind ML, make smarter decisions, and avoid costly mistakes.

Subscribe here (it’s free): thepalindrome.org

• • •

Missing some Tweet in this thread? You can try to force a refresh
 

Keep Current with Tivadar Danka

Tivadar Danka Profile picture

Stay in touch and get notified when new unrolls are available from this author!

Read all threads

This Thread may be Removed Anytime!

PDF

Twitter may remove this content at anytime! Save it as PDF for later use!

Try unrolling a thread yourself!

how to unroll video
  1. Follow @ThreadReaderApp to mention us!

  2. From a Twitter thread mention us with a keyword "unroll"
@threadreaderapp unroll

Practice here first or read more on our help page!

More from @TivadarDanka

Aug 9
Differentiation reveals much more than the slope of the tangent plane.

We like to think about it that way, but from a different angle, differentiation is the same as an approximation with a linear function. This allows us to generalize the concept.

Let's see why: Image
By definition, the derivative of a function at the point 𝑎 is defined by the limit of the difference quotient, representing the rate of change. Image
In geometric terms, the differential quotient represents the slope of the line between two points of the function's graph. Image
Read 12 tweets
Aug 9
Graph theory will seriously enhance your engineering skills.

Here's why you must be familiar with graphs: Image
What do the internet, your brain, the entire list of people you’ve ever met, and the city you live in have in common?

These are all radically different concepts, but they share a common trait.

They are all networks that establish relationships between objects. Image
As distinct as these things seem to be, they share common properties.

For example, the meaning of “distance” is different for

• Social networks
• Physical networks
• Information networks

But in all cases, there is a sense in which some objects are “close” or “far”. Image
Read 14 tweets
Aug 8
I have spent at least 50% of my life studying, practicing, and teaching mathematics.

The most common misconceptions I encounter:

• Mathematics is useless
• You must be good with numbers
• You must be talented to do math

These are all wrong. Here's what math is really about: Image
Let's start with a story.

There’s a reason why the best ideas come during showers or walks. They allow the mind to wander freely, unchained from the restraints of focus.

One particular example is graph theory, born from the regular daily walks of the legendary Leonhard Euler.
Here is the map of Königsberg (now known as Kaliningrad, Russia), where these famous walks took place.

This part of the city is interrupted by several rivers and bridges.

(I cheated a little and drew the bridges that were there in Euler's time, but not now). Image
Read 15 tweets
Aug 7
Neural networks are stunningly powerful.

This is old news: deep learning is state-of-the-art in many fields, like computer vision and natural language processing. (But not everywhere.)

Why are neural networks so effective? I'll explain: Image
First, let's formulate the classical supervised learning task!

Suppose that we have a dataset D, where xₖ is a data point and yₖ is the ground truth. Image
The task is simply to find a function g(x) for which

• g(xₖ) is approximately yₖ,
• and g(x) is computationally feasible.

To achieve this, we fix a parametrized family of functions.

For instance, linear regression uses this function family: Image
Read 18 tweets
Aug 7
Matrix factorizations are the pinnacle results of linear algebra.

From theory to applications, they are behind many theorems, algorithms, and methods. However, it is easy to get lost in the vast jungle of decompositions.

This is how to make sense of them. Image
We are going to study three matrix factorizations:

1. the LU decomposition,
2. the QR decomposition,
3. and the Singular Value Decomposition (SVD).

First, we'll take a look at LU.
1. The LU decomposition.

Let's start at the very beginning: linear equation systems.

Linear equations are surprisingly effective in modeling real-life phenomena: economic processes, biochemical systems, etc. Image
Read 18 tweets
Aug 6
Logistic regression is one of the simplest models in machine learning, and one of the most revealing.

It shows us how to move from geometric intuition to probabilistic reasoning. Mastering it sets the foundation for everything else.

Let’s dissect it step by step! Image
Let’s start with the most basic setup possible: one feature, two classes.

You’re predicting if a student passes or fails based on hours studied.

Your input x is a number, and your output y is either 0 or 1.

Let's build a predictive model! Image
We need a model that outputs values between 0 and 1.

Enter the sigmoid function: σ(ax + b).

If σ(ax + b) > 0.5, we predict pass (1).

Otherwise, fail (0).

It’s a clean way to represent uncertainty with math. Image
Read 15 tweets

Did Thread Reader help you today?

Support us! We are indie developers!


This site is made by just two indie developers on a laptop doing marketing, support and development! Read more about the story.

Become a Premium Member ($3/month or $30/year) and get exclusive features!

Become Premium

Don't want to be a Premium member but still want to support us?

Make a small donation by buying us coffee ($5) or help with server cost ($10)

Donate via Paypal

Or Donate anonymously using crypto!

Ethereum

0xfe58350B80634f60Fa6Dc149a72b4DFbc17D341E copy

Bitcoin

3ATGMxNzCUFzxpMCHL5sWSt4DVtS8UqXpi copy

Thank you for your support!

Follow Us!

:(