Southern wages are a tenth of Northern wages for the same work. Even if labor is siloed behind national borders, why don't terms of trade adjust to equalize the price of equivalent work across countries over time? 1/
This is from the stunning paper by @jasonhickel et al. (2024) in Nature. They show that the Global North appropriates more three-quarters of a trillion hours of work from the Global South every year. 👀 2/
This is a great anomaly. In supplementary info, they mention the explanation offered by Arthur Lewis. 3/
Lewis argued that in economies with a large subsistence sector, wages in the modern sector are not determined by productivity in that sector, but rather by the wage floor set in the subsistence economy. 4/
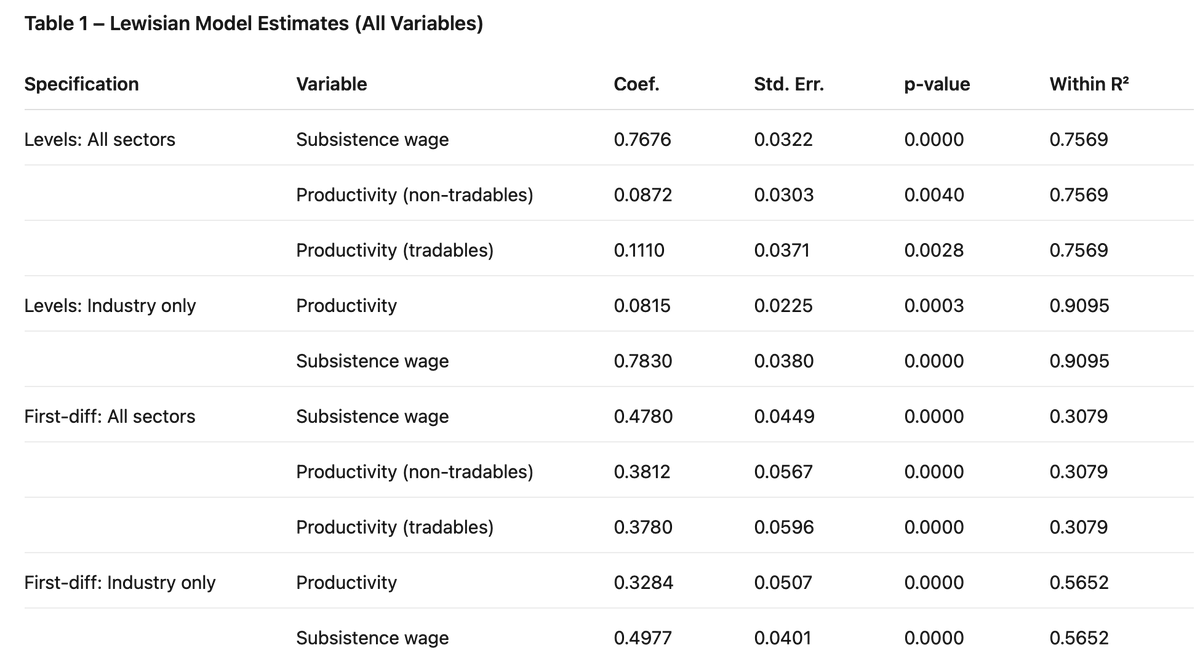
Today dispatch tests this hypothesis. We proxy the subsistence wage by wage level in agriculture. Then we test the prediction that wages track that rather than productivity using a panel dataset. 5/
Across specifications, we find that the Lewisian model survives empirical interrogation. We estimate that 1 sd higher subsistence wage predicts 77% higher wages in other sectors. 6/
The effect is large enough to explain the global pattern of unequal exchange documented by the Nature paper. Link to the dispatch: /7tinyurl.com/87x8chc7
If my analysis is correct, then unequal exchange will continue each country until its entire surplus population is absorbed—ie, hidden underemployment more or less vanishes. 8/
It also has implications for the debate over fertility decline. If my analysis is correct, demographic decline could be especially helpful for poor countries trapped by the Lewisian logic. 9/
Perhaps it also explains the Indo-Chinese divergence. Their respective top and bottom-heavy strategies meant that China could escape the Lewisian trap, but India could not. This is an instance of emergent properties not reducible to micro-local structures. /10
After this exercise, I feel like I have some grasp of this pattern at the largest of scales. But I'm still in shock. Wow! /fin
• • •
Missing some Tweet in this thread? You can try to
force a refresh
A very important intervention, @kyleichan. I want bicker with one point. You seem to explain Chinese success by “the enduring strength of a state-dominated Chinese system that can pivot, change policy and redirect resources at will in service of long-term national strength.” 1/
It is true that competent government and strategic, long-term vision is important to China’s success. But I would suggest that this factor is secondary to the principal conditioners of Chinese success. 2/
The first principal conditioner is the scale and depth of the Chinese human capital. What made possible the Chinese miracle wasn’t simply long term industrial policy and competent government, but the front-loading of human capital investment. 3/
It’s not surprising to see @martinwolf_ fail to abandon the net balance fallacy. But his own graphs contradict his arguments.
First, China accounts for a minor fraction of global imbalances, esp compared to Europe. 1/
This remarkable fact—ignored by @michaelxpettis and @M_C_Klein despite the general argument in their own book—is also clear from NIIP. Clearly, China is NOT the counterparty amassing US assets on a net basis. 2/
@michaelxpettis @M_C_Klein Most strikingly, China’s high savings are being channeled into domestic investment—by design, “market Leninism”—and therefore are not being pumped abroad! Indeed, net exports are a trivial portion of Chinese GDP! 3/
A simple framework that allows us to understand US trade imbalances in a single graph. Let me explain. 1/🧵
The dollar was the reserve currency in the postwar period. We did not run a persistent trade deficit then. Why? Because our sectoral savings were balanced: businesses were net borrowers and hhs net savers, with the latter financing the former, gov net savings and net savings inflows (~ -NX) were trivial until 1970. 2/
Contrast the above with the later period. HHs increasingly turn into net borrowers themselves. But at first, the fiscal deficit was improving under Clinton, which kept a lid on savings inflows/NX. 3/
I’ve proposed a simple recipe of policy-induced catastrophe: policy innovations premised on pictures of the world that are incongruent with reality. But reading Byman and Pollack (2001), I now realize that I’ve missed an obvious an imp factor orthogonal to misperception. 1/
People hold on to their pictures of the world. The most introspective revise their pictures in light of incoming data. But this is a difficult and noisy process for even the best of us. 2/
Incompetent leaders often cling onto their failed picture long after diagnostic evidence becomes irrefutable—look at how long fantasies about Russian weakness persisted among Western elites! 3/
At the heart of the global financial system are euro/dollar fx and bond markets that are tied together by carry trades. Deviations from covered rate parity contain information on how constrained dealer balance sheets. Forward implied rates contain a macro signal. They are anchored by (in this case, well-informed) investor expectations about the future monetary, and by implication, macroeconomic divergence bw Europe and America. Recent moves suggest a very sharp reversal in said cross-pond growth expectations: Europe, investors are saying, will grow much faster relative to America than previously believed. How sharp was this reversal?
The only episode with a sharper reversal going back all the way to 1999 was the Covid shock, when this moved in the opposite direction, perhaps bc Europe took a much bigger hit early on in the pandemic.
Even more revealing is the second moment. The only months that are in the same ballpark as this one are 2008-12, 2011-11 and 2020-03. Ie, GFC, eurozone crisis, and Covid. Trump's policy fuckup is right up there with the great catastrophes.
Here's the issue. De-industrialization cannot explain the crisis of the US working class. Since 1992, industrial employment has fallen 26% in high income countries and 19% in the US; but adult mortality has fallen by 27% in high income countries, compared to only 5% in the US. 1/
Levels. US had much lower mortality than high income countries in 1992, nor it has much higher—even though industrial employment declined much more. 2/
You may say this is a covid issue. Well, no, it's not. Here're the tables with 2019 instead of 2022. 3/