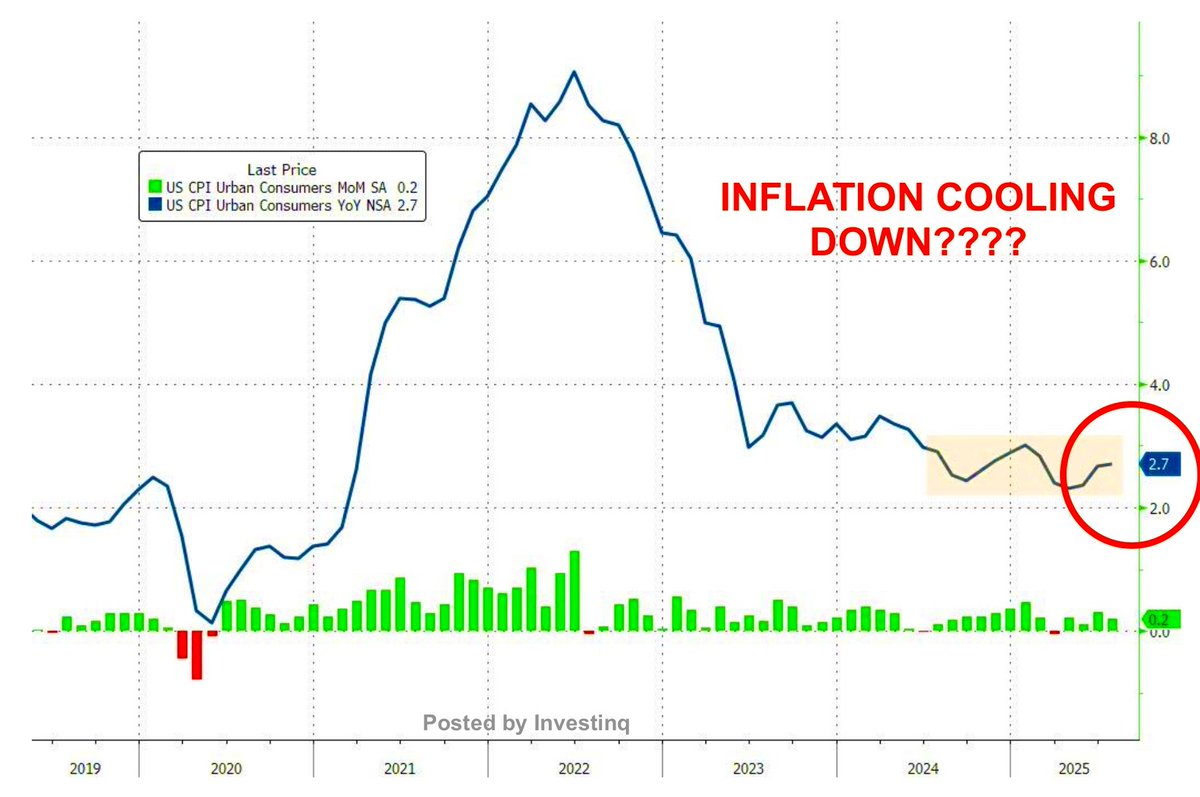
Inflation just “cooled” to 2.7%.
Good news? Not exactly.
The things you can’t avoid paying for are still climbing fast.
(a thread)
Good news? Not exactly.
The things you can’t avoid paying for are still climbing fast.
(a thread)
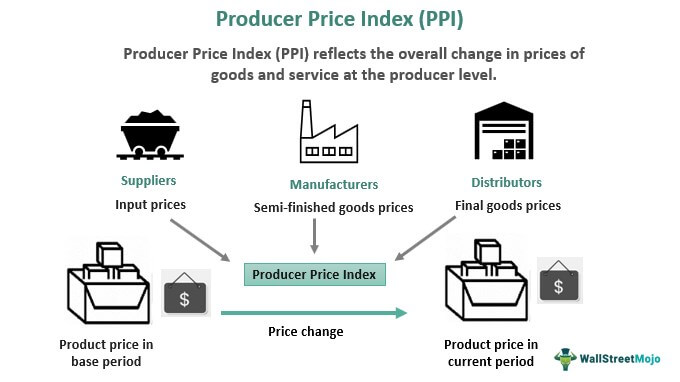
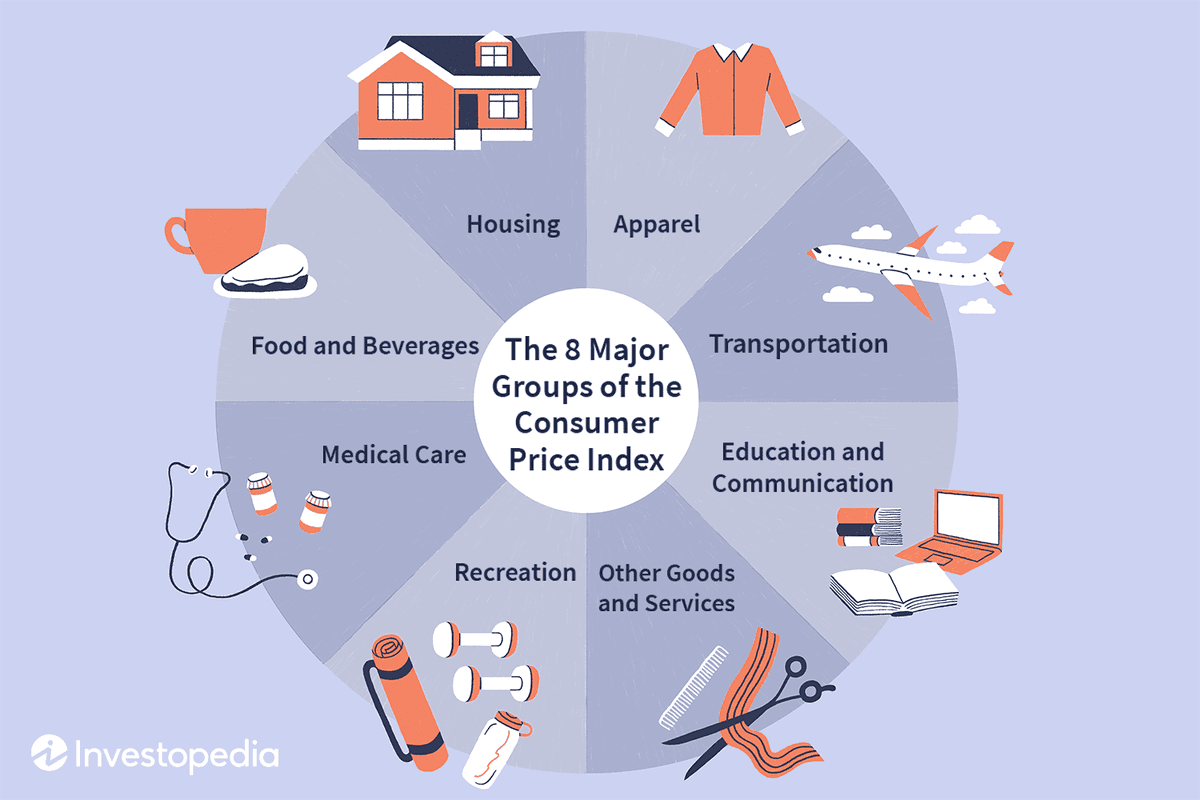
First, CPI, the Consumer Price Index is the main way the U.S. measures inflation.
It’s like a shopping cart filled with everything the average household buys: rent, food, gas, healthcare, clothes, travel, and more.
Every month, the government checks how much that cart costs now versus before.
It’s like a shopping cart filled with everything the average household buys: rent, food, gas, healthcare, clothes, travel, and more.
Every month, the government checks how much that cart costs now versus before.
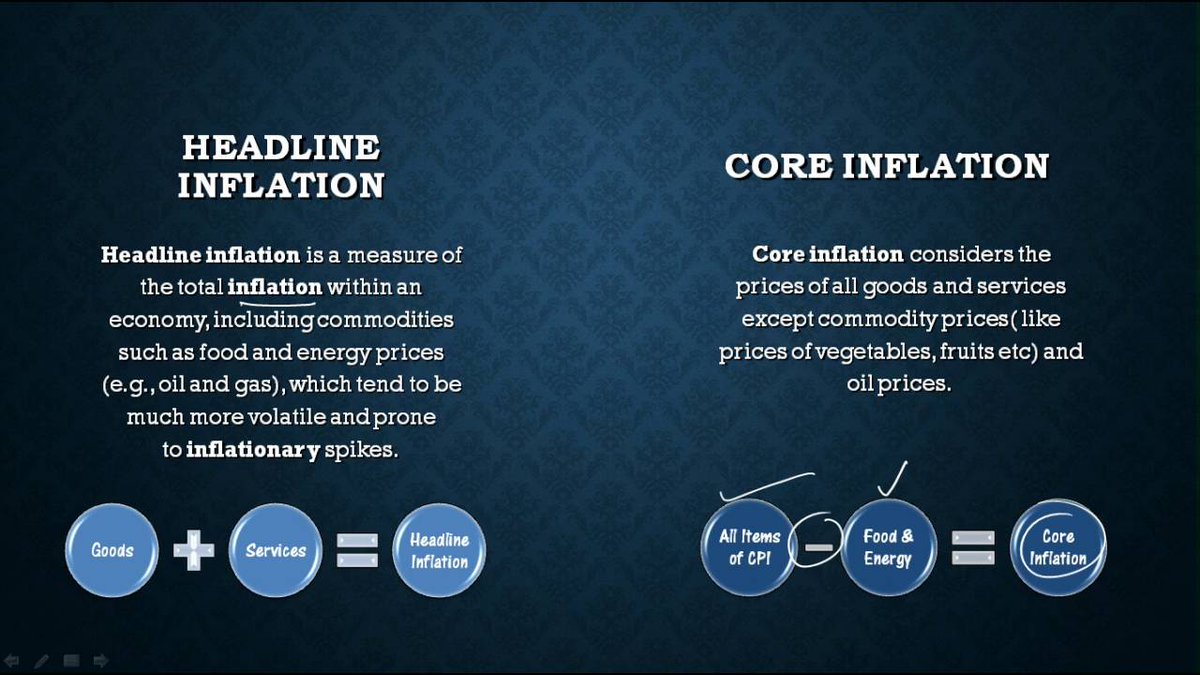
There are two main types of CPI: headline CPI and core CPI.
Headline CPI tracks all items in the basket. Core CPI removes food and energy prices.
Why remove them? Because food and gas can jump or fall suddenly due to wars, or supply issues, which can distort the trend. Core shows a steadier view.
Headline CPI tracks all items in the basket. Core CPI removes food and energy prices.
Why remove them? Because food and gas can jump or fall suddenly due to wars, or supply issues, which can distort the trend. Core shows a steadier view.
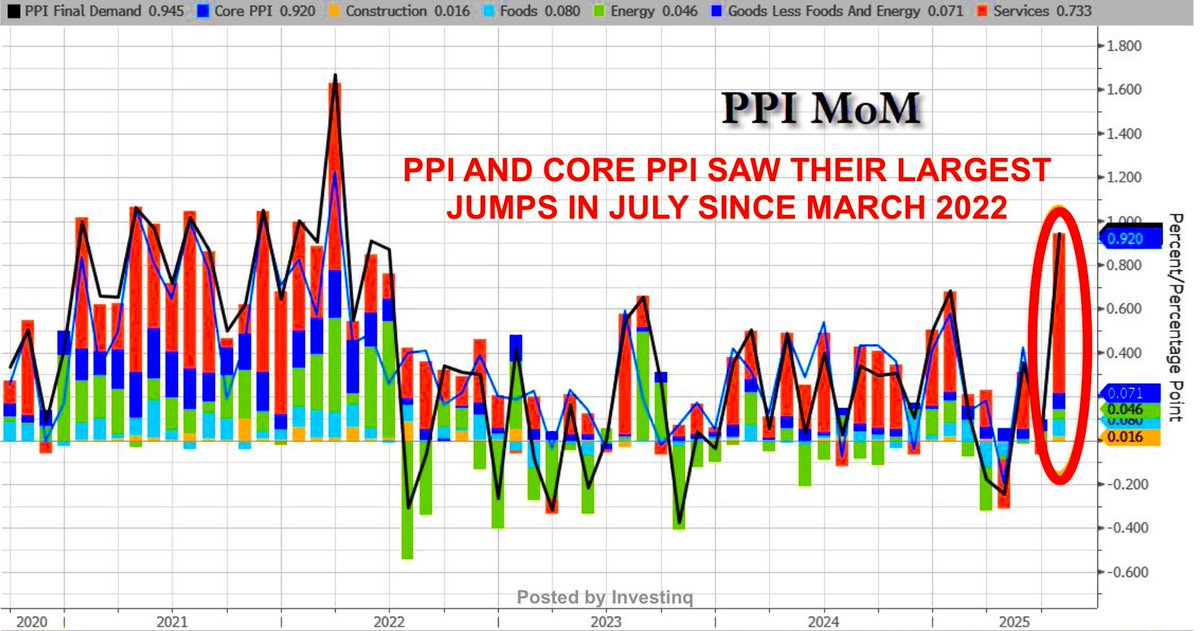
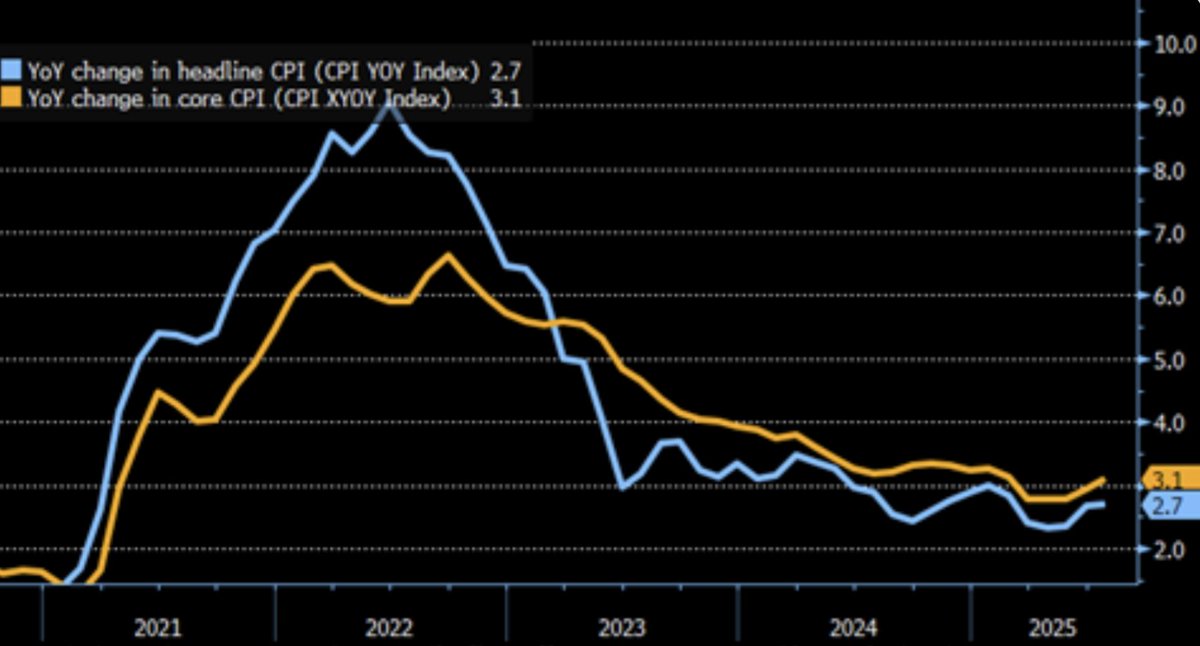
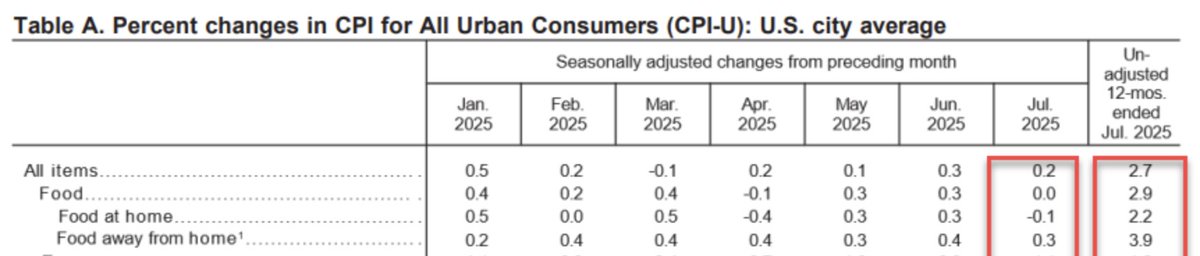
In July, headline CPI rose 0.2% month-over-month (m/m) and 2.7% year-over-year (y/y).
m/m means compared to the previous month. y/y means compared to the same month last year.
Core CPI rose 0.3% m/m and 3.1% y/y, still above the Federal Reserve’s 2% target.
m/m means compared to the previous month. y/y means compared to the same month last year.
Core CPI rose 0.3% m/m and 3.1% y/y, still above the Federal Reserve’s 2% target.
Housing is the heavyweight of CPI, it makes up about 1/3 of the total index
The shelter index measures rent, owners’ equivalent rent (an estimate of what a homeowner would pay if they rented their own home), and lodging
In July, it rose 0.2%: rents and OER each climbed 0.3% while hotels dropped 1%
The shelter index measures rent, owners’ equivalent rent (an estimate of what a homeowner would pay if they rented their own home), and lodging
In July, it rose 0.2%: rents and OER each climbed 0.3% while hotels dropped 1%
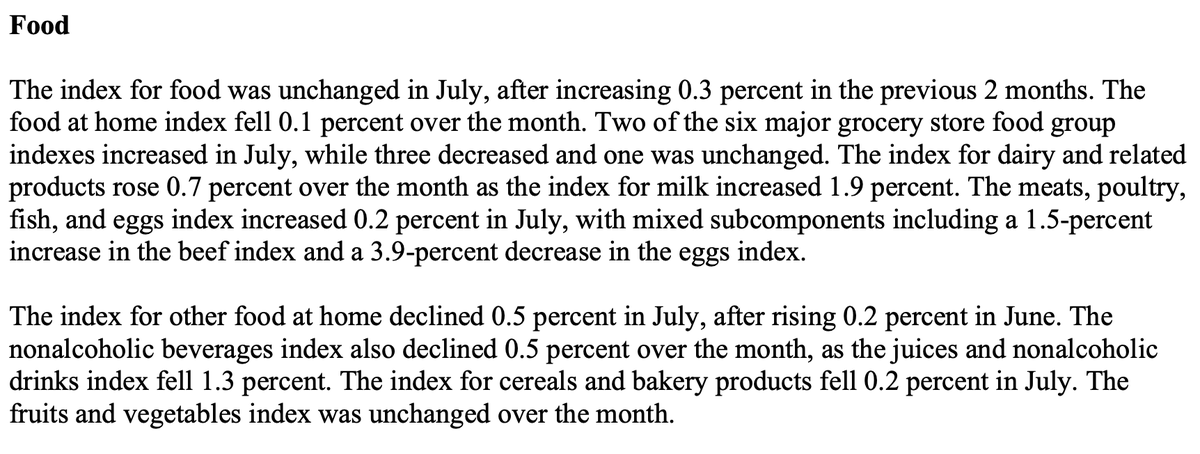
Food prices looked flat overall, but that’s misleading.
Food at home (groceries) fell 0.1%, offering a bit of relief. Food away from home (restaurants) rose 0.3%, meaning eating out is still getting more expensive.
The split matters most households spend on both.
Food at home (groceries) fell 0.1%, offering a bit of relief. Food away from home (restaurants) rose 0.3%, meaning eating out is still getting more expensive.
The split matters most households spend on both.
Breaking down groceries: dairy rose 0.7% (milk +1.9%), meats/poultry/fish/eggs rose 0.2% with beef up 1.5% and eggs down 3.9%.
Nonalcoholic drinks fell 0.5%, cereals/bakery dropped 0.2%, and fruits/vegetables stayed flat.
Over the last year, eggs are still up 16.4% despite the recent drop.
Nonalcoholic drinks fell 0.5%, cereals/bakery dropped 0.2%, and fruits/vegetables stayed flat.
Over the last year, eggs are still up 16.4% despite the recent drop.
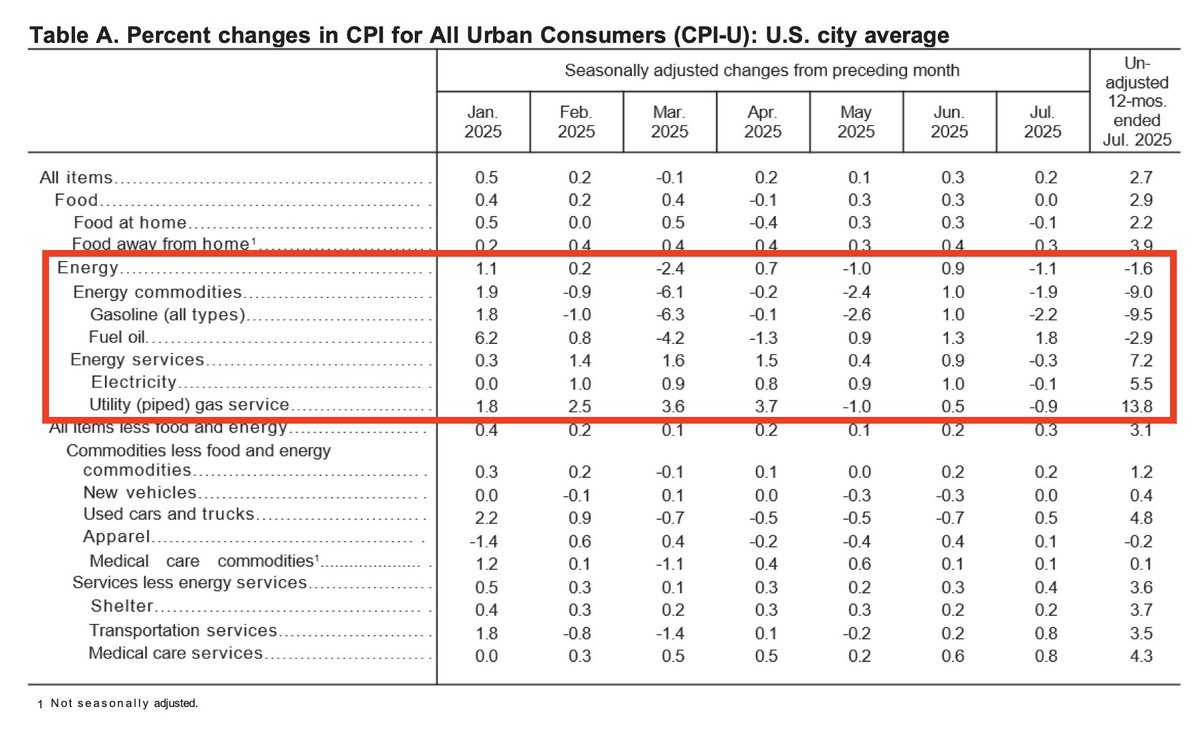
Energy prices gave the biggest boost to lower inflation.
The energy index fell 1.1% in July. Gasoline dropped 2.2% and is nearly 10% cheaper than a year ago.
Electricity barely dipped at −0.1% but is still up 5.5% y/y. Natural gas fell 0.9% but is up 13.8% y/y.
The energy index fell 1.1% in July. Gasoline dropped 2.2% and is nearly 10% cheaper than a year ago.
Electricity barely dipped at −0.1% but is still up 5.5% y/y. Natural gas fell 0.9% but is up 13.8% y/y.
Travel costs moved in the opposite direction.
Airline fares rose 4% in July after falling slightly in June.
When airfare jumps like this, it’s often driven by high summer demand and capacity limits meaning it hits travelers quickly and directly.
Airline fares rose 4% in July after falling slightly in June.
When airfare jumps like this, it’s often driven by high summer demand and capacity limits meaning it hits travelers quickly and directly.
Cars and car-related costs showed mixed results.
Used cars rose 0.5%, new cars stayed flat. But the cost of ownership is climbing: auto insurance is up 5.3% y/y, and maintenance/repair rose 1% in July alone, now +6.5% y/y.
These are ongoing costs you can’t avoid if you own a car.
Used cars rose 0.5%, new cars stayed flat. But the cost of ownership is climbing: auto insurance is up 5.3% y/y, and maintenance/repair rose 1% in July alone, now +6.5% y/y.
These are ongoing costs you can’t avoid if you own a car.
Medical care added more upward pressure.
The overall category rose 0.7%, led by dental services (+2.6%), hospital services (+0.4%), and physician visits (+0.2%).
Prescription drugs were the only decline, down 0.2% from June.
The overall category rose 0.7%, led by dental services (+2.6%), hospital services (+0.4%), and physician visits (+0.2%).
Prescription drugs were the only decline, down 0.2% from June.
Some smaller categories cooled and helped offset other increases.
Communication services fell 0.3%, and lodging away from home dropped 1%.
These don’t weigh heavily in the CPI basket but still shave a bit off the monthly total.
Communication services fell 0.3%, and lodging away from home dropped 1%.
These don’t weigh heavily in the CPI basket but still shave a bit off the monthly total.
CPI comes in three main versions:
• CPI-U covers all urban consumers (about 90% of the U.S. population).
• CPI-W covers wage earners and clerical workers (about 30% of the population).
• Chained CPI accounts for substitution when people switch to cheaper goods when prices rise.
• CPI-U covers all urban consumers (about 90% of the U.S. population).
• CPI-W covers wage earners and clerical workers (about 30% of the population).
• Chained CPI accounts for substitution when people switch to cheaper goods when prices rise.
For July: CPI-U stood at 323.048 (1982–84=100), meaning the basket costs 3.23× more than in the early 1980s.
CPI-W was 316.349. Chained CPI rose 0.1% in July and 2.5% y/y.
The base number is for reference, the percentage change is what tells the story.
CPI-W was 316.349. Chained CPI rose 0.1% in July and 2.5% y/y.
The base number is for reference, the percentage change is what tells the story.
You’ll often see “seasonally adjusted” and “not seasonally adjusted” in CPI data.
Seasonally adjusted smooths out predictable price patterns like holiday sales or summer gas spikes so the month-to-month trend is easier to see.
Not seasonally adjusted is the raw change you feel in your bills.
Seasonally adjusted smooths out predictable price patterns like holiday sales or summer gas spikes so the month-to-month trend is easier to see.
Not seasonally adjusted is the raw change you feel in your bills.
Analysts also track two key ideas: effect and relative importance.
Effect is how much a category changed the total CPI. Relative importance is its share of the basket.
A 1% change in rent matters far more than a 10% change in peanut butter prices.
Effect is how much a category changed the total CPI. Relative importance is its share of the basket.
A 1% change in rent matters far more than a 10% change in peanut butter prices.
Methodology changes can shift readings too.
This month, wireless telephone services were measured using new data sources, which could slightly alter the communications category.
And starting in October 2025, long-term care insurance will be removed from the health insurance index.
This month, wireless telephone services were measured using new data sources, which could slightly alter the communications category.
And starting in October 2025, long-term care insurance will be removed from the health insurance index.
The big picture: inflation is easing overall but unevenly.
Gas prices and some groceries are down, but services housing, healthcare, travel, and car upkeep are still climbing.
Those are the costs most people can’t cut back on, so the “feeling” of inflation stays sticky.
Gas prices and some groceries are down, but services housing, healthcare, travel, and car upkeep are still climbing.
Those are the costs most people can’t cut back on, so the “feeling” of inflation stays sticky.
The next CPI report drops Thursday, September 11, 2025, at 8:30 a.m. ET.
If gas keeps falling and travel costs calm down, inflation could keep easing.
If not, the "last mile" to 2% inflation will be a tougher climb.
If gas keeps falling and travel costs calm down, inflation could keep easing.
If not, the "last mile" to 2% inflation will be a tougher climb.
If you found these insights valuable: Sign up for my FREE newsletter! thestockmarket.news
• • •
Missing some Tweet in this thread? You can try to
force a refresh