Straw Man Science and Covid Mitigation:
How poor experimental design coupled with media sensationalism undermines physical and engineering solutions to limit the spread of airborne diseases
A 🧵
How poor experimental design coupled with media sensationalism undermines physical and engineering solutions to limit the spread of airborne diseases
A 🧵

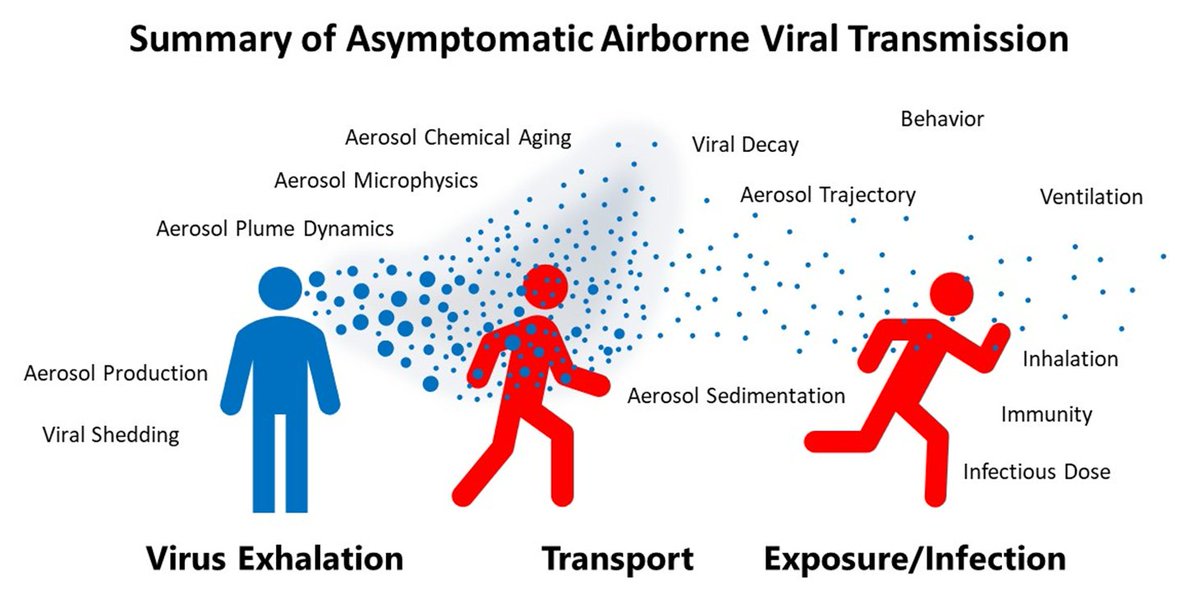
Airborne disease transmission is a complex, and multidisciplinary process. As a result, understanding how various factors affects transmission rates is exceedingly difficult.
Consequently, designing effective physical mitigation strategies for this process remains a challenge.
Consequently, designing effective physical mitigation strategies for this process remains a challenge.

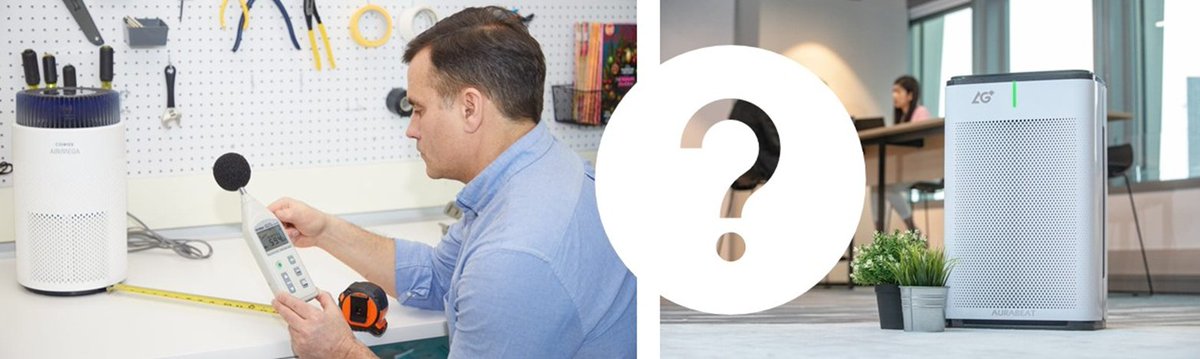
Various strategies have been implemented with various degrees of success. Masking, ventilation, filtration, using CO2 monitors, etc.
The challenge is, how does one test how well do they limit transmission?
The challenge is, how does one test how well do they limit transmission?
There are many different approaches one can take. And they can range from heavily lab based through to “real world” studies. All are critical to fully understand a system.

Lab based studies are critical as they provide the underlying evidence that an intervention will have a chance of working.
For example, we know that airborne viruses are carried on exhaled aerosol. So, the first thing to prove would be that an air filter actually removes aerosol
For example, we know that airborne viruses are carried on exhaled aerosol. So, the first thing to prove would be that an air filter actually removes aerosol
Once that the proof of concept is established (e.g.filter removes respiratory aerosol in a lab environment), then complexity can be increased.
Moving from the lab, through to case studies and eventually into “real world” scenarios.
Moving from the lab, through to case studies and eventually into “real world” scenarios.
There are 3 questions to answer:
1) Does the mitigation technique have an effect on the specific process that it is designed to address in a “real world” environment?
2) Is that effect large enough to alter the risk of transmission?
1) Does the mitigation technique have an effect on the specific process that it is designed to address in a “real world” environment?
2) Is that effect large enough to alter the risk of transmission?
And, 3) If something works well in the lab, but fails in the “real world” studies, then theories as to why can then be explored:
- how can we optimize the intervention to limit transmission?
- are these optimization steps possible/feasible?
- how can we optimize the intervention to limit transmission?
- are these optimization steps possible/feasible?
Alright then, so how are physical interventions tested? What factors are considered, which are not, etc.?

Hypothesis testing can be considered a "mini-debate“, of sorts. The null hypothesis acts as a starting point, and the evidence gathered either supports or refutes it.
A couple of common strategies used when debating a subject are “Straw Manning” and “Steel Manning”
A couple of common strategies used when debating a subject are “Straw Manning” and “Steel Manning”

“Steel Manning” is a good faith argument technique wherein one side accurately describes the other’s best arguments before engaging with them.
By accurately representing the argument of the opposing side, winning the debate becomes both harder, and impactful.
By accurately representing the argument of the opposing side, winning the debate becomes both harder, and impactful.

“Straw Manning” is a bad faith argumenttechnique wherein one side poorly describes the other’s best arguments before engaging with them.
By misrepresenting the argument of the opposing side, winning the debate becomes both easy, and meaningless.
By misrepresenting the argument of the opposing side, winning the debate becomes both easy, and meaningless.

Typically, scientific studies that test the effect of mitigation strategies will set out to do “Steel Man Science”.
Unfortunately, this is not always the case. There are a few reasons for this.
Unfortunately, this is not always the case. There are a few reasons for this.
1) Disingenuous researcher.
While this accusation is commonly made online, in reality it is highly unlikely.
While this accusation is commonly made online, in reality it is highly unlikely.
2) Complexity of airborne disease transmission is not fully considered. So, while a deeper understanding is sought, often various parameters are not considered that undermine the broader implications of the work.
3) Results overstated. This can be done by:
-the researchers who may have overlooked/misunderstood something
-the funders/institutions that published the work to elevate status
-or the media, to make a headline.
-the researchers who may have overlooked/misunderstood something
-the funders/institutions that published the work to elevate status
-or the media, to make a headline.
Again, airborne disease transmission is complicated. Meaning that mistakes and overstatements of impact can be made, the intent may not be malicious. Sometimes, it’s just a mistake. Other times, people are simply repeating a study (that has a flaw).
Alright, let’s pick a study and I’ll walk through what I mean by all of this.
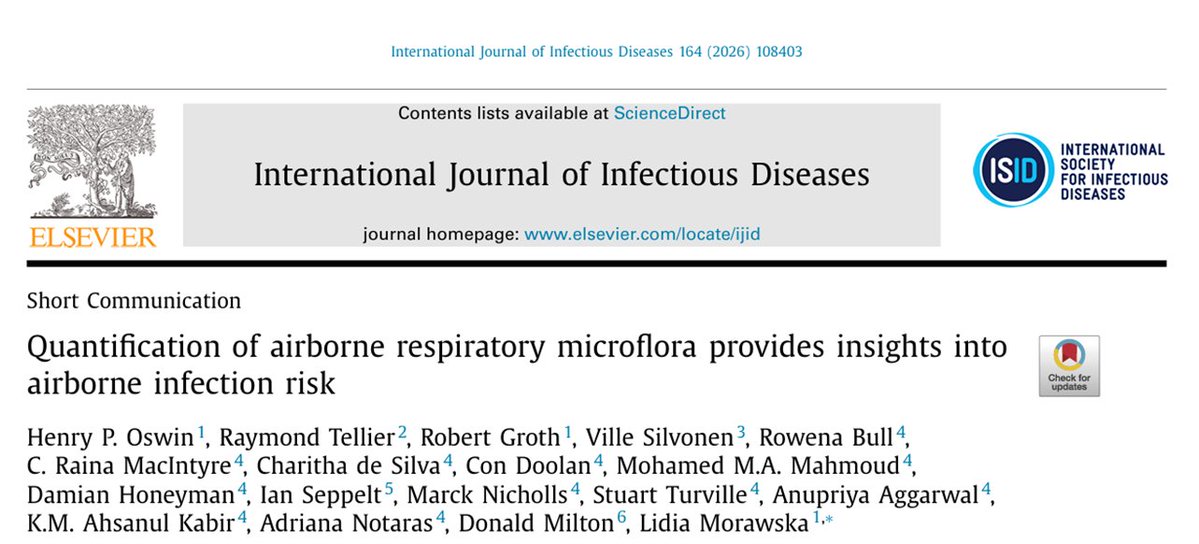
Consider the following study:
mdpi.com/2305-6304/13/7…
Consider the following study:
mdpi.com/2305-6304/13/7…
Ventilation is argued to be an effective mitigation strategy as it physically removes the virus containing aerosol from the room.
One way to estimate ventilation, is through the use of a CO2 monitor.
One way to estimate ventilation, is through the use of a CO2 monitor.
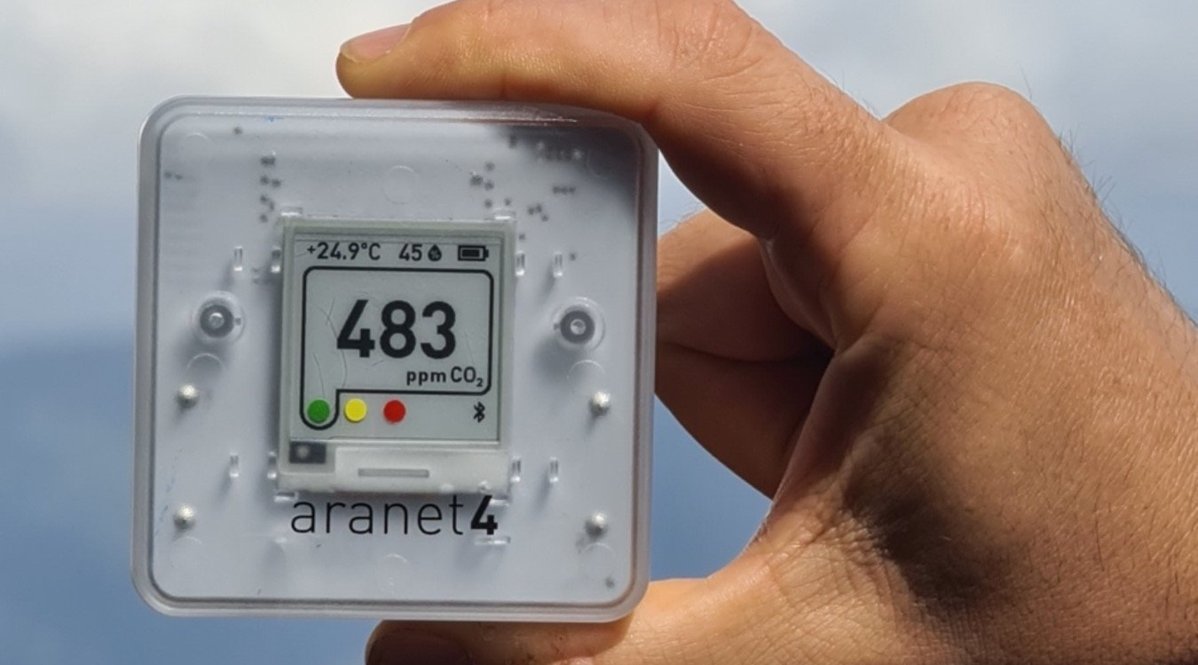
Exhaled SC2 and CO2 have a shared source: breath. For this reason, CO2 monitors have been used as a proxy for the amount of aerosolized virus that could be in the given space
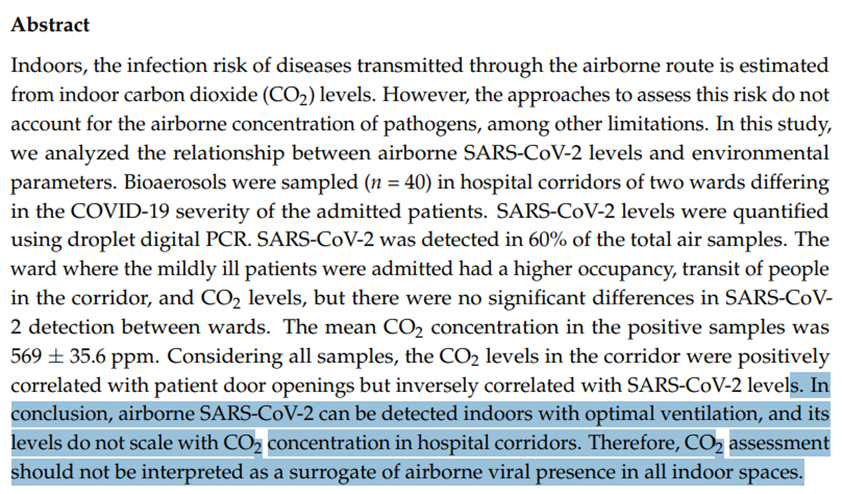
In this study, the authors explored whether CO2 correlates with the amount of SC2 present in the air
In this study, the authors explored whether CO2 correlates with the amount of SC2 present in the air
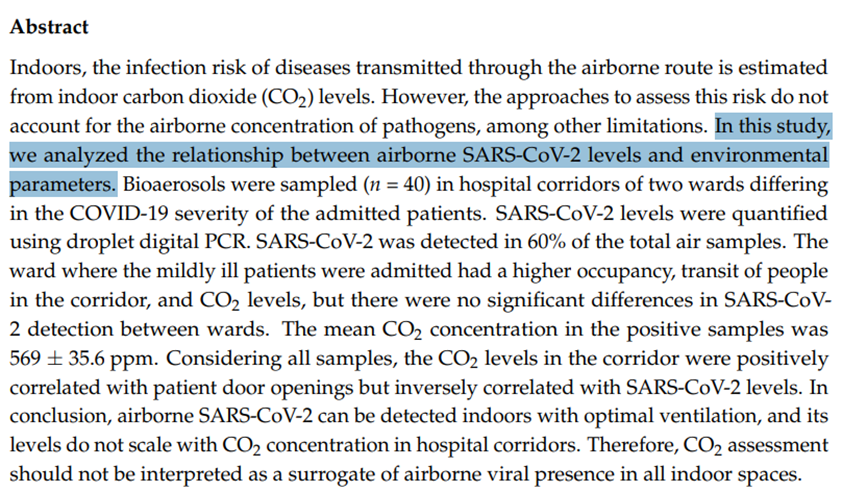
Results:
No correlation between CO2 and aerosolized SC2 was found
The authors concluded that CO2 concentration should not be used to estimate risk
This is an extremely bold claim to make based on the underlying (lab) studies, so the data must be strong. So, let’s take a look
No correlation between CO2 and aerosolized SC2 was found
The authors concluded that CO2 concentration should not be used to estimate risk
This is an extremely bold claim to make based on the underlying (lab) studies, so the data must be strong. So, let’s take a look
First, let’s start with some context.
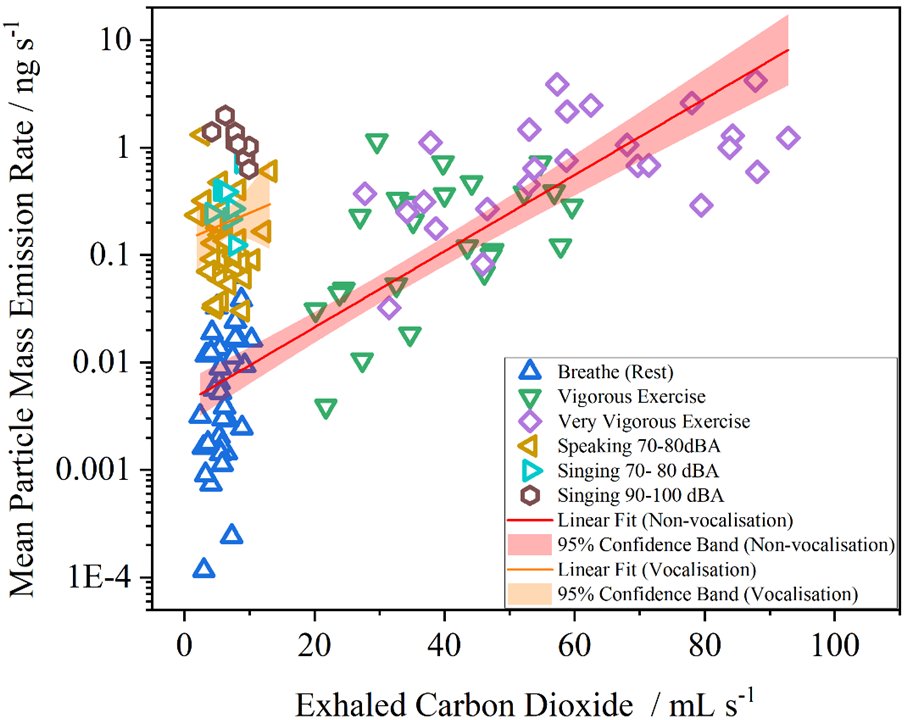
Why do people even believe that CO2 and SARS-CoV-2 would be correlated? Studies have found that the amount of aerosol that is exhaled is correlated with the amount of CO2 exhaled. When talking or singing, aerosol>>CO2.
Why do people even believe that CO2 and SARS-CoV-2 would be correlated? Studies have found that the amount of aerosol that is exhaled is correlated with the amount of CO2 exhaled. When talking or singing, aerosol>>CO2.
CO2 and aerosol will move around a room in a similar fashion. Meaning, that if a window is opened, then both the CO2 and aerosolized SARS-CoV-2 would go down. If filtration is used, then the SC2 would drop while the CO2 would remain unchanged.
Exhaled air has a CO2 concentration of ~50,000ppm. Background CO2 will be ~400-500ppm. Typical indoor CO2 levels will range widely, from ambient to >5,000ppm
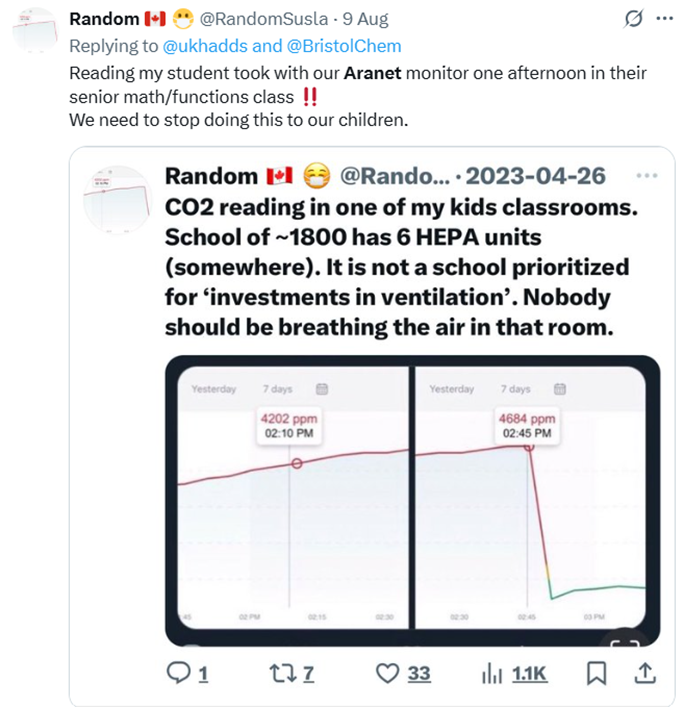
CO2 concentration is used to determine whether a space is well ventilated. Generally speaking, under 800 ppm is considered well ventilated.
As the CO2 goes up from there, so does the risk.
As the CO2 goes up from there, so does the risk.
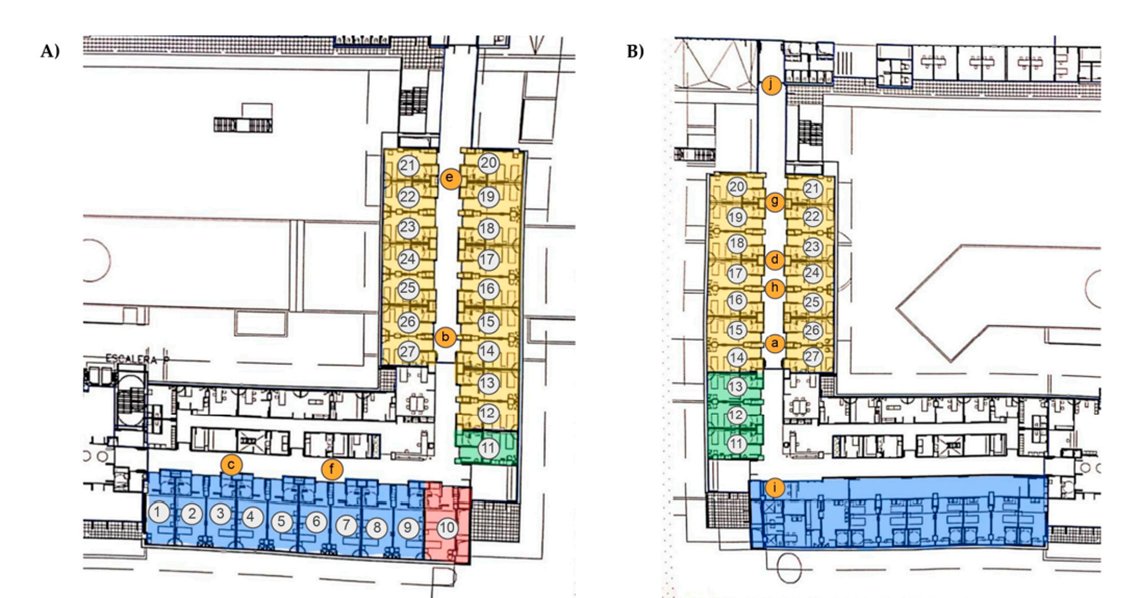
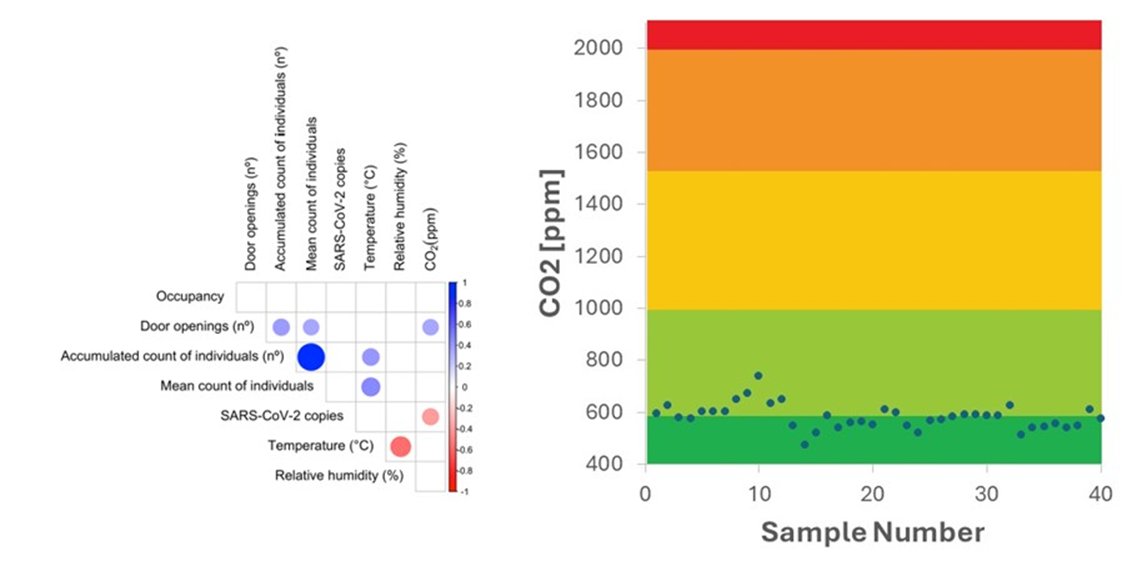
In the current study, they set up bioaerosol samplers at various locations in a hospital ward. The amount of SARS-CoV-2 present in the air was quantified using PCR.
CO2 concentration was measured using an air quality meter
CO2 concentration was measured using an air quality meter
PCR Measurements:
The technique used was appropriate. Indeed, many other studies have made the same measurements using similar, if not the same kit.
The technique used was appropriate. Indeed, many other studies have made the same measurements using similar, if not the same kit.
One limitation that the authors highlighted, was the inability to measure infectious virus. This is not uncommon. And given what the authors were trying to achieve, this limitation is not by any means a major problem or an issue. Indeed, the authors mentioning this is a good sign
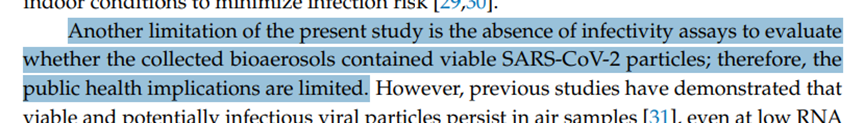
Regarding the CO2 measurements, the technique used has been employed in many other studies.
It is notable that the authors only sampled the CO2 when the PCR was also being sampled. Again, another plus in experimental design.
It is notable that the authors only sampled the CO2 when the PCR was also being sampled. Again, another plus in experimental design.
What this all means, is that in terms of experiment design, goals, etc, this study is well within “Steel Man” territory.
Standard techniques are used, valid assumptions are made, limitations considered, etc.
Standard techniques are used, valid assumptions are made, limitations considered, etc.

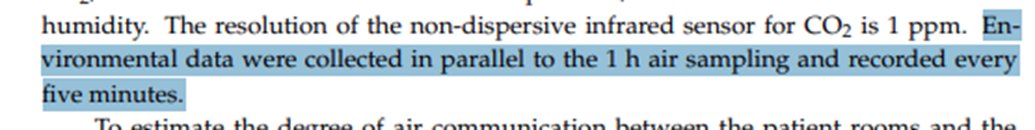
When they correlated the CO2 with SARS-CoV-2, what did they find?
Well, they reported a negative correlation between CO2 and SARS-CoV-2.
Given what we know about the processes involved (from the lab studies), how is this possible?
Well, they reported a negative correlation between CO2 and SARS-CoV-2.
Given what we know about the processes involved (from the lab studies), how is this possible?
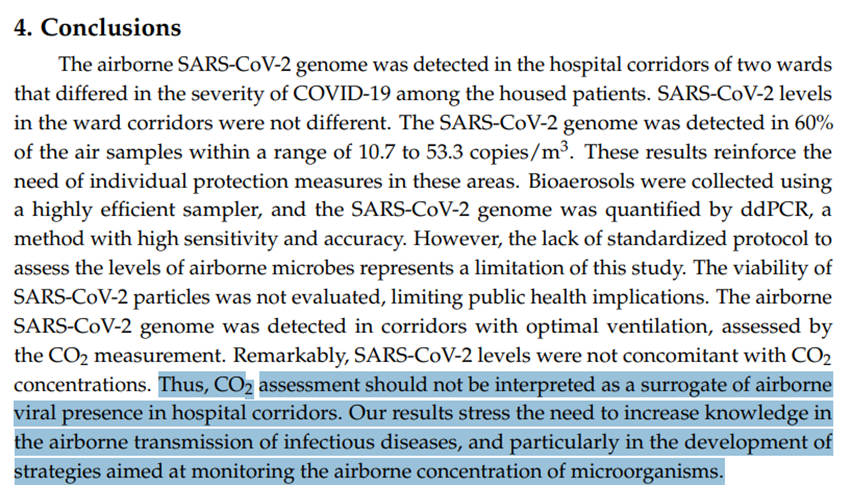
To reiterate the point, in the conclusions the authors state clearly that CO2 “should not be interpreted as a surrogate of airborne viral presence in hospital corridors”.
While a negative trend was measured, what does the data actually show. Let’s have a closer look.
While a negative trend was measured, what does the data actually show. Let’s have a closer look.
When you look at the reported CO2 concentrations, what is happening becomes clearer.
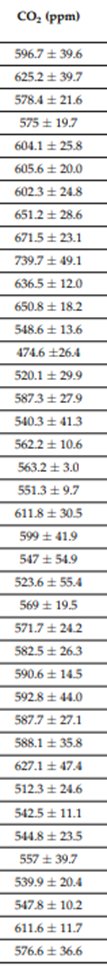
All of the CO2 values are in the “Excellent” to “Good” air quality range. Meaning that the space is extremely well ventilated.
Based on our understanding of the dynamics at play, we would NOT EXPECT to see a correlation between CO2 and SARS-CoV-2 in this range. It’s in the noise
Based on our understanding of the dynamics at play, we would NOT EXPECT to see a correlation between CO2 and SARS-CoV-2 in this range. It’s in the noise
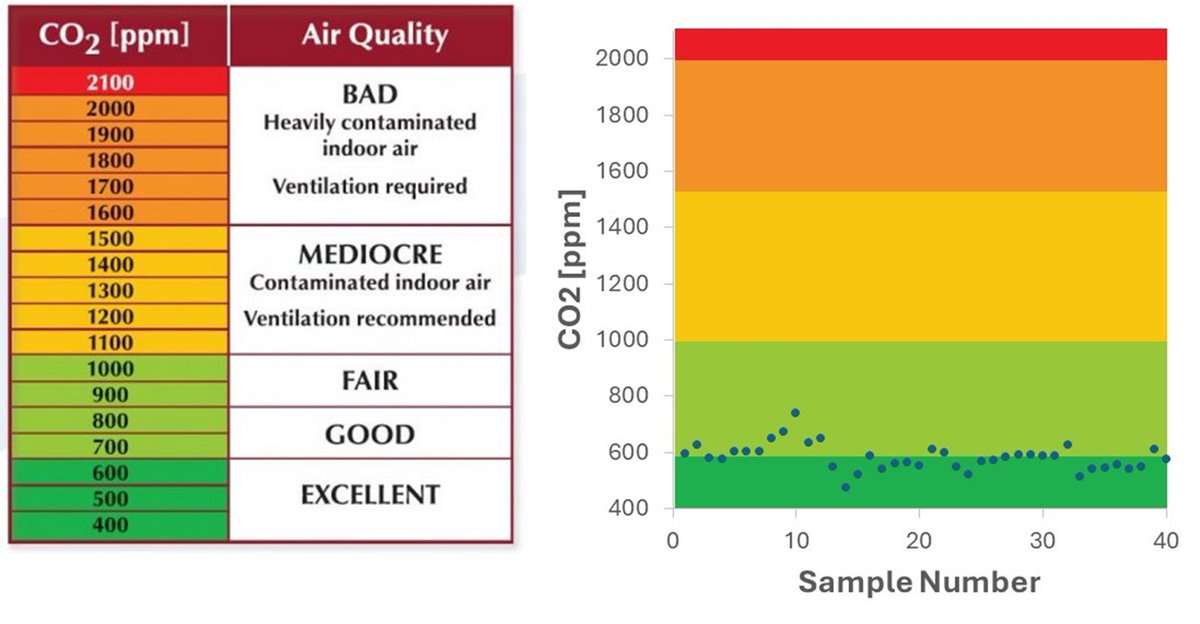
And when you look at the reported SARS-CoV-2 concentrations, this further supports my previous point.
First, 16 of the 40 (40%) of the samples were blank. Meaning that no SARS-CoV-2 was detected in almost half the samples. You would expect this in a well ventilatedspace.
First, 16 of the 40 (40%) of the samples were blank. Meaning that no SARS-CoV-2 was detected in almost half the samples. You would expect this in a well ventilatedspace.

Of the rest, the SC2 concentration ranged ~10 to ~50 copies per m3.
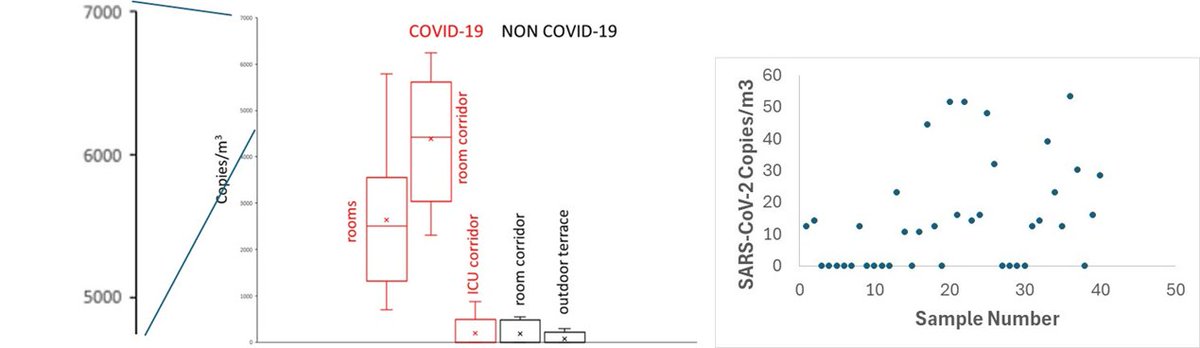
Okay, so what does THAT mean? Is that high, low, normal? Luckly, the authors include a link to an article that reports SARS-CoV-2 concentrations measured in the hospital air. Let’s take a look.
Okay, so what does THAT mean? Is that high, low, normal? Luckly, the authors include a link to an article that reports SARS-CoV-2 concentrations measured in the hospital air. Let’s take a look.
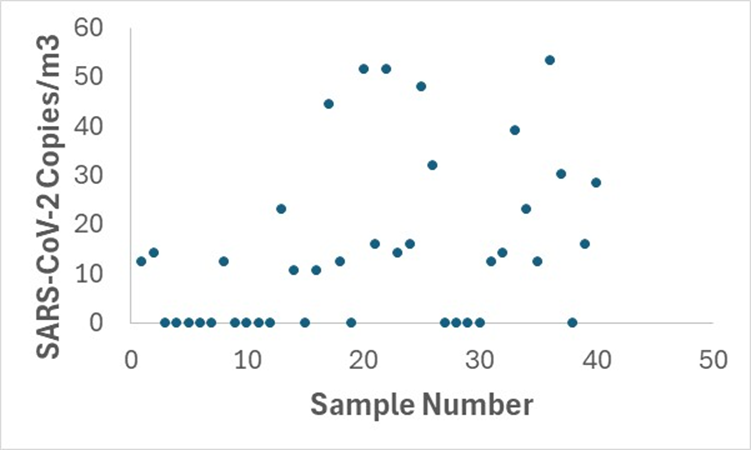
In the other study (ref 37), they report the values shown in the figure on the left. Look at the y-axis. The values in the previous study are 1 to 2 orders of magnitude higher than those reported in the current study (right).

Alright, let’s take a step back, and rather than simply correlating CO2 and SARS-CoV-2 counts, let’s look at what each data set is actually telling us.
Based on the CO2 values, the areas sampled were extremely well ventilated. The CO2 levels are always at, or near, background.
Based on the CO2 values, the areas sampled were extremely well ventilated. The CO2 levels are always at, or near, background.
Likewise, the SARS-CoV-2 concentrations are at, or near, background. Almost half the samples were empty. And of the samples that were detected, the values were ~1% of those observed in other studies.

When parameters are both at, or near, background levels, the correlation is going to be extremely noisy.
The PCR numbers will likley be more of a function of where individuals are sat/wa;king during bioaerosol sampling than a result of the virus accumulating.
The PCR numbers will likley be more of a function of where individuals are sat/wa;king during bioaerosol sampling than a result of the virus accumulating.
What you have here is the result of a well ventilated hospital studied with a good experiment
While the conclusions drawn are “supported” by the data, they largely miss the point:
There isn’t a large enough range of ventilation such that we would expect to see any correlation
While the conclusions drawn are “supported” by the data, they largely miss the point:
There isn’t a large enough range of ventilation such that we would expect to see any correlation
By not accurately putting the data in the study into a broader context, the conclusions of the study make the publication into a Straw Man:
Nobody would expect to see elevated levels of SARS-CoV-2 in an area where the CO2 is at or near background.
Nobody would expect to see elevated levels of SARS-CoV-2 in an area where the CO2 is at or near background.

This study shows that a well ventilatedhospital will have ~1% of the aerosolized viral load than a poorly ventilated one. The data in this article supports the utility of good ventilation while simultaneously arguing in the text that ventilation doesn’t correlate with viral load
As for the reasons why the authors chose to present their conclusions in this way is unclear. At the very least, it is an indictment of the reviewers who failed to point this fairly obvious oversight.
Regardless, this is now a published study where the conclusions of the study are used to justify not using CO2 monitors while few will actually loo at the data.
This is a problem.
This is a problem.
Conversely, for an example of an out and out, Straw Man science article from concept through to publication, I would point you toward the Montreal CO2 study. I wrote a thread about it here:
https://x.com/ukhadds/status/1886020272731357242
From inventing an entirely novel way to measure CO2 that no one uses, to dramatic extrapolations of their “findings”, this is an example of science designed to generate a specific result
Unfortunately, this is easy to do in the field of physical mitigation studies.
Unfortunately, this is easy to do in the field of physical mitigation studies.
And it’s made even easier to do when well designed studies are misrepresenting their results.

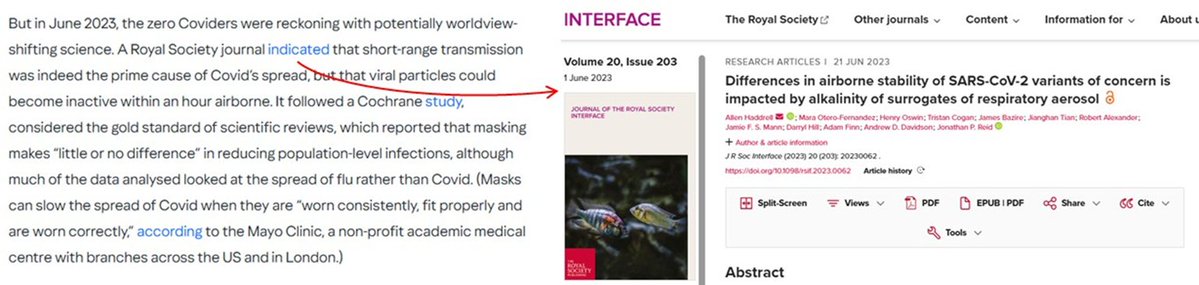
Eventually, many "Straw Man" studies will be grouped together into a review article, further cementing inaccurate conclusions. Regarding masks, the Cochrane review article is a good example of that.

Unfortunately, when it comes to testing physical mitigation strategies, you often see “Straw Man” Scientific studies. And it is a problem, because it is extremely easy to design (even inadvertently) experiments to “prove” something doesn’t work.
Anyway, that was a long one, thanks for making it to the end (photo of Mix for a reward). I hope you found that interesting.
If you have any “Straw Man” studies that you think are worth pointing out, please share below and we can all talk about it.
If you have any “Straw Man” studies that you think are worth pointing out, please share below and we can all talk about it.

• • •
Missing some Tweet in this thread? You can try to
force a refresh