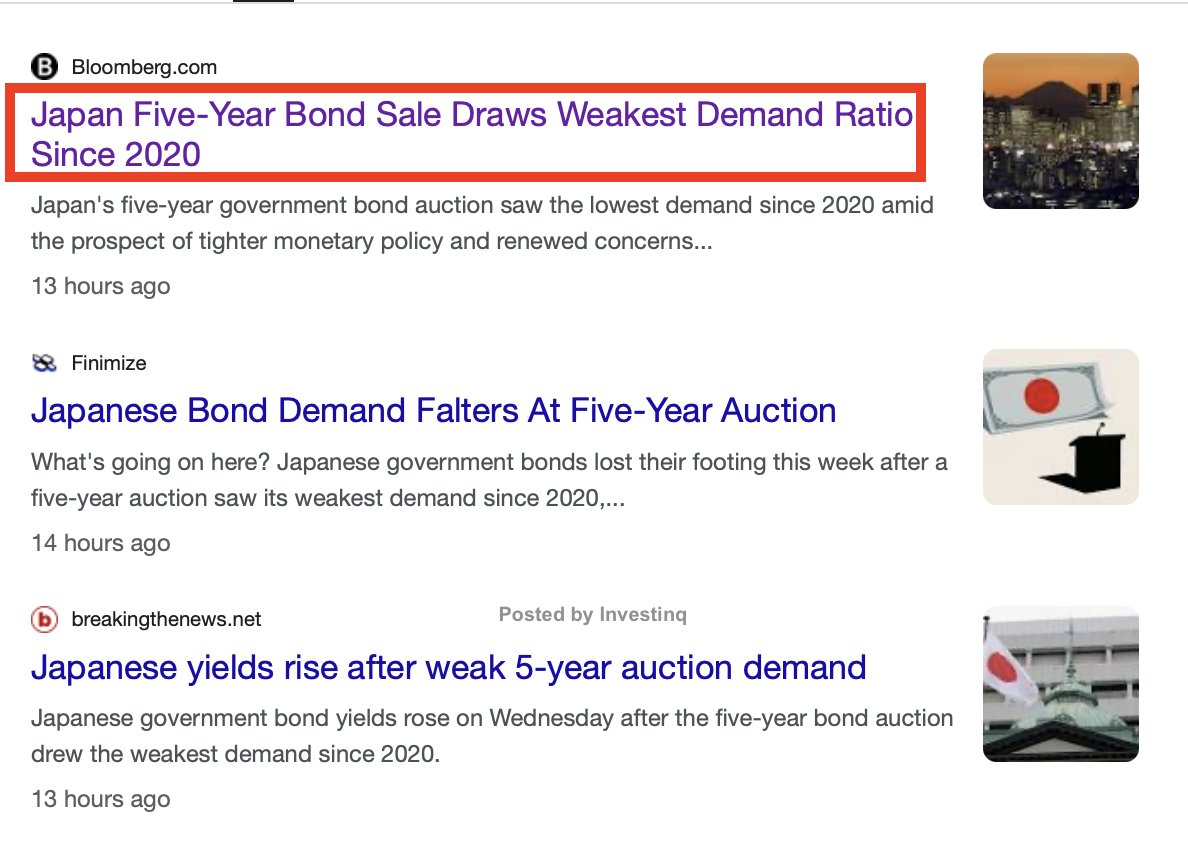
Japan’s 5Y auction just printed its weakest demand since 2020.
Behind that number is a signal for money flows worldwide.
Here’s the full story in simple terms.
(a thread)
Behind that number is a signal for money flows worldwide.
Here’s the full story in simple terms.
(a thread)
First, what’s a government bond auction?
Governments borrow money by selling bonds basically “IOUs” promising to pay you interest and repay the money later.
In Japan’s case, a 5-year JGB means a Japanese Government Bond that pays interest for 5 years before paying back the original amount.
Governments borrow money by selling bonds basically “IOUs” promising to pay you interest and repay the money later.
In Japan’s case, a 5-year JGB means a Japanese Government Bond that pays interest for 5 years before paying back the original amount.
The auction is where investors “bid” for bonds, saying: “I’ll pay X yen.”
The government accepts the best offers until all bonds are sold.
Strong demand means higher prices and lower yields; weak demand forces cheaper sales, meaning higher interest for buyers.
The government accepts the best offers until all bonds are sold.
Strong demand means higher prices and lower yields; weak demand forces cheaper sales, meaning higher interest for buyers.
So what happened in this auction?
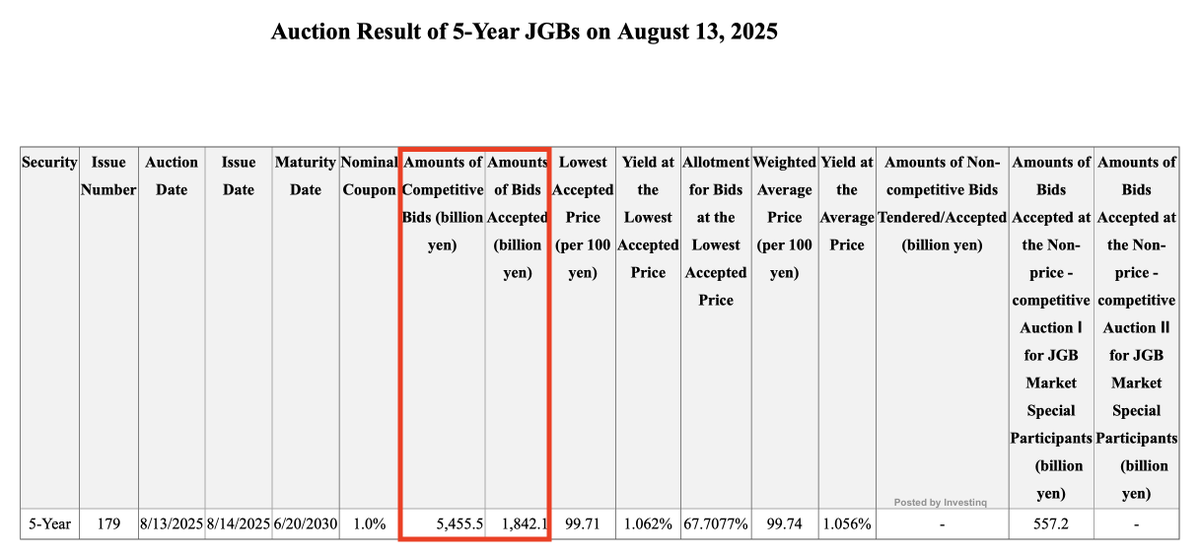
Japan wanted to sell ¥1.84 trillion of 5-year bonds. Investors offered ¥5.46 trillion worth of bids.
That might sound like a lot of interest… but in bond world, the bid-to-cover ratio tells the real story.
Japan wanted to sell ¥1.84 trillion of 5-year bonds. Investors offered ¥5.46 trillion worth of bids.
That might sound like a lot of interest… but in bond world, the bid-to-cover ratio tells the real story.
Bid-to-cover ratio = total bids ÷ amount sold.
If the ratio is high, demand is strong. If it’s low, demand is weak. This time: 2.96×.
That means for every ¥1 the gov’t sold, investors offered ¥2.96. The average over the past year? ~3.74×. So today’s was well below normal.
If the ratio is high, demand is strong. If it’s low, demand is weak. This time: 2.96×.
That means for every ¥1 the gov’t sold, investors offered ¥2.96. The average over the past year? ~3.74×. So today’s was well below normal.
Now, about the coupon, that’s the fixed interest rate the bond pays each year.
These bonds pay 1.0% annually.
But here’s the catch: in the market right now, investors want slightly more than that about 1.06% so the bonds sold for less than their “face value” of 100 yen.
These bonds pay 1.0% annually.
But here’s the catch: in the market right now, investors want slightly more than that about 1.06% so the bonds sold for less than their “face value” of 100 yen.
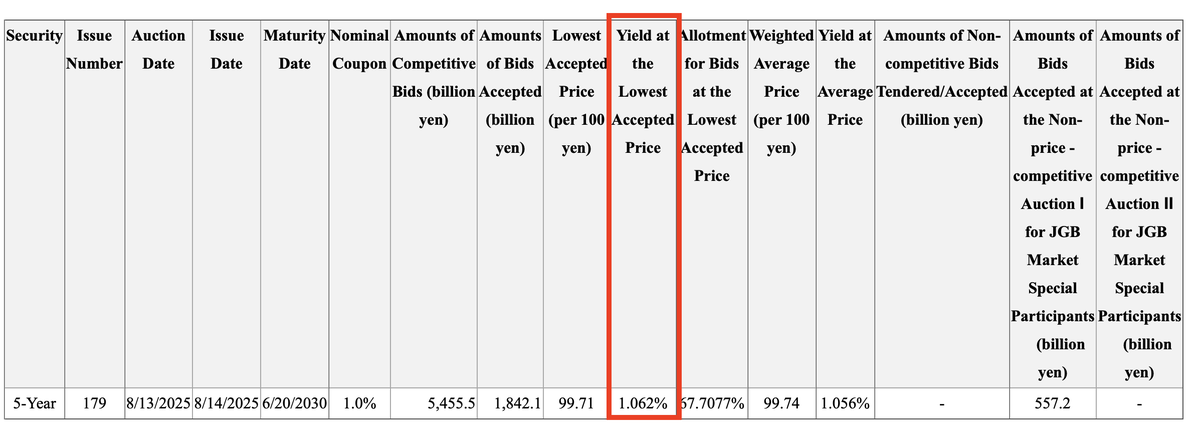
That’s why the lowest accepted price called the cutoff was 99.71 yen.
When bond yields (interest rates) are higher than the coupon, prices drop to make up the difference.
This is Bond Rule #1: prices go down when yields go up.
When bond yields (interest rates) are higher than the coupon, prices drop to make up the difference.
This is Bond Rule #1: prices go down when yields go up.
The weighted average price basically the average deal everyone got was 99.74 yen.
The difference between the average and the cutoff is called the tail. Today’s tail was 0.03 yen.
Bigger tails mean some buyers are demanding much higher yields than others, a sign of weaker demand.
The difference between the average and the cutoff is called the tail. Today’s tail was 0.03 yen.
Bigger tails mean some buyers are demanding much higher yields than others, a sign of weaker demand.
And even at the cutoff price, not everyone got what they wanted.
Only 67.7% of bids at that price were accepted.
Think of it like a ticket line where a third of people were told, “Sorry, sold out.”
Only 67.7% of bids at that price were accepted.
Think of it like a ticket line where a third of people were told, “Sorry, sold out.”
Who was buying? Mostly competitive bidders big institutions like banks and insurers that set their own price.
Non-competitive bids where buyers just say “give me whatever the average price is” were only ¥557 billion.
That’s a small number, so smaller investors weren’t very involved.
Non-competitive bids where buyers just say “give me whatever the average price is” were only ¥557 billion.
That’s a small number, so smaller investors weren’t very involved.
So why wasn’t demand stronger?
Because investors think the Bank of Japan (BoJ) is going to raise interest rates again.
If rates go up in the future, new bonds will pay more interest which makes today’s lower-paying bonds less attractive.
Because investors think the Bank of Japan (BoJ) is going to raise interest rates again.
If rates go up in the future, new bonds will pay more interest which makes today’s lower-paying bonds less attractive.
Right now, markets are fully expecting a 0.25% BoJ rate hike by spring 2026.
For context, Japan spent decades at near-zero rates.
They only raised to 0.5% earlier this year. So a 0.25% move is big in Japanese terms.
For context, Japan spent decades at near-zero rates.
They only raised to 0.5% earlier this year. So a 0.25% move is big in Japanese terms.
The BoJ also recently relaxed Yield Curve Control, a policy that used to cap 10-year yields at around 1%.
With that cap loosened, bond yields across different maturities (including 5-years) can rise more freely meaning prices can fall more.
With that cap loosened, bond yields across different maturities (including 5-years) can rise more freely meaning prices can fall more.
There’s another problem: liquidity.
Liquidity means how easy it is to buy and sell without moving the price too much.
Recently, some Japanese bonds like the 10Y have gone a day without trading. That’s like a store being “open” but no one shopping.
Liquidity means how easy it is to buy and sell without moving the price too much.
Recently, some Japanese bonds like the 10Y have gone a day without trading. That’s like a store being “open” but no one shopping.
Low liquidity makes investors nervous.
If you’re not sure you can resell the bond later without taking a hit, you’ll demand a better deal upfront (higher yield, lower price).
That hurts auction demand.
If you’re not sure you can resell the bond later without taking a hit, you’ll demand a better deal upfront (higher yield, lower price).
That hurts auction demand.
BoJ and the Finance Ministry have tried fixes: slowing down how quickly they reduce bond purchases, issuing more floating-rate bonds, and letting dealers borrow more bonds to trade.
But confidence is still shaky.
But confidence is still shaky.
Big domestic buyers like life insurers are hesitant because they’re sitting on huge paper losses from earlier yield rises.
Banks are also careful holding long-term bonds uses up capital under banking rules, so they prefer shorter 2–3 year bonds.
Banks are also careful holding long-term bonds uses up capital under banking rules, so they prefer shorter 2–3 year bonds.
Foreign buyers? Sometimes Japanese bonds are attractive when “hedged” into dollars or euros (using currency contracts).
But recently, a stronger yen and changing rate gaps have reduced that advantage so fewer foreign bids came in.
But recently, a stronger yen and changing rate gaps have reduced that advantage so fewer foreign bids came in.
And the macro backdrop matters: Japan imports most of its energy.
Weaker yen + higher oil prices → import costs rise → inflation goes up → yields rise.
Stronger yen + lower oil prices → inflation cools → yields stabilize.
Weaker yen + higher oil prices → import costs rise → inflation goes up → yields rise.
Stronger yen + lower oil prices → inflation cools → yields stabilize.
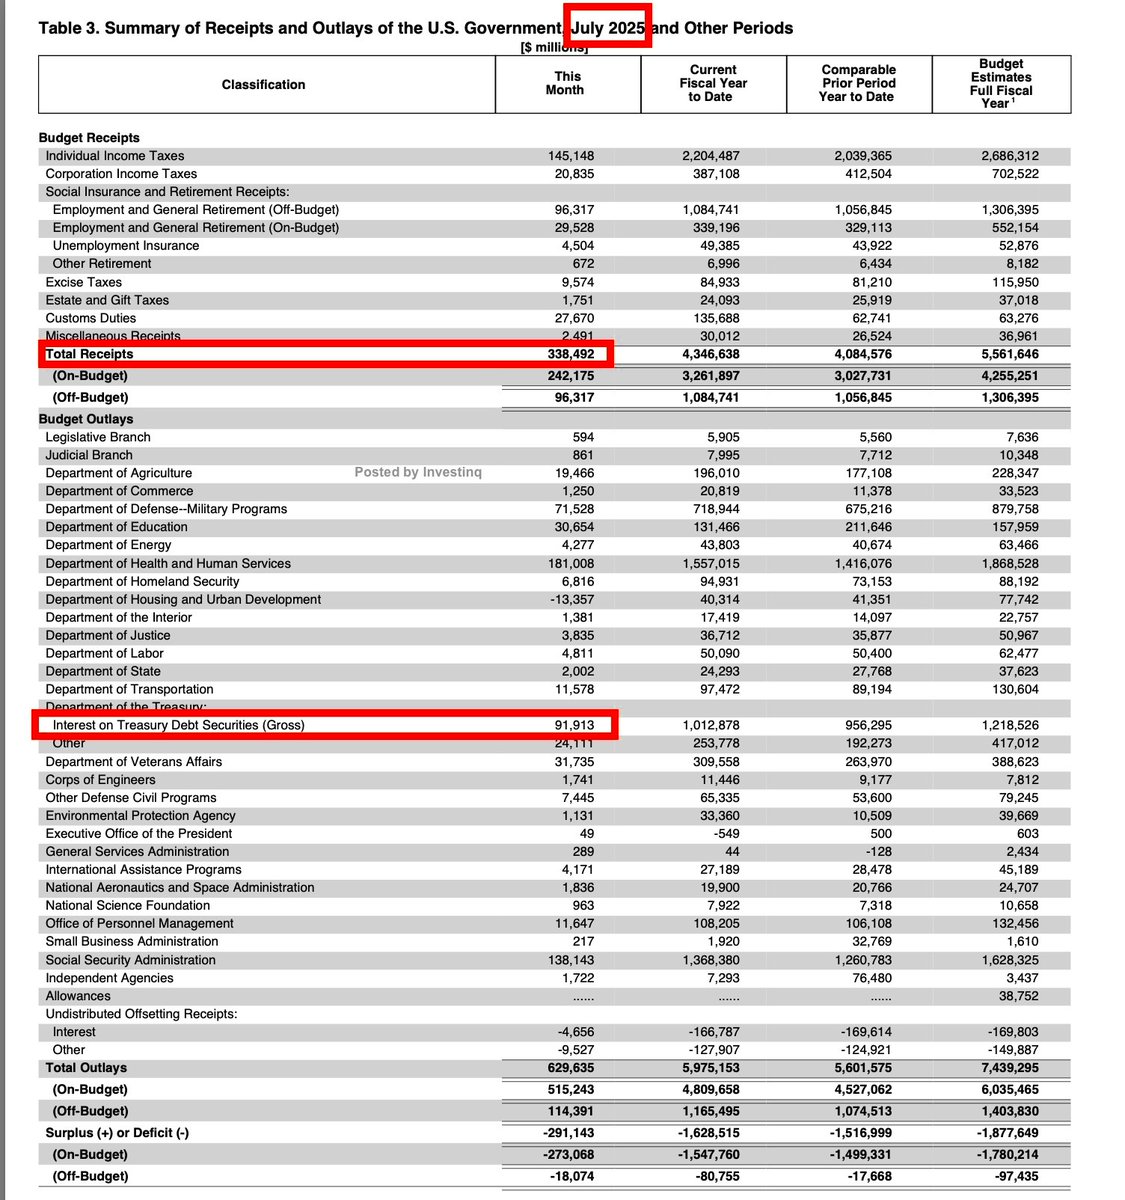
On top of that, Japan’s government debt is massive: ¥1,350 trillion (~250% of GDP).
Every 0.10% rise in interest rates adds ¥1.35 trillion to annual interest costs.
That’s why rising yields are a fiscal headache.
Every 0.10% rise in interest rates adds ¥1.35 trillion to annual interest costs.
That’s why rising yields are a fiscal headache.
Why should you care outside Japan?
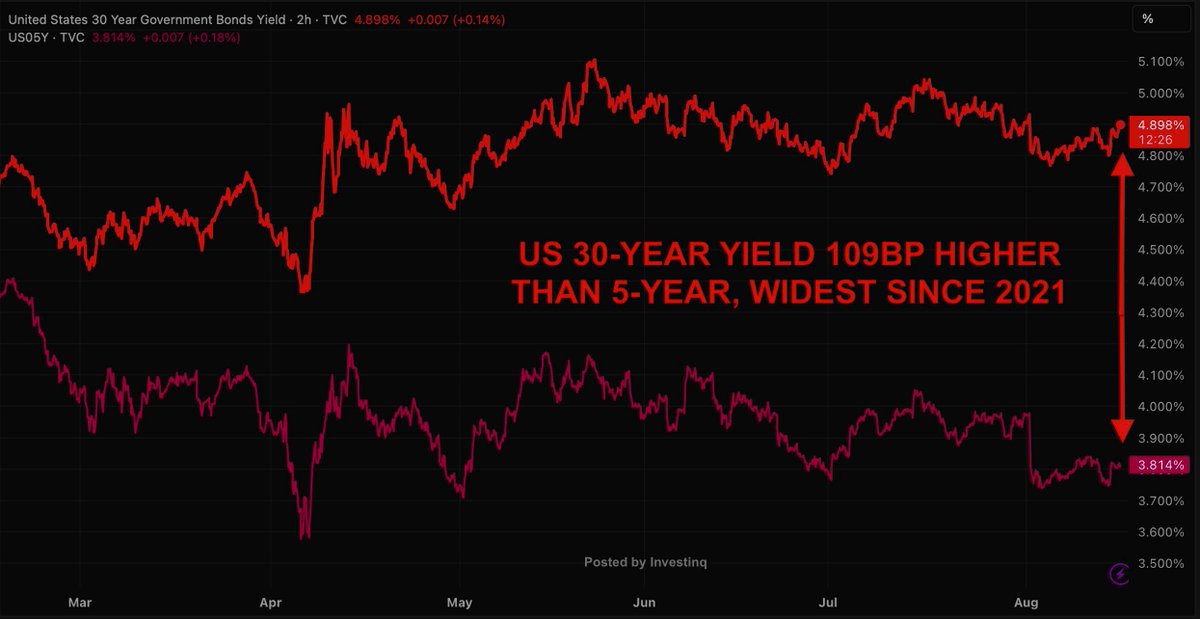
If Japanese yields rise, Japanese investors may pull money out of U.S. Treasuries and buy domestic bonds instead.
That could push U.S. interest rates higher.
If Japanese yields rise, Japanese investors may pull money out of U.S. Treasuries and buy domestic bonds instead.
That could push U.S. interest rates higher.
There’s also the FX impact: If BoJ hikes rates and the yen strengthens, it changes the math for global investors.
Stronger yen = cheaper imports for the U.S. (good for inflation)
But it can hurt U.S. exporters (their goods become more expensive abroad).
Stronger yen = cheaper imports for the U.S. (good for inflation)
But it can hurt U.S. exporters (their goods become more expensive abroad).
Possible scenarios:
• BoJ hikes twice → 5-year yields jump to 1.3–1.4% → more global rate pressure
• Inflation stays above 3% → yields hit 1.5–2% → borrowing costs spike
• BoJ pauses → yields drop → demand returns
• Foreign buyers pull out → locals must buy at higher yields
• BoJ hikes twice → 5-year yields jump to 1.3–1.4% → more global rate pressure
• Inflation stays above 3% → yields hit 1.5–2% → borrowing costs spike
• BoJ pauses → yields drop → demand returns
• Foreign buyers pull out → locals must buy at higher yields
Bottom line: Not a disaster, the bonds still sold but investors clearly want either higher yields or a friendlier BoJ before buying more 5-years.
And when Japan’s bond market wobbles, the ripples travel fast.
And when Japan’s bond market wobbles, the ripples travel fast.
If you found these insights valuable: Sign up for my FREE newsletter! thestockmarket.news
I hope you've found this thread helpful.
Follow me @_Investinq for more.
Like/Repost the quote below if you can:
Follow me @_Investinq for more.
Like/Repost the quote below if you can:
https://x.com/_investinq/status/1955720521452040269?s=46
• • •
Missing some Tweet in this thread? You can try to
force a refresh