Nick Gerli Profile picture
Aug 14 12 tweets 3 min read Read on X
Immigration has dropped to essentially zero.

What will the housing market impact on demand be? Image
1) According to John Burns, from 2022-24, all of the growth in renter households came from immigration.

While only 5% of buyer demand came from immigration. Image
2) Suggesting there could be some headwinds for the rental market as the precipitous drop-off in immigration filters through to apartment demand.

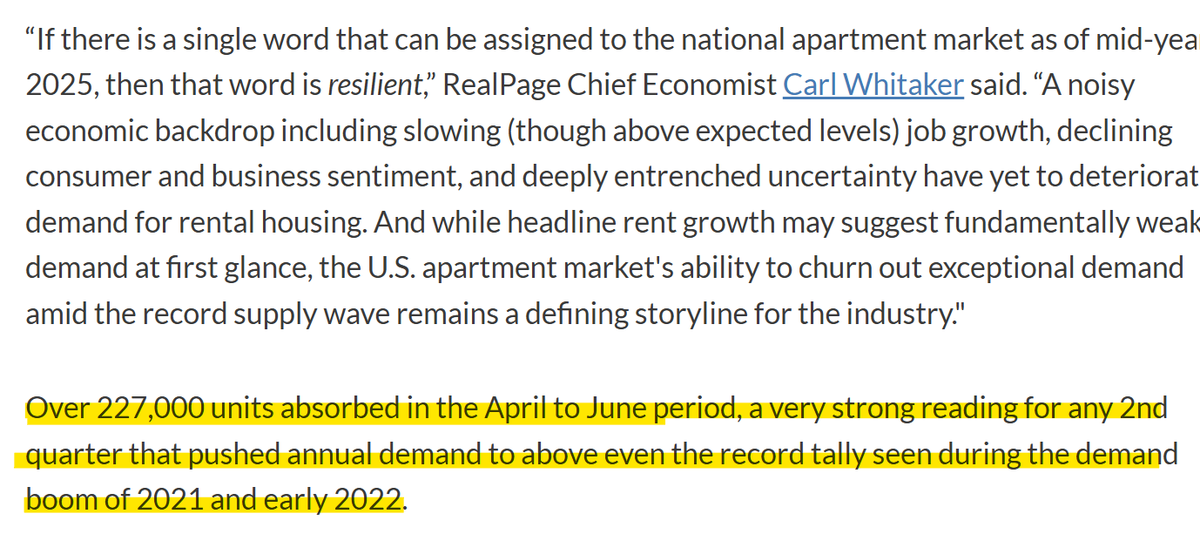
However, to date in 2025, rental absorption has been strong.
3) According to RealPage, there were 227k apartment units absorbed in Q2 2025, which was above last year.

And allowed the trailing 12 absorption figure to hit a record.

Something many apartment landlords are celebrating today. Image
4) I'm seeing this on the ground in a market like Nashville.

Many of the communities that were 50-60% occupied last year are now 80-90% occupied.

Especially in Class A Product.
5) But I have a sneaking suspicion these demand levels won't last, given the backdrop of collapsing immigration.

We went from having around 200k border crossings per month for 3 years, to less than 10k.

That's a 95% reduction.
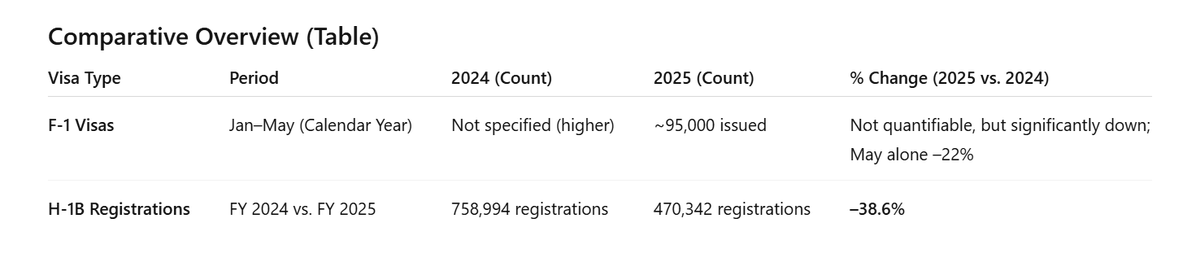
6) There also appear to be declines in the number of student and H1B visas issued so far in 2025 compared to 2024, at least according to ChatGPT. Image
7) Suggesting that there will be a hit to apartment rental demand at some point in the future.

The question is when. And how big will the negative impact be?

An immigrant's journey into finding an apartment in the U.S. isn't straightforward, and there could be a significant lag between coming into the U.S. and applying for an apartment.
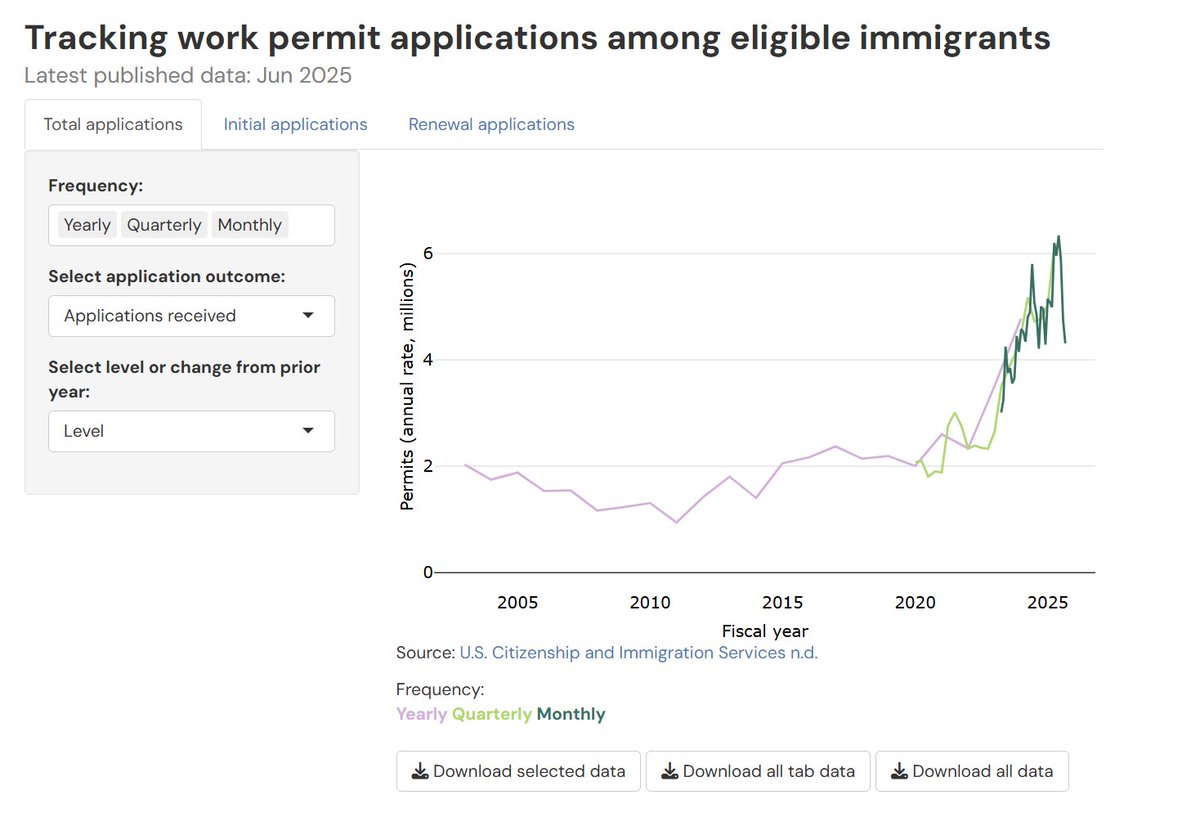
8) We're seeing this lag play out with work permit applications.

As of June 2025, there were over 4 million seasonally adjusted, annualized work permit applications from immigrants.

This is down from the peak January, but still way above the long-term norm of 2 million.

Suggesting that the huge influx of immigration from 2021-2024 is still rippling through the economy in terms of labor supply and apartment demand.

Source: Brookings InstitutionImage
9) Based on this, I suspect apartment demand still has another 6 months of resilience from the surge in immigration that occurred in 2021-24.

But once the page turns to 2026, we could start seeing meaningful slowdowns in renter absorption, particularly in markets that are heavily immigrant-dependent.
10) The market for sale isn't really impacted by this.

According to John Burns, 95% of for-sale demand from 2022-24 was native born Americans.

Only 5% was immigrants.
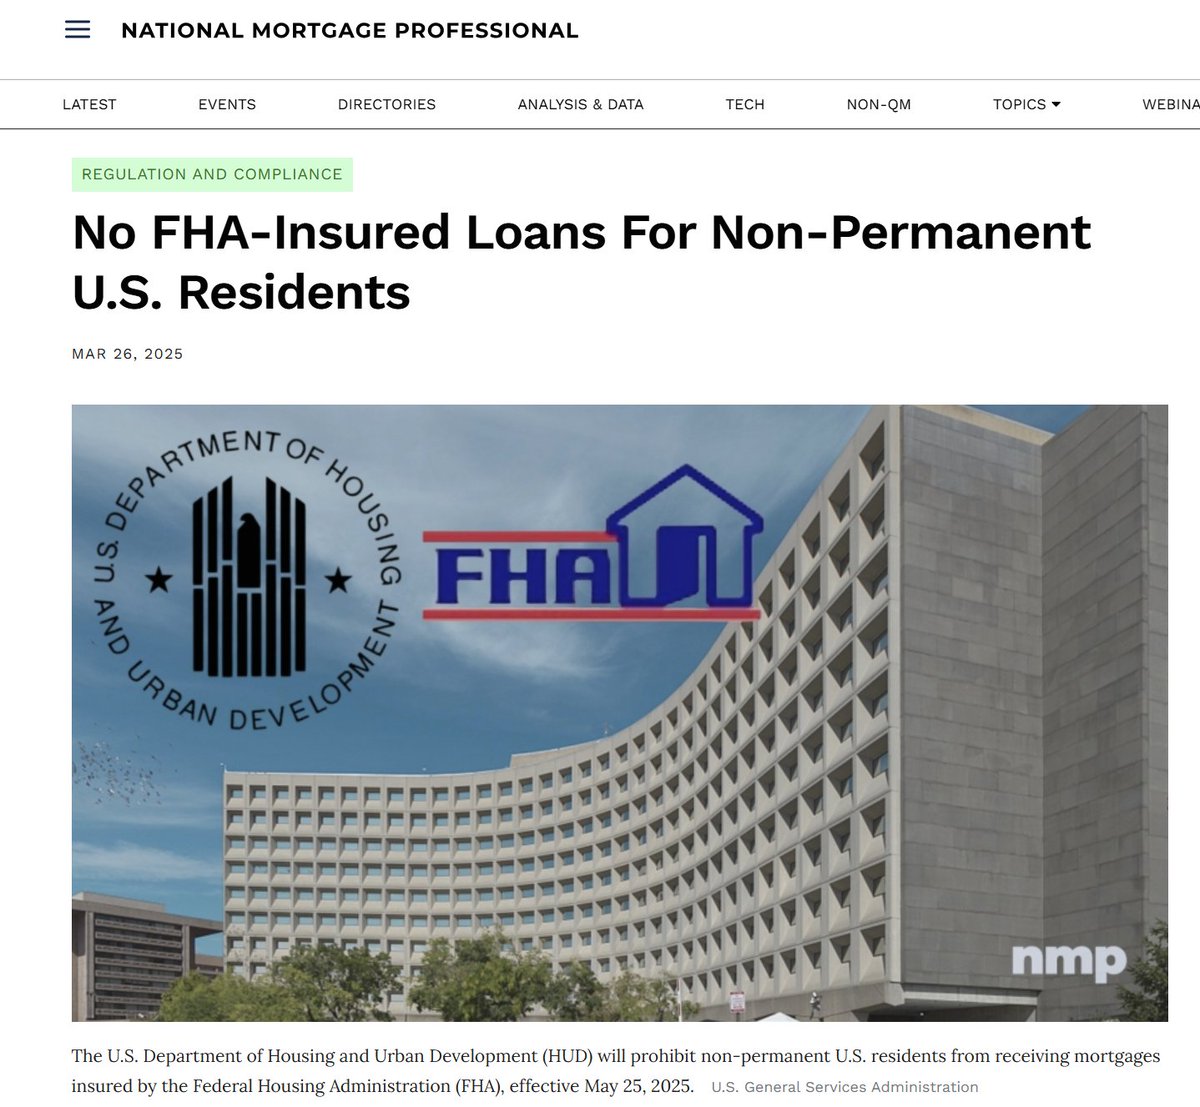
11) One thing to note, however, is that starting in May 2025 the Trump administration suspended the ability of non-permanent residents to apply for FHA mortgages.

So there could be a negative demand impact from that decision, as it relates more to the existing immigrant population than new immigrants.Image

• • •

Missing some Tweet in this thread? You can try to force a refresh
 

Keep Current with Nick Gerli

Nick Gerli Profile picture

Stay in touch and get notified when new unrolls are available from this author!

Read all threads

This Thread may be Removed Anytime!

PDF

Twitter may remove this content at anytime! Save it as PDF for later use!

Try unrolling a thread yourself!

how to unroll video
  1. Follow @ThreadReaderApp to mention us!

  2. From a Twitter thread mention us with a keyword "unroll"
@threadreaderapp unroll

Practice here first or read more on our help page!

More from @nickgerli1

Aug 13
We did rate cuts last year.

It didn't work.
1) The myopia among many people in finance and real estate right now regarding round two of rate cuts is shocking.

Once again, people are getting jazzed up to think the Fed will "save the housing market".

Somehow forgetting that we went through this already last year.
2) The Fed cut interest rates by 100 basis points from September 2024 to December 2024, lowering the short-term policy rate from 5.5% to 4.5% (approx).

The result?

Lower homebuyer demand in 2025 than in 2024.
Read 12 tweets
Aug 8
North Port, Florida.

Getting closer to fairly valued.

Once the green line crosses below the grey line, it's a "buy signal". Image
1) A good question is how far undervalued prices could go.

In the last downturn in North Port, values became around 27% undervalued. Image
2) This isn't in my base case projections this time around, as I don't think there will be as much mortgage distress in North Port this time around.

However - I think it's conceivable values continue dropping in this market for several years.

So even after the "buy signal" is tripped, there could be some downside to go.
Read 4 tweets
Aug 6
Dallas housing supply is through the roof.

Active listings measured almost 32,000 in July 2025.

The average for July going back to 2017 is only 20,000.

60% more inventory than normal. Image
1) The inventory spike is happening pretty much everywhere in DFW.

All major counties are now above a 50% inventory surplus. Image
2) Great news for DFW homebuyers.

There's the most selection the market has had since the tail end of the last downturn in 2011-12.

Meanwhile, values are now going down on a year-over-year basis.
Read 8 tweets
Aug 3
The biggest problem in today's housing market is not mortgage rates.

Rather - it's homeowners clutching onto an unsustainable amount of homeowner equity.

Today, homeowners have over $34 trillion in equity on their houses - more than 2x higher than the 2006 bubble.

It's the biggest homeowner equity bubble ever. And it's keeping hard-working Americans locked out from buying a house (because prices are too high).

Sellers who come to market today are often refusing to cut the price to the market-clearing price, and even de-listing their homes. This is further perpetuating the worst housing affordability crisis we've seen in 40 years.

The solution: home prices need to correct, by around 15-20% on a national basis, to bring the market back into balance with homebuyer incomes and interest rates. This type of correction will not be that damaging to the economy, since most homeowners would still have plenty of equity. (in this scenario, homeowner equity would drop to around $25 trillion - still almost double 2006).

It's important that lenders, realtors, investors, and government officials understand that unsustainable prices and homeowner equity levels are what is creating the worst home sales transaction market in decades.

Not mortgage rates.Image
1) For perspective, today's homeowner equity levels are north of 115% of GDP, the highest level of all-time.

Indicating that home prices and equity growth have far outstripped the growth of the economy, incomes, and inflation.

It's not sustainable, and needs to correct. Image
2) There's a whole host of reasons why this happened, the most obvious being Fed manipulation of the interest rate cycle over the last 20+ years.

Starting with the Fed Chair in 2001, the Fed became overly accommodative, lowering interest rates well below the rate of inflation.

This resulted in excess home price appreciation.
Read 15 tweets
Jul 31
Nashville's housing market was previously one of the biggest boom markets.

Now it has one of the biggest gluts of unsold inventory of any metro.

With nearly 11,000 homes for sale, the highest level in almost 10 years.

Nashville's inventory surplus is now at 62.7% above the long-term average. Indicative of a market that is in correction.Image
1) Home values in Nashville dropped -0.18% in June 2025 every month.

And the year-over-year value metrics in Nashville are now essentially flat, at +0.1% June 2024-25.

At Reventure, we are forecasting a -7.2% over the next 12 months.
2) The true story in Nashville is a normalization in demand to go along with a pandemic boomerang effect that is resulting in quite a people who moved to the city during the pandemic now selling their houses.

Of course - there is also a lot of new construction, of both houses and apartments, that is putting downward pressure on the market.
Read 13 tweets
Jul 28
Inventory in Nashville is through the roof.

Some neighborhoods now have 115% more supply than normal.

This excess supply is largely coming from investors selling, combined with a reduction in buyer demand.

Don't be surprised if home values across most of Nashville flip negative over the next 12 months.

Access the inventory map at reventure.app.Image
1) The supply run-up in some of these ZIP codes is wild.

Pre-pandemic inventory of 100 homes.

Now there's 300 homes. Image
2) Values are starting to to drop on a month-over-month basis, and are even negative in about half of Nashville ZIPs on a YoY basis.

However, there's huge bifurcation in how the market is trending.
Read 9 tweets

Did Thread Reader help you today?

Support us! We are indie developers!


This site is made by just two indie developers on a laptop doing marketing, support and development! Read more about the story.

Become a Premium Member ($3/month or $30/year) and get exclusive features!

Become Premium

Don't want to be a Premium member but still want to support us?

Make a small donation by buying us coffee ($5) or help with server cost ($10)

Donate via Paypal

Or Donate anonymously using crypto!

Ethereum

0xfe58350B80634f60Fa6Dc149a72b4DFbc17D341E copy

Bitcoin

3ATGMxNzCUFzxpMCHL5sWSt4DVtS8UqXpi copy

Thank you for your support!

Follow Us!

:(