In this THREAD I will explain “Trading Indicators”
1. RSI
2. Elliott Wave
3. Bollinger Bands
🧵(1/17)
1. RSI
2. Elliott Wave
3. Bollinger Bands
🧵(1/17)

1. RSI
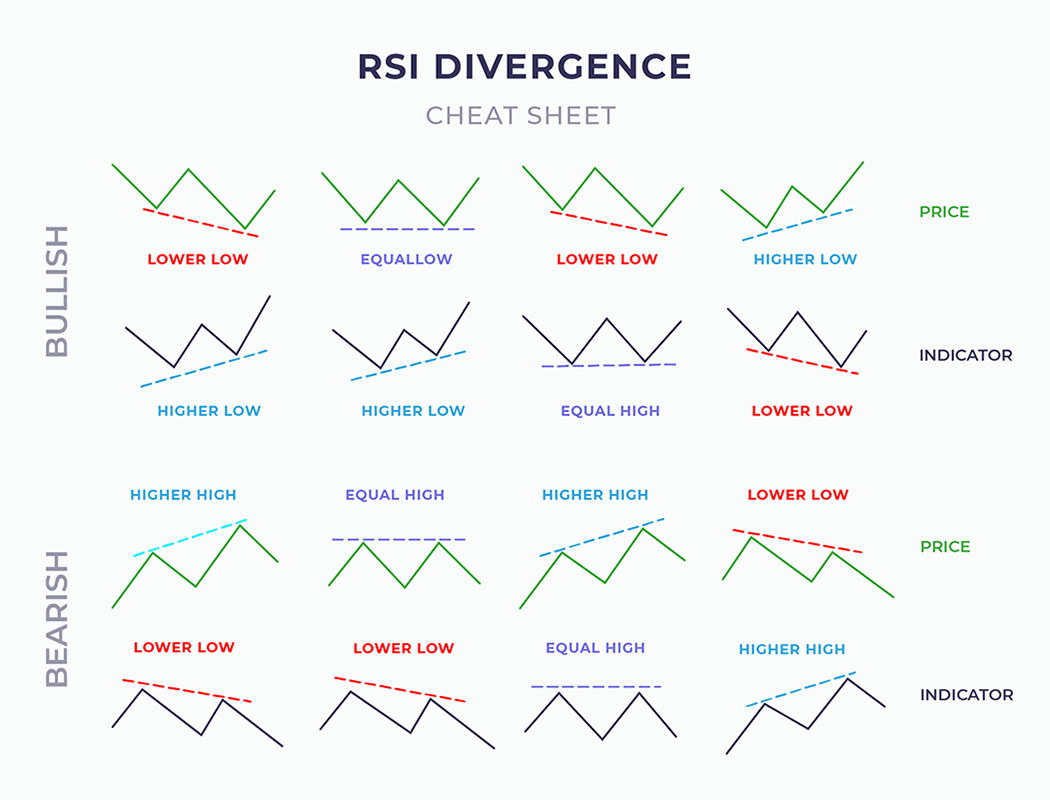
Divergence appears when the RSI's highs or lows diverge from price
If the price makes new lows but the RSI bottoms at higher levels, it signals bullish divergence
If the price makes new highs but the RSI peaks at lower levels, it signals bearish divergence
Divergence appears when the RSI's highs or lows diverge from price
If the price makes new lows but the RSI bottoms at higher levels, it signals bullish divergence
If the price makes new highs but the RSI peaks at lower levels, it signals bearish divergence

1.1 RSI
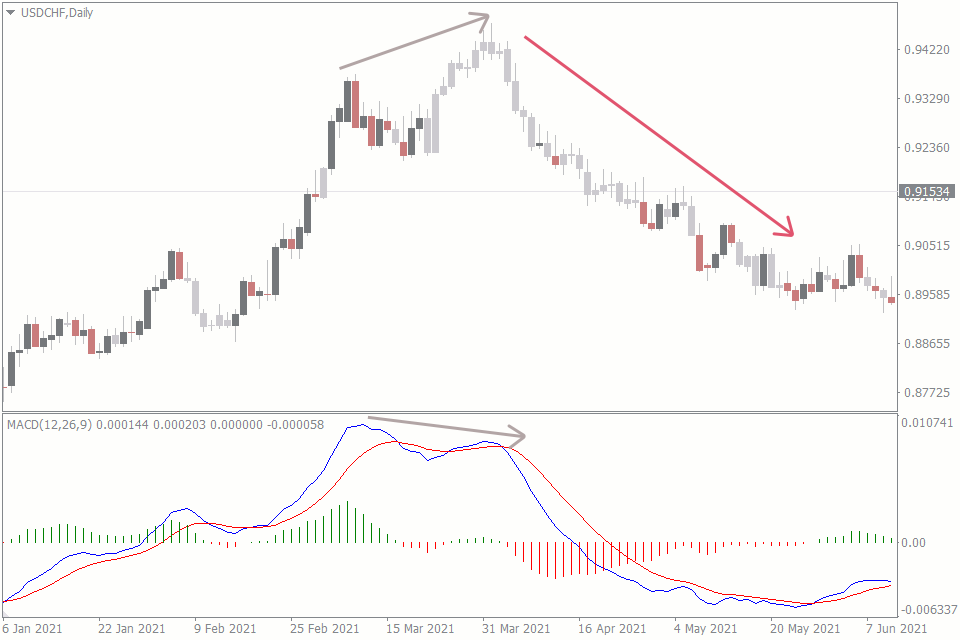
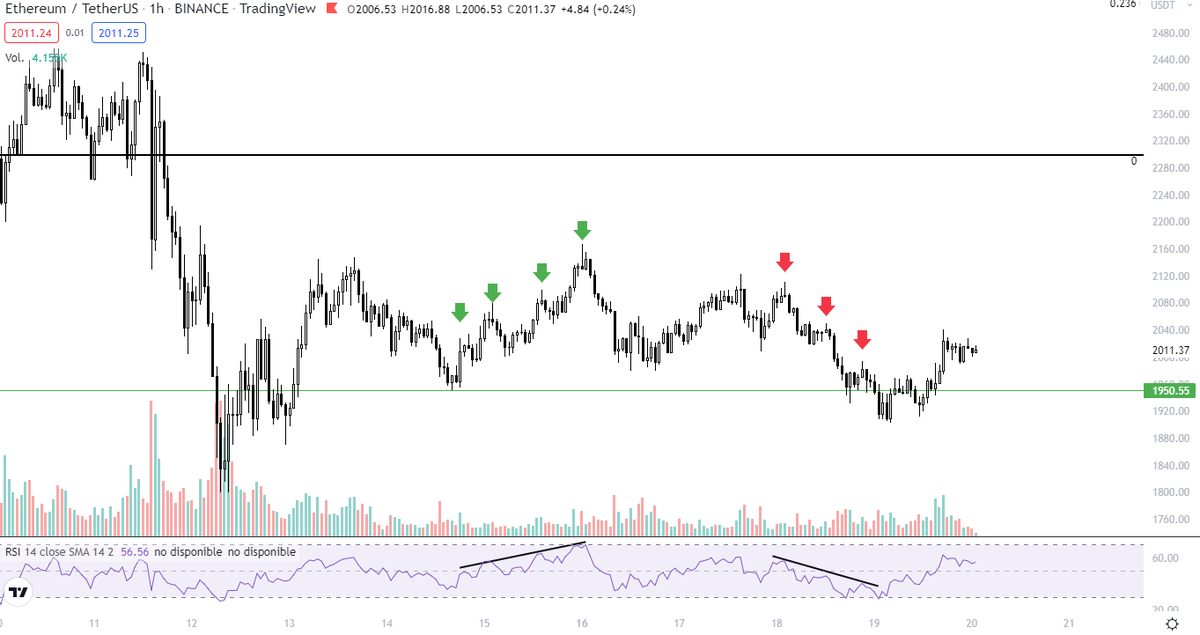
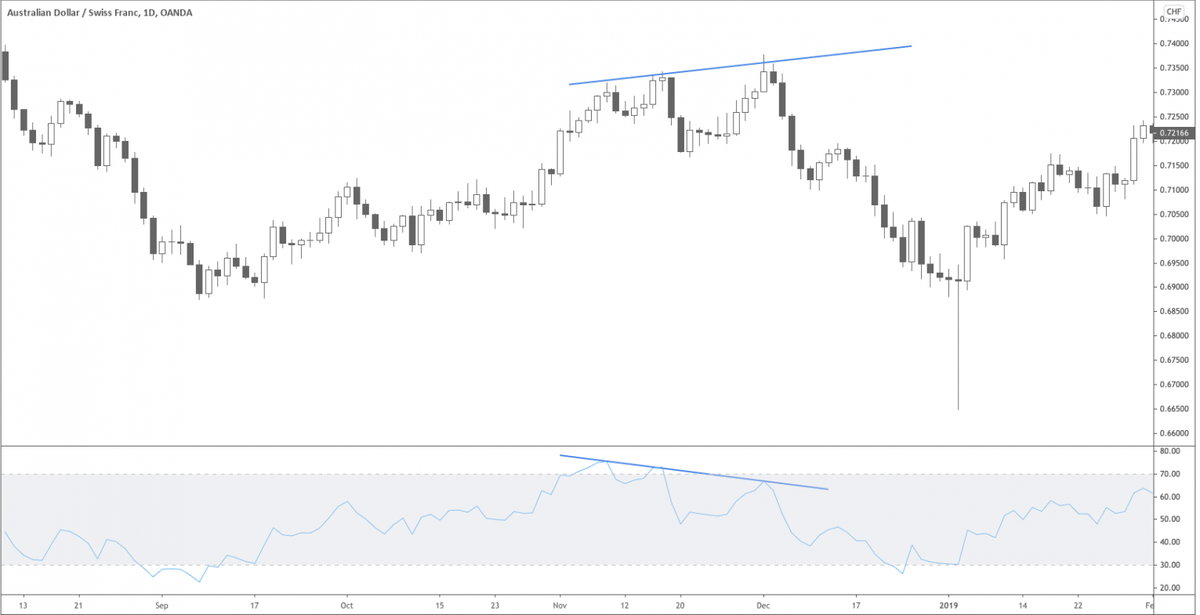
Bearish divergence in the RSI occurs when the price of an asset makes a Higher High, but the RSI makes a Lower High.
This indicates weakening buying momentum and suggests a potential downward price reversal.
Bearish divergence in the RSI occurs when the price of an asset makes a Higher High, but the RSI makes a Lower High.
This indicates weakening buying momentum and suggests a potential downward price reversal.
1.2 RSI
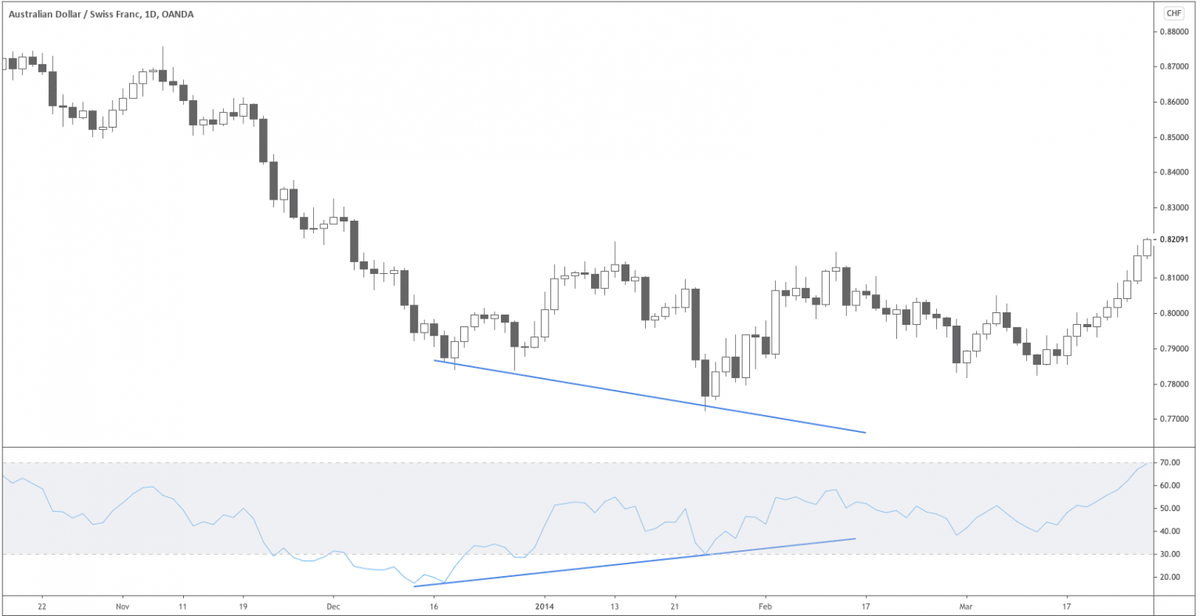
Bullish RSI Divergence: Occurs when prices form lower lows, but RSI makes higher lows.
This indicates decreasing selling pressure and signals potential upward reversals.
Volume is a really important indicator to use as confirmation.
Bullish RSI Divergence: Occurs when prices form lower lows, but RSI makes higher lows.
This indicates decreasing selling pressure and signals potential upward reversals.
Volume is a really important indicator to use as confirmation.
1.3 RSI
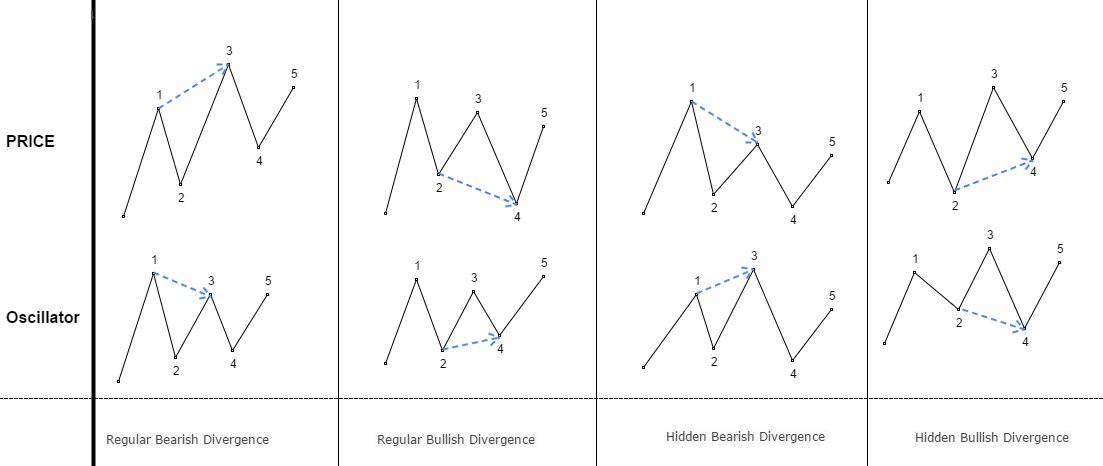
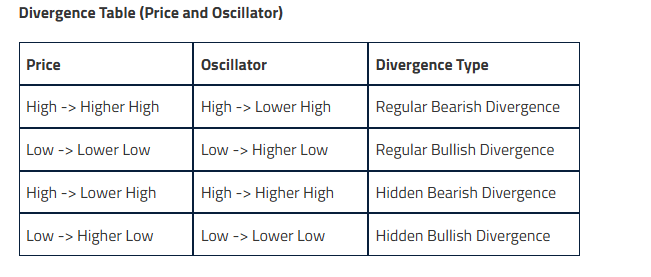
There are 4 types of divergence
Regular Bullish Divergence
Regular Bearish Divergence
Hidden Bullish Divergence
Hidden Bearish Divergence
Which are broadly classified into two categories:
Regular or Classic Divergence
Hidden Divergence
There are 4 types of divergence
Regular Bullish Divergence
Regular Bearish Divergence
Hidden Bullish Divergence
Hidden Bearish Divergence
Which are broadly classified into two categories:
Regular or Classic Divergence
Hidden Divergence
1.4 RSI
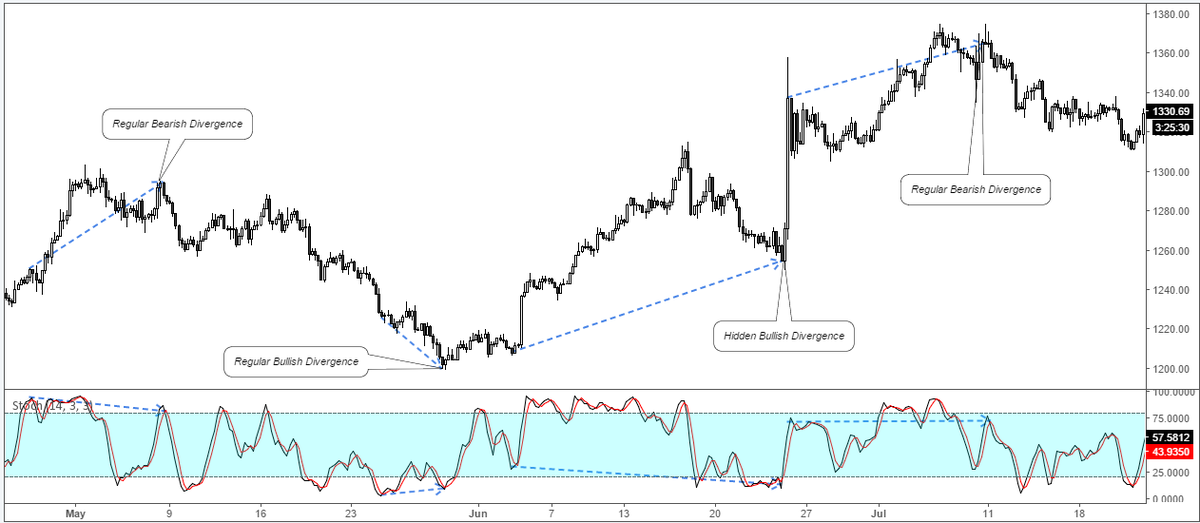
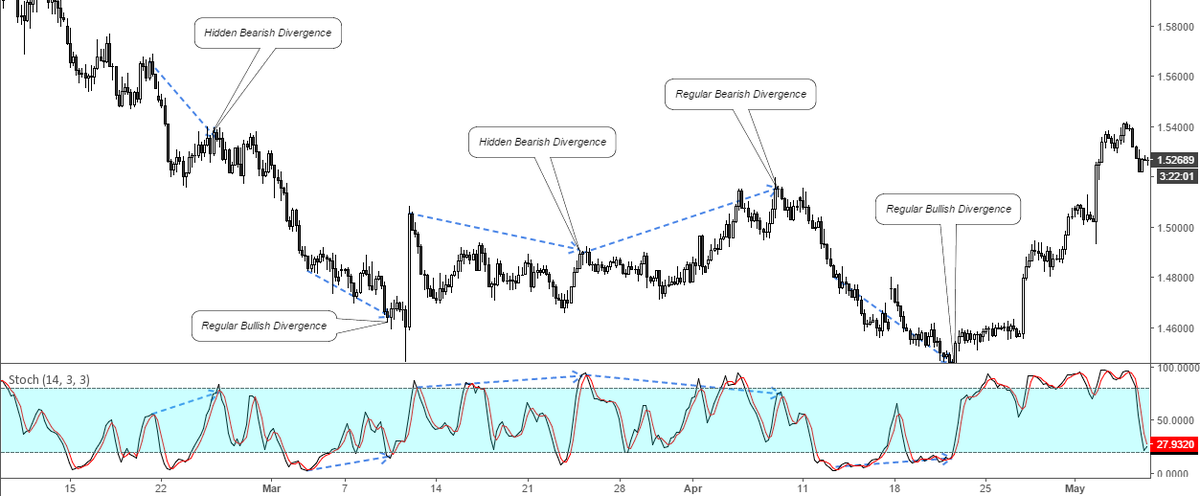
The following two charts show examples of the above four types of divergences that occur on the price chart.
In the examples, I make use of the Stochastics oscillator.
But you can use other Indicators such as RSI and MACD to identify the divergences.
The following two charts show examples of the above four types of divergences that occur on the price chart.
In the examples, I make use of the Stochastics oscillator.
But you can use other Indicators such as RSI and MACD to identify the divergences.
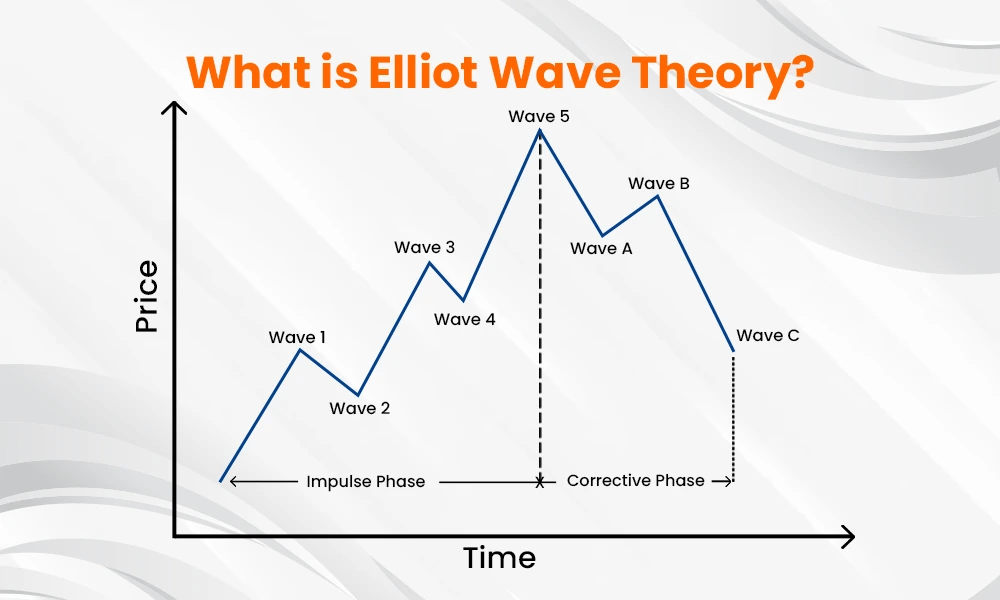
2. Elliott Wave
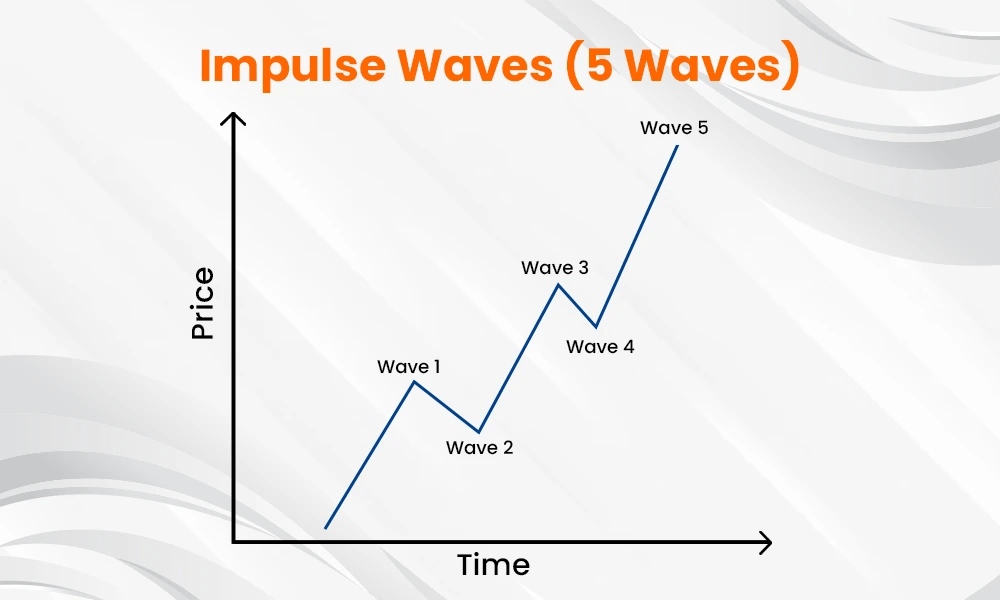
The Elliott Wave Theory generally examines price movements in the direction of the main trend in five waves, called impulse waves.
And trend corrections in three waves, called corrective waves.
The Elliott Wave Theory generally examines price movements in the direction of the main trend in five waves, called impulse waves.
And trend corrections in three waves, called corrective waves.
2.1 Elliott Wave
The impulse waves are the core of Elliott Wave Theory and move in the direction of the main trend.
Whether it is upward (bullish) or downward (bearish)
Impulse waves consist of five distinct waves
The impulse waves are the core of Elliott Wave Theory and move in the direction of the main trend.
Whether it is upward (bullish) or downward (bearish)
Impulse waves consist of five distinct waves
2.2 Elliott Wave
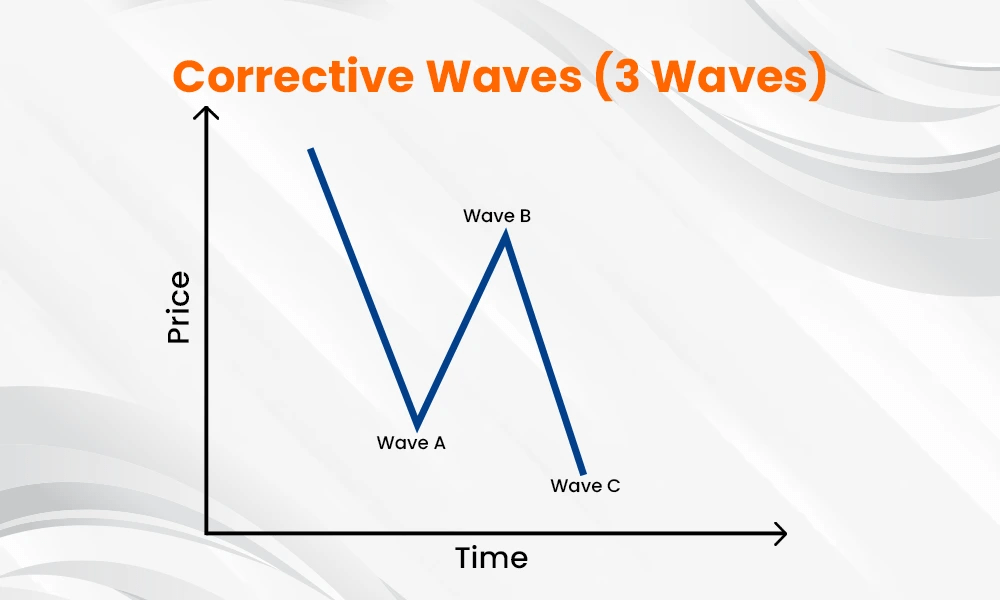
Once the impulse wave is completed, the market goes through a corrective phase, which consists of three waves (A, B, and C).
This phase moves against the primary trend and corrects the gains or losses of the previous trend.
Once the impulse wave is completed, the market goes through a corrective phase, which consists of three waves (A, B, and C).
This phase moves against the primary trend and corrects the gains or losses of the previous trend.
2.3 Elliott Wave
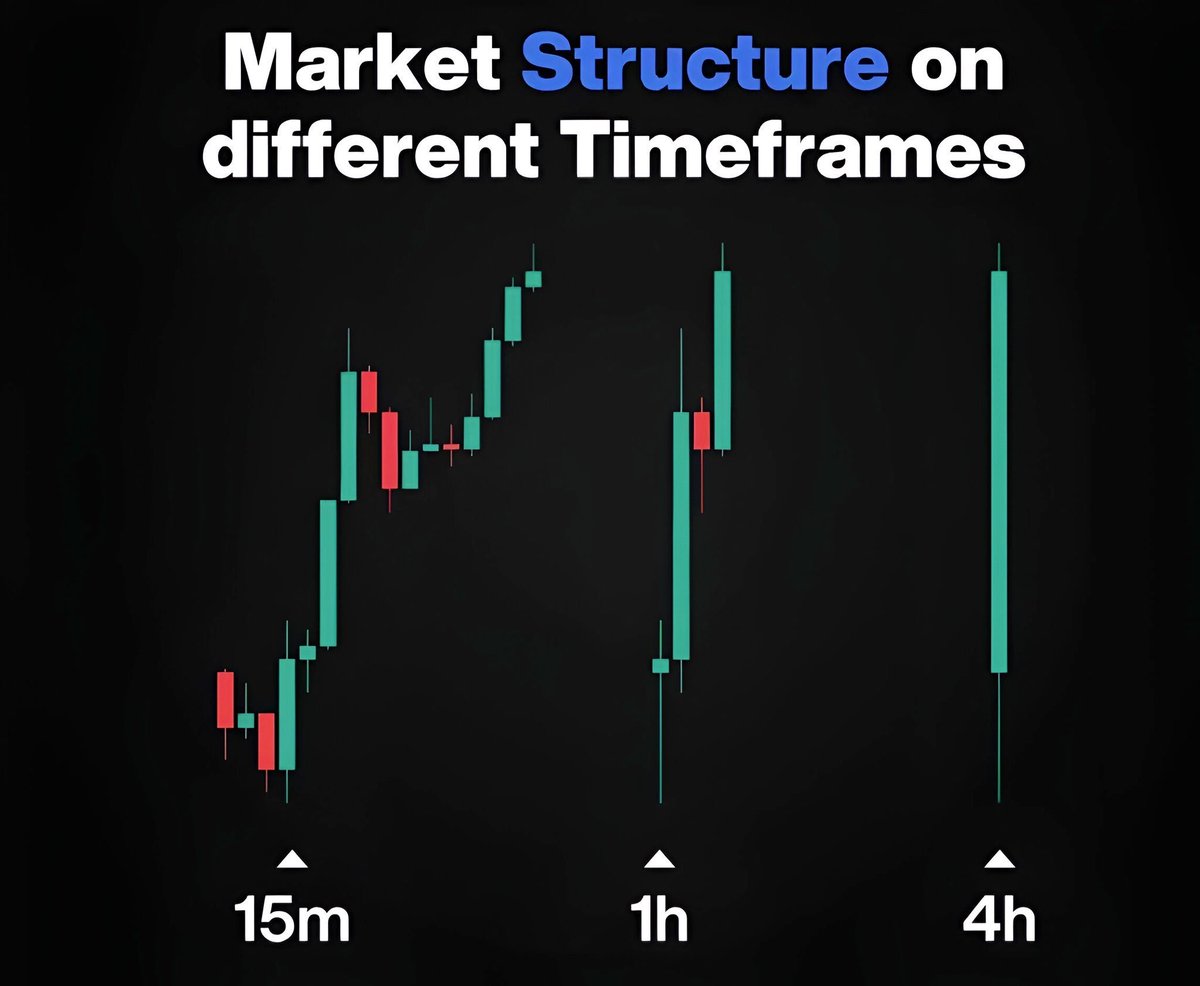
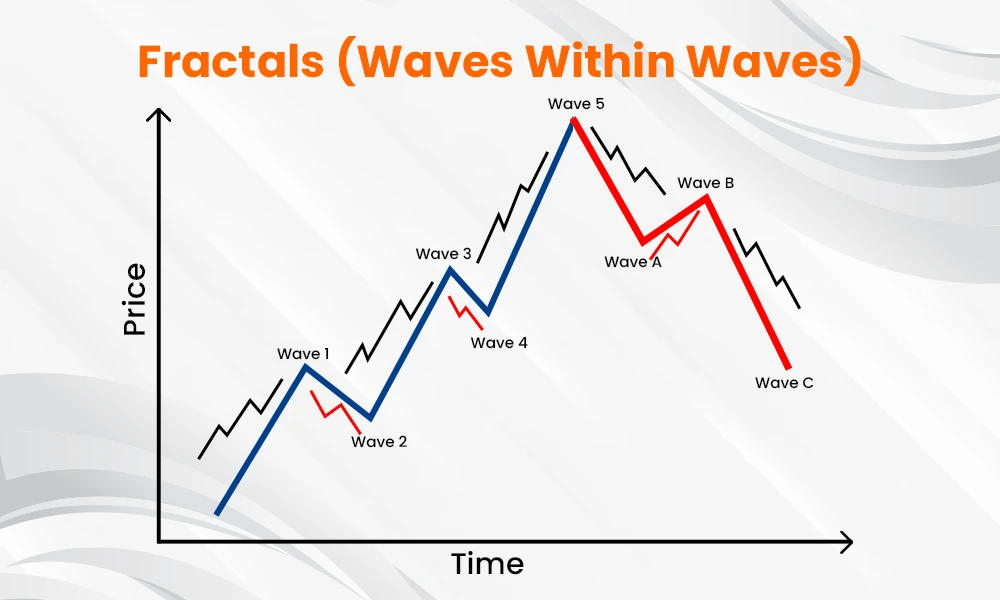
Waves are fractal which implies that the same patterns occur in all time frames.
These patterns repeat at different degrees of trend, from very short-term to very long-term, making them appear similar across various timeframes.
Waves are fractal which implies that the same patterns occur in all time frames.
These patterns repeat at different degrees of trend, from very short-term to very long-term, making them appear similar across various timeframes.
2.4 Elliott Wave
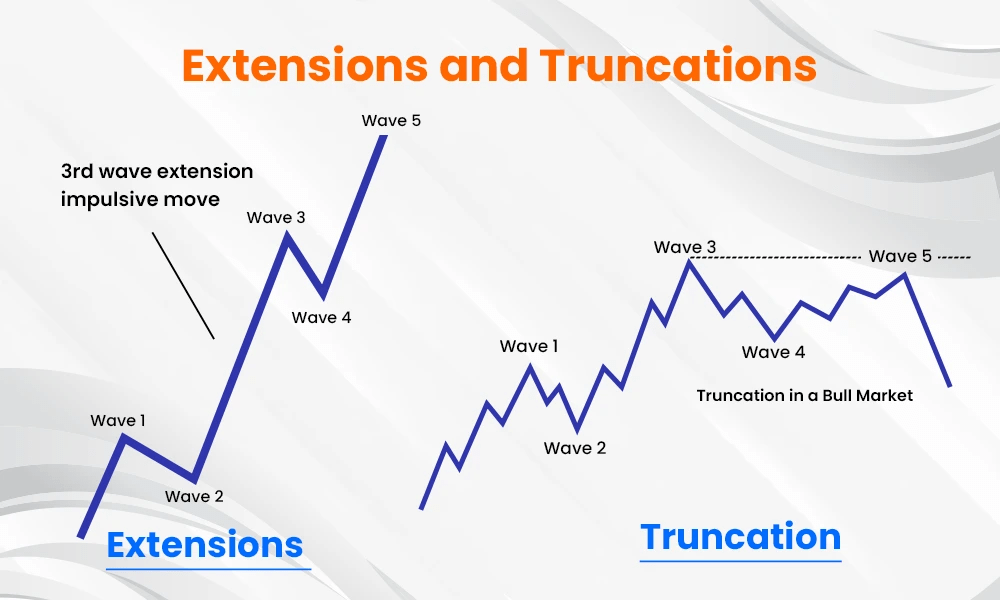
Sometimes one of the impulse waves is extended which makes it much longer than the others.
This typically happens in Wave 3, which is known for being the most powerful wave in a trend.
In this image is illustrated Extensions and Truncations
Sometimes one of the impulse waves is extended which makes it much longer than the others.
This typically happens in Wave 3, which is known for being the most powerful wave in a trend.
In this image is illustrated Extensions and Truncations
2.5 Elliott Wave
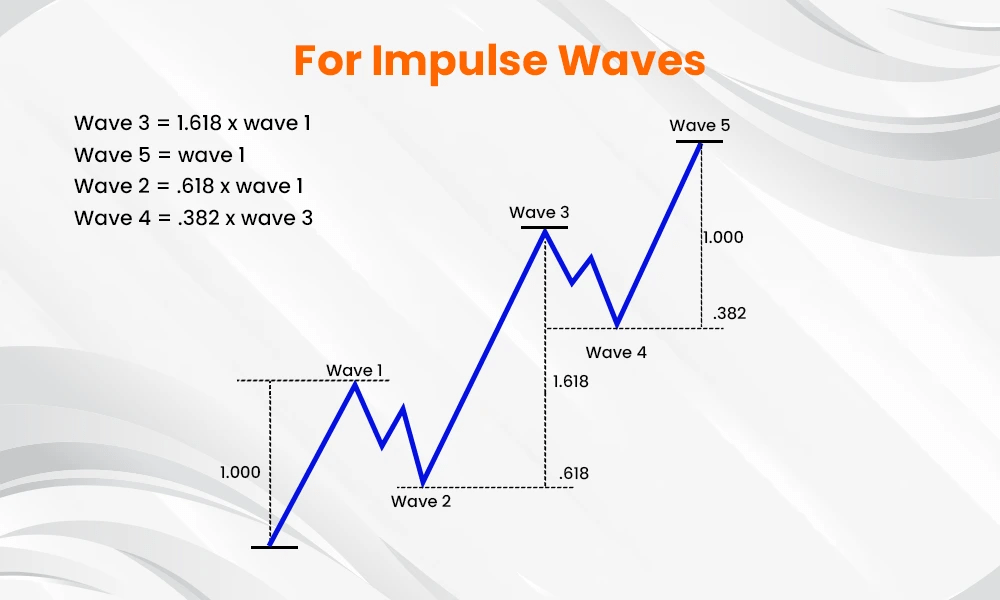
Impulse Waves:
Wave 1 starts the trend; Fibonacci is rarely used
Wave 2 retraces 50–78.6% of Wave 1
Wave 3 is strongest, often extending 161.8–423.6%
Wave 4 is shallow, retracing 23.6–38.2% of Wave 3
Wave 5 targets 61.8–161.8% of Wave 1 in strong trends
Impulse Waves:
Wave 1 starts the trend; Fibonacci is rarely used
Wave 2 retraces 50–78.6% of Wave 1
Wave 3 is strongest, often extending 161.8–423.6%
Wave 4 is shallow, retracing 23.6–38.2% of Wave 3
Wave 5 targets 61.8–161.8% of Wave 1 in strong trends
2.6 Elliott Wave
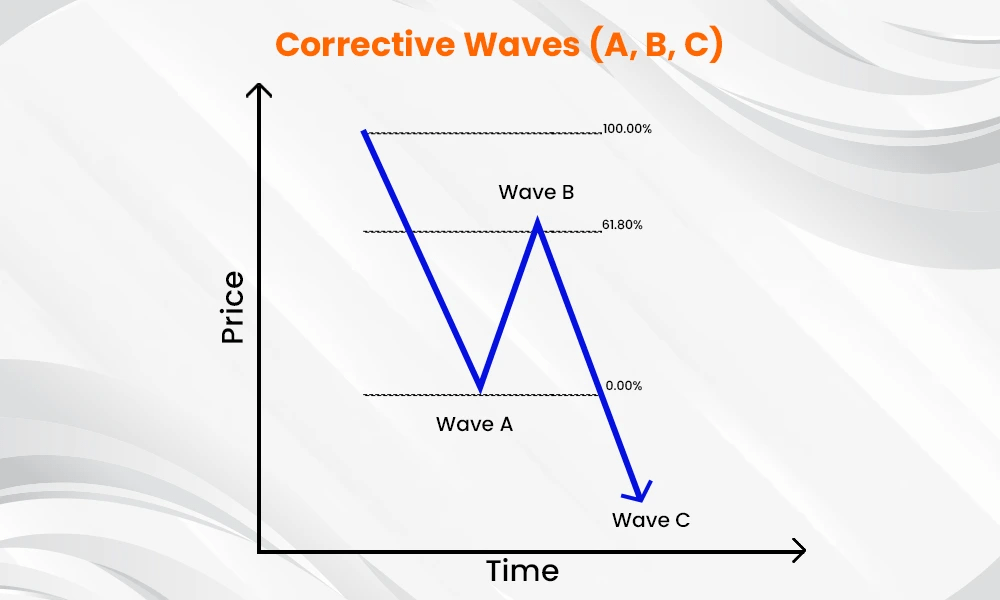
Corrective Waves:
Wave A is the first move against the trend
Wave B retraces Wave A, often hitting 50%, 61.8%, or sometimes 78.6% of Wave A
Wave C, is where Fibonacci extensions can predict it could go to 100% or 161.8% of Wave A
Corrective Waves:
Wave A is the first move against the trend
Wave B retraces Wave A, often hitting 50%, 61.8%, or sometimes 78.6% of Wave A
Wave C, is where Fibonacci extensions can predict it could go to 100% or 161.8% of Wave A
2.7 Elliott Wave
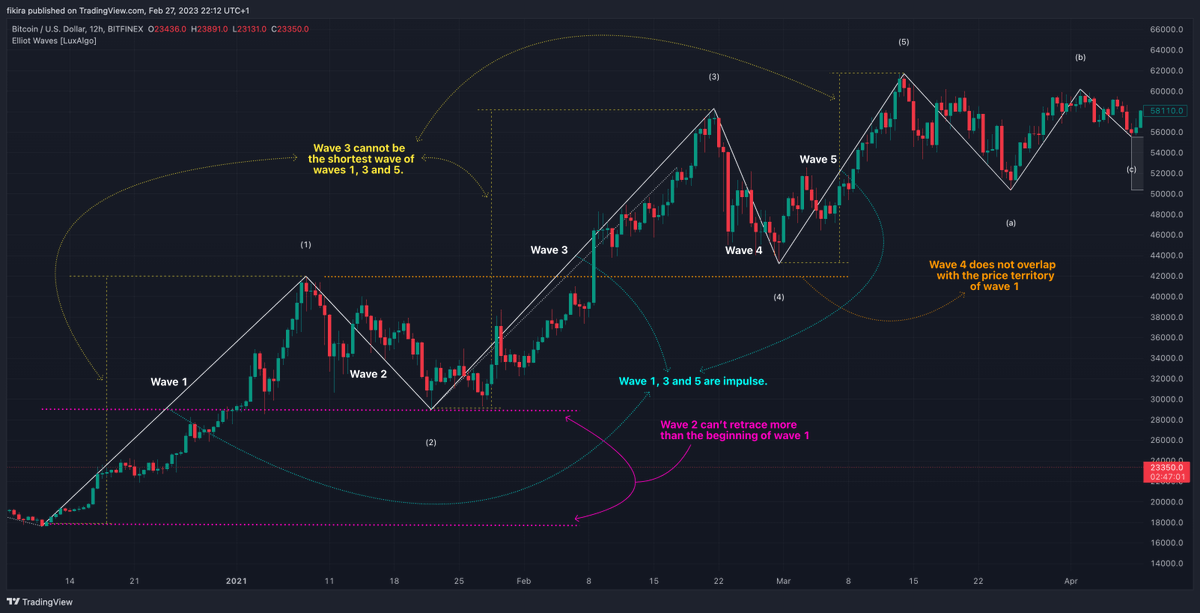
How to Trade Elliott Waves:
Impulse Waves: These are trend-following movements subdivided into five waves.
Corrective Waves: These are against-trend movements divided into three waves.
Wave 2 cannot retrace beyond Wave 1
Wave 4 should not overlap Wave 1
How to Trade Elliott Waves:
Impulse Waves: These are trend-following movements subdivided into five waves.
Corrective Waves: These are against-trend movements divided into three waves.
Wave 2 cannot retrace beyond Wave 1
Wave 4 should not overlap Wave 1
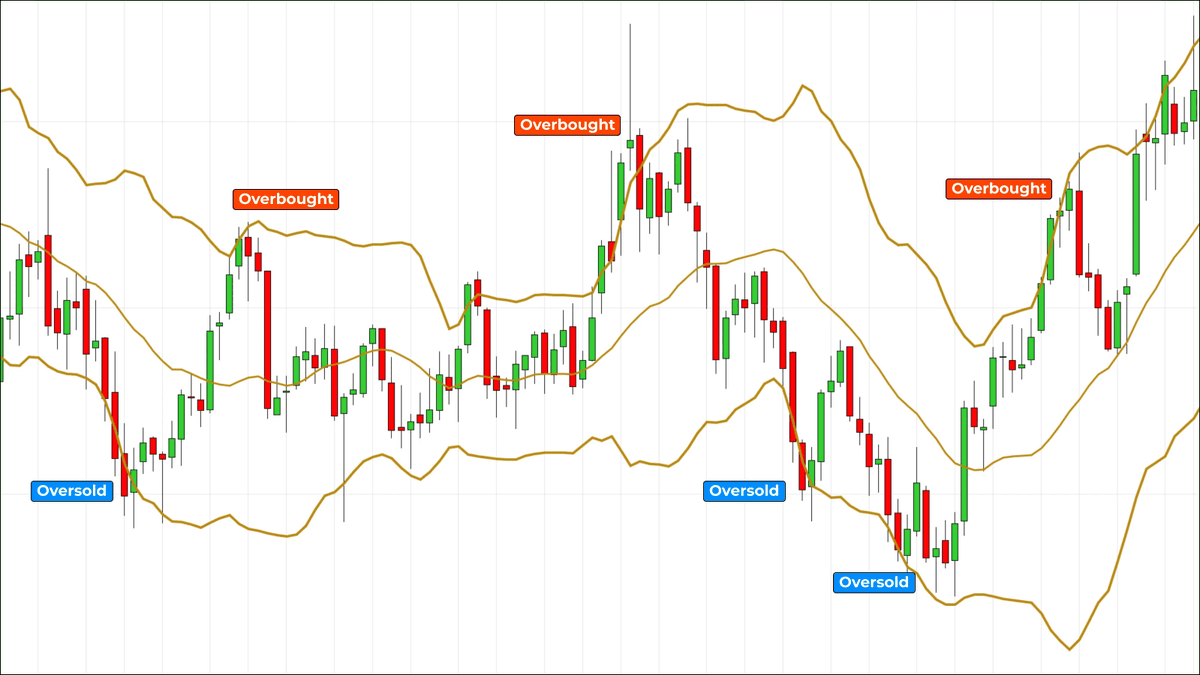
3. Bollinger Bands
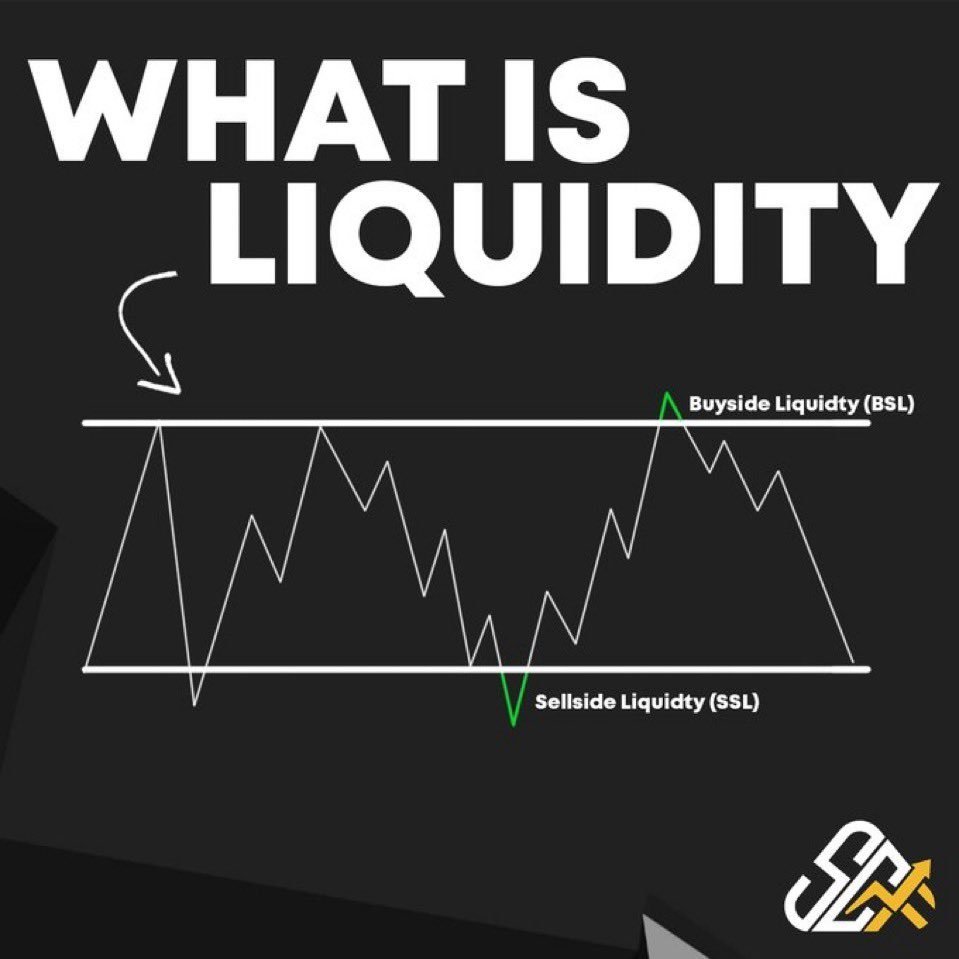
Bollinger Bands help identify potential overbought and oversold conditions in a market
When price touches or exceeds the upper Bollinger Band, the asset is overbought
When the price approaches or falls below the lower band, indicates an oversold condition
Bollinger Bands help identify potential overbought and oversold conditions in a market
When price touches or exceeds the upper Bollinger Band, the asset is overbought
When the price approaches or falls below the lower band, indicates an oversold condition
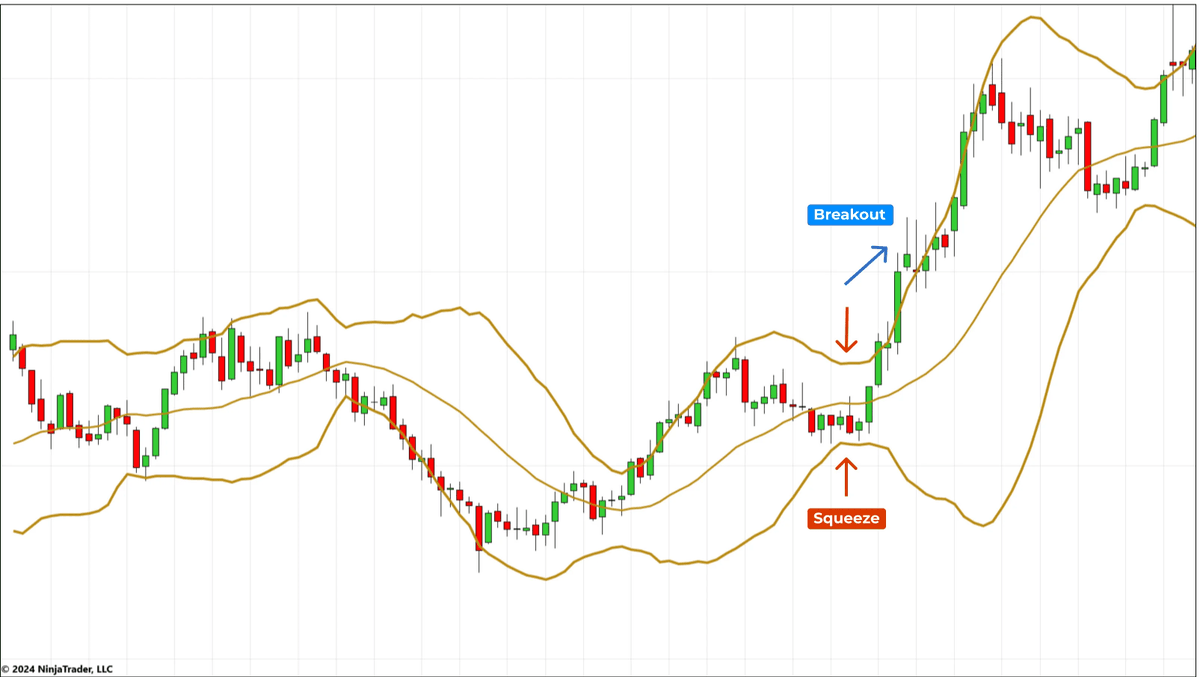
3.1 Bollinger Bands
A particularly consistent phenomenon associated with Bollinger Bands is the “volatility squeeze”
This occurs when the bands tighten noticeably, signaling a significant decrease in volatility.
Consider this as the calm before the storm.
A particularly consistent phenomenon associated with Bollinger Bands is the “volatility squeeze”
This occurs when the bands tighten noticeably, signaling a significant decrease in volatility.
Consider this as the calm before the storm.
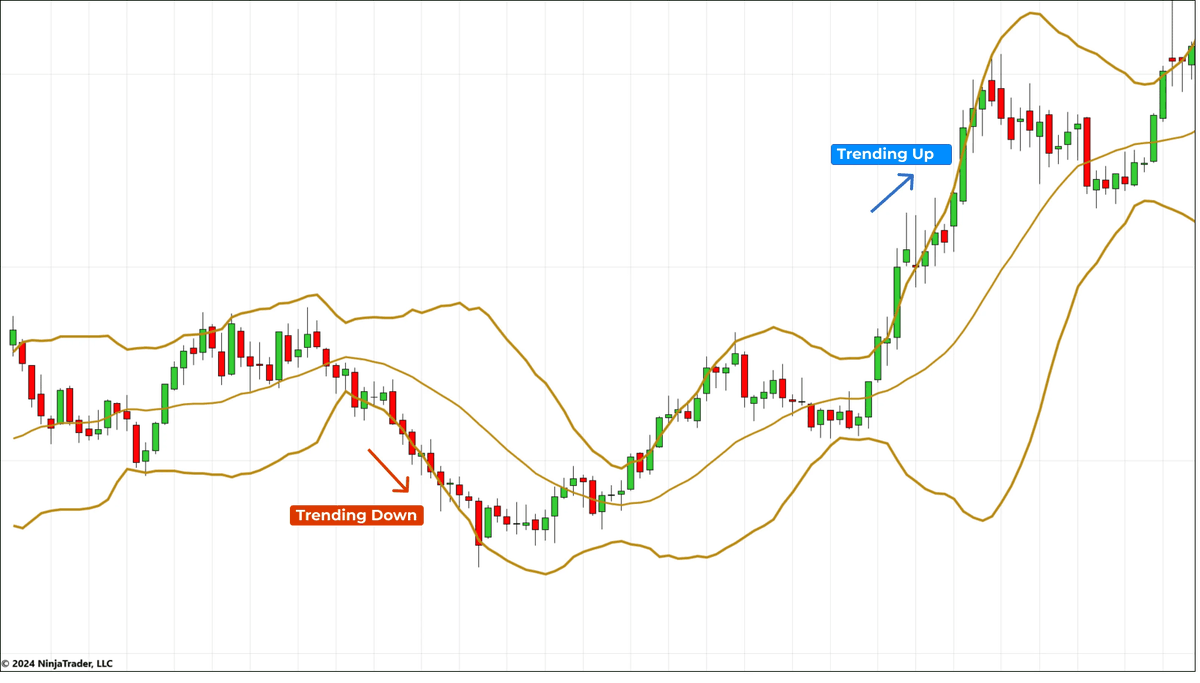
3.2 Bollinger Bands
A market trending persistently above the upper band signifies strong bullish momentum.
Suggesting that the trend may continue despite being in the overbought territory.
A market that remains below the lower band indicates strong bearish momentum.
A market trending persistently above the upper band signifies strong bullish momentum.
Suggesting that the trend may continue despite being in the overbought territory.
A market that remains below the lower band indicates strong bearish momentum.
• • •
Missing some Tweet in this thread? You can try to
force a refresh