1/24 BULL TRAP
2000 STIMMIE vs 2025 REVERSE STIMMIE
FIRST LET’S MAKE EVERYONE IS ON THE RIGHT PAGE HERE
Stimmie is money coming from the Gov going to consumers directly.
Reverse stimmie is money coming from consumers and going to the Gov.
2000 STIMMIE vs 2025 REVERSE STIMMIE
FIRST LET’S MAKE EVERYONE IS ON THE RIGHT PAGE HERE
Stimmie is money coming from the Gov going to consumers directly.
Reverse stimmie is money coming from consumers and going to the Gov.
2/24 One would have to suppose that both conditions can not have the same consequences, but should be suspected to have opposite consequences.
3/24 LET’S FIRST LOOK AT THE BEAR TRAP SEQUENCE OF 2020
(so we understand better the reverse situation)
This sequence was characterized by first
A plunge in velocity and deflationary impulse.
A response by money printing and Stimmie
A rise in savings rate and savings initially
(so we understand better the reverse situation)
This sequence was characterized by first
A plunge in velocity and deflationary impulse.
A response by money printing and Stimmie
A rise in savings rate and savings initially
4/24 As Stimmie went in the pockets of the people at the lower end of income, it is spent (this is inflationary)
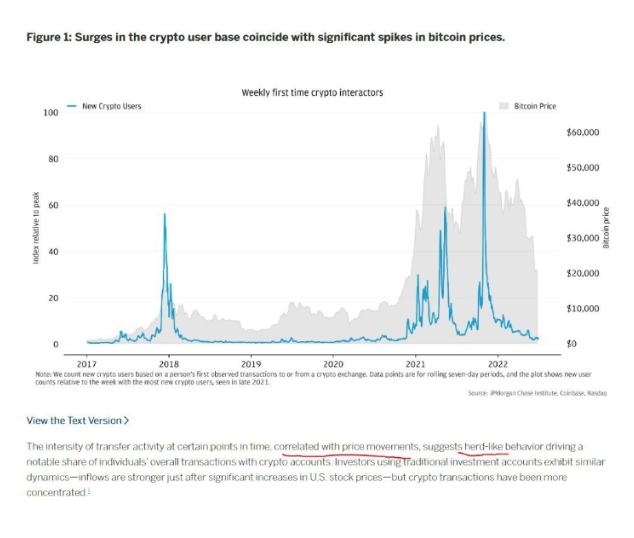
Other cohorts of people buy whatever assets with it and we have a massive pump into 2021 including crypto garbage evidently.
But also spent in the economy => earnings and inflation
Other cohorts of people buy whatever assets with it and we have a massive pump into 2021 including crypto garbage evidently.
But also spent in the economy => earnings and inflation
5/24 Now let’s look at how different the situation is today.
BULL TRAP SEQUENCE
We are at the end of the inflationary impulse but with a large primary deficit inflation is sticky.
Market is characterized by an absence of consistency in market behavior.
BULL TRAP SEQUENCE
We are at the end of the inflationary impulse but with a large primary deficit inflation is sticky.
Market is characterized by an absence of consistency in market behavior.
6/24 The tariffs are sticking but people forgot why they sold initially.
Characterized by massive increase in retail leverage and buying in a very short period of time
While the income situation of consumer is deteriorating
Characterized by massive increase in retail leverage and buying in a very short period of time
While the income situation of consumer is deteriorating
7/24 Access to more leverage is not there from banks
Savings contrarily to 2020 are depleted
And the reverse stimmie effect is yet to be fully reflected on consumers.
Savings contrarily to 2020 are depleted
And the reverse stimmie effect is yet to be fully reflected on consumers.
8/24 SEQUENCE OF EVENTS:
First we had a threat of a DOGE that put some dent into the market, as people expected some sort of austerity, and then the liberation day that created upheaval in the USD, credit and UST market as well as Equity market.
First we had a threat of a DOGE that put some dent into the market, as people expected some sort of austerity, and then the liberation day that created upheaval in the USD, credit and UST market as well as Equity market.
9/24 Then we had the rumor of TACO to pull the market upwards.
But the tariffs stuck and the market continued to rise!!!
There is nothing like an upward market to sedate people.
But the tariffs stuck and the market continued to rise!!!
There is nothing like an upward market to sedate people.
10/24 TARIFFS. ARE. STICKING.
What’s your reason for rallying now?
The problem is that the buying is probably entirely coming from retail buying and fast increase on leverage trading
What’s your reason for rallying now?
The problem is that the buying is probably entirely coming from retail buying and fast increase on leverage trading
11/24 INCREASE IN LEVERAGED TRADING
(consequence is that stocks jump)
Margin Leverage: Margin Debt Records and Comparison
Margin debt on U.S. retail brokerage accounts has soared past $1 trillion as of June 2025, setting a new all-time high
x.com/EconguyRosie/s…
Debunking the debunking about “there is no increase in leverage” look at NYSE Margin! @DannyDayan5
The NYSE margin debt data published by FINRA (and historically tracked by the NYSE itself before 2017) is not a ratio against the whole U.S. stock market, and it does not explicitly cover Nasdaq’s entire market cap.
Here’s the nuance:
What it measures:
FINRA’s "Securities Margin Debt" statistic is the total margin debt across all broker-dealers who report to FINRA, not just NYSE members. So it does include margin debt used to buy Nasdaq stocks, NYSE stocks, AMEX, etc.
Where the confusion comes from:
When people say "NYSE Margin Debt to Market Cap", they’re often using NYSE market cap only in the denominator — which is misleading because the numerator (margin debt) spans all U.S. exchanges.
That ratio will understate the true leverage level if the Nasdaq portion of market cap is ignored.
Best practice:
If you want a meaningful "margin debt to market cap" ratio, you should compare FINRA’s margin debt figure to the total U.S. equity market cap (NYSE + Nasdaq + CBOE-listed, etc.).
Record speed in increase in leverage from retail
This represents an 18% increase over just two months (April to June 2025)—one of the fastest surges since 1999–2000 Barron's.
In inflation-adjusted terms, real margin debt has grown more than 310% since 1997, outpacing the S&P 500’s ~250% growth over the same span YouTube.
Margin debt as a share of GDP now exceeds levels seen during the dot-com bubble and rivals the 2021 peak
markets.businessinsider.com/news/stocks/st…
Summary: Retail is borrowing record amounts to invest, more extreme than the late‑1990s and closely approaching 2021’s peak.
But the picture is incomplete if you exclude Options Leverage: Retail’s Dominance, Especially in 0DTE
Short-dated (0DTE) S&P 500 options now comprise over 60% of all SPX and ETF option trades, with retail investors accounting for 50–60% of that volume
marketwatch.com/story/retail-t…
Retail participation in non-SPX (single‑stock and ETF) options grew from ~32% in Q4 2019 to around 40% by Q4 2023, measured by notional value cdn.cboe.com.
Studies show typical options trades among retail use roughly 2.5× leverage (notional trade value vs. account equity)
papers.ssrn.com/sol3/papers.cf…
Retail trades now account for over one-third of total option volume, including massive use of short‑expiration contracts, signaling a widespread embrace of speculative and leveraged bets.
Risk Context: Comparisons & Behavioral Signals
Retail margin debt and options usage now approach or exceed levels seen around March 2000 and late 2021, both preceding major drawdowns
marketwatch.com/story/speculat…
Goldman Sachs’ Speculative Trading Indicator has surged: while not yet at dot‑com or 2021 peaks, it is elevated and historically predictive of short‑term tops followed by weakness within 12–24 months marketwatch.com/story/speculat…
Much of this behavior is driven by retail appetite for lottery‑like outcomes, heavily focused on zero‑days‑to‑expiration options and meme‑stock style trades
barrons.com/articles/meme-…
Summary Table
Type of Leverage
Current Retail Level
Historical Comparison
Margin debt
~$1 trillion; real increase ~310% since 1997
Exceeds dot‑com & near 2021 peak
Options participation
~35–60% of volume; vast growth in 0DTE
At or above 2021 retail spike
Realized leverage
~2.5× notional value in typical options trades
Similar to peak speculative eras
12/24 Final Takeaway
Retail leverage is at or above peak levels seen in dot‑com 2000 and the meme‑stock era of 2021, both in terms of margin debt and speculative options use. The proliferation of 0DTE trading and high-margin borrowing underscores retail’s elevated risk posture—often a contrarian red flag near extended market cycles.
Retail leverage is at or above peak levels seen in dot‑com 2000 and the meme‑stock era of 2021, both in terms of margin debt and speculative options use. The proliferation of 0DTE trading and high-margin borrowing underscores retail’s elevated risk posture—often a contrarian red flag near extended market cycles.
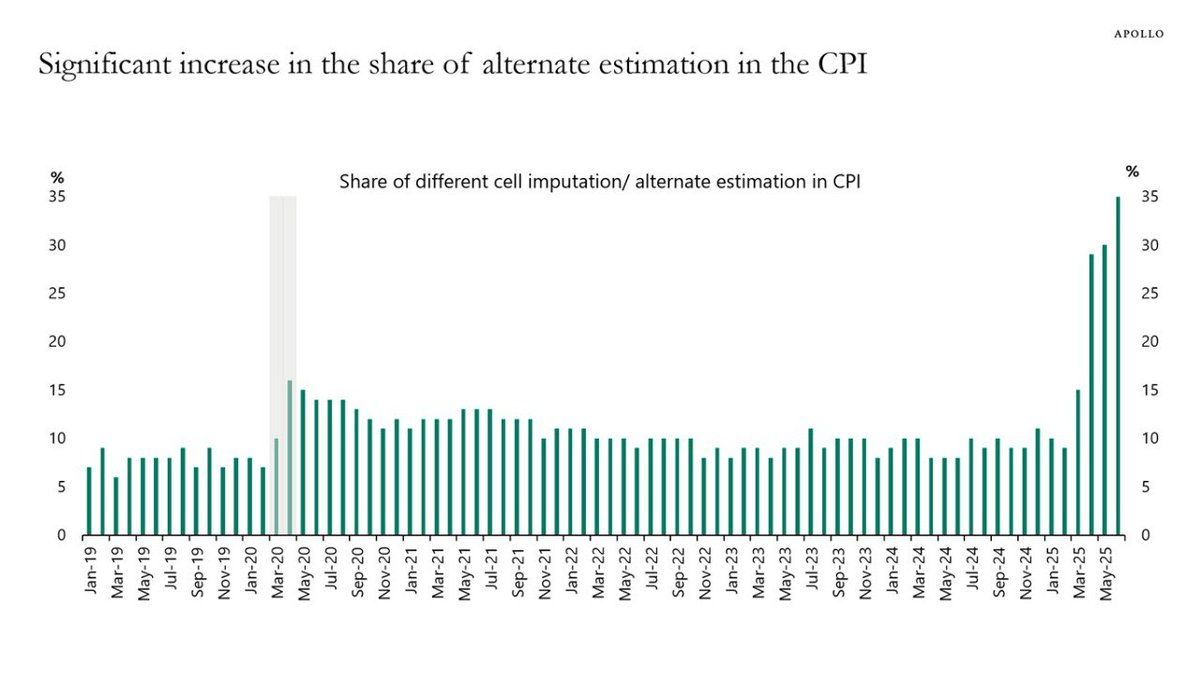
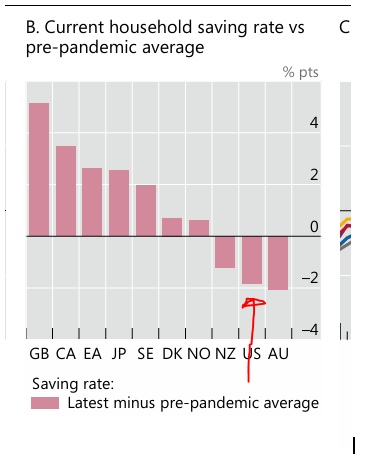
13/24 PROBLEM IS THAT IT’S NOT 2021: SAVINGS HAVE BEEN DEPLETED SINCE AS BIS EXPLAINS
14/24 People are hurting, it showed in our Costco investigation in inferior goods switching, x.com/GraphCall/stat…
it shows a lot in this yahoo survey
finance.yahoo.com/personal-finan…
And the Fed finally has to admit it.
x.com/financialjuice…
it shows a lot in this yahoo survey
finance.yahoo.com/personal-finan…
And the Fed finally has to admit it.
x.com/financialjuice…
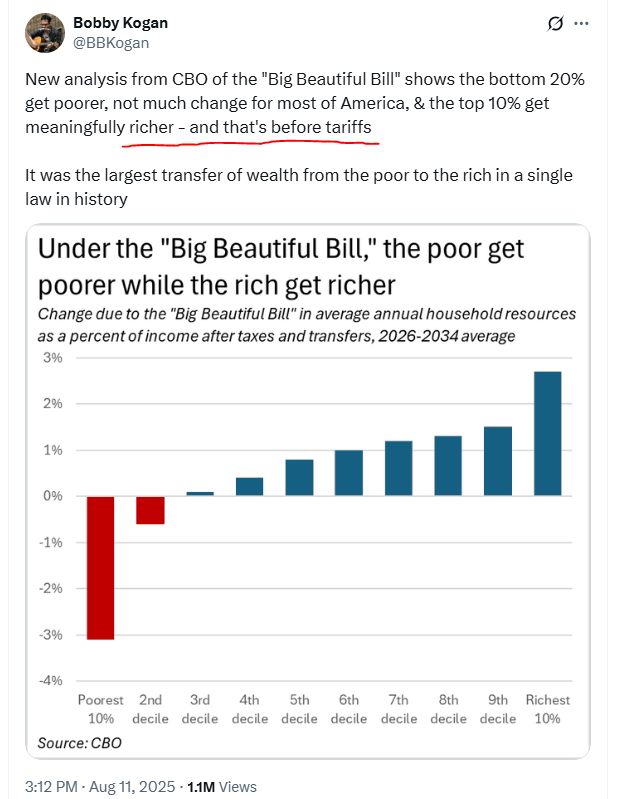
15/24 THE BIG BEAUTIFUL BILL IS REGRESSIVE,
Not completely a reserve stimmie since the top tranch actually gest a transfer from the lower tranche, but it is however a reverse stimmie at the bottom
Not completely a reserve stimmie since the top tranch actually gest a transfer from the lower tranche, but it is however a reverse stimmie at the bottom
16/24 HOWEVER TARIFFS ARE A BIG FAT REVERSE STIMMIE FOR ANYONE CONSUMING
The bottom part gets hurt more proportionally but the top gets hurt too.
Gary Cohn does not hide the fact that for now there is a bit of absorption from corporations, but that ultimately it will fall on the consumer
The bottom part gets hurt more proportionally but the top gets hurt too.
Gary Cohn does not hide the fact that for now there is a bit of absorption from corporations, but that ultimately it will fall on the consumer
17/24 The thing is that corporations are taking first the hit on prices through tarifss and that shows in PPI
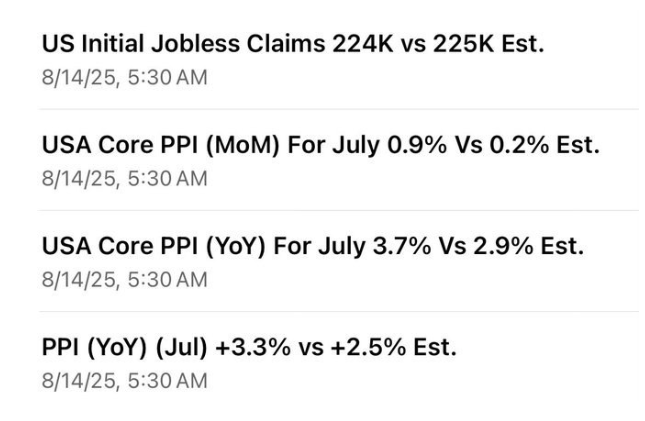
18/24 But the burden is expected to be 66% on the back of consumers from this Interview from Goldman Sachs chief economist, echoing Gary Cohn’s comments.
19/24 It is likely to be a one time effect, and consumers being hurt by tariffs might try to bargain HOWEVER, the tariffs should significantly since they reduce the purchasing power of consumers (consumers are sending a check to the Gov with tariffs)
So Austerity is there, via tariffs it’s being put on the consumers back primarily and on businesses exposed to imports. That’s your reverse stimmie.
So Austerity is there, via tariffs it’s being put on the consumers back primarily and on businesses exposed to imports. That’s your reverse stimmie.
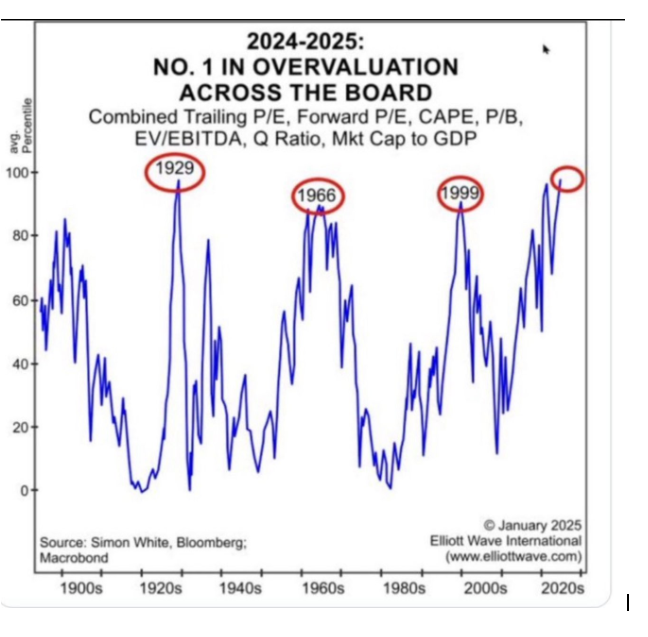
2024/ NOW IN WHAT CONTEXT OF VALUATION IS THAT HAPPENING?
Lol.
Lol.
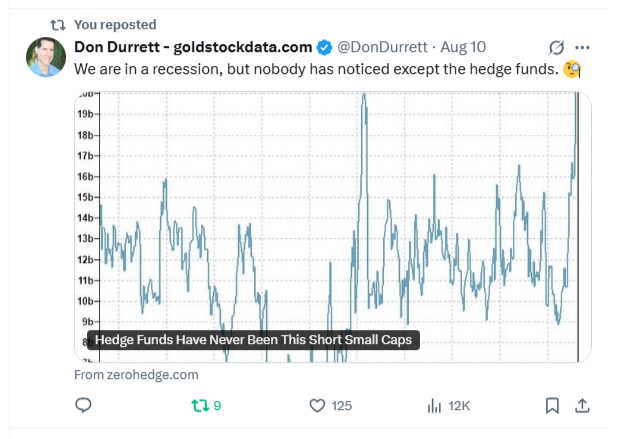
21/24 SO SEEING THAT, HEDGE FUNDS ARE THE TAKING THE INVERSE BET
And that’s that for the consideration of a bull trap. Because if the markets has risen from leverage from consumers, on the false premises of TACO, while income is pinched, banks retrench on lending to consumers,.
And that’s that for the consideration of a bull trap. Because if the markets has risen from leverage from consumers, on the false premises of TACO, while income is pinched, banks retrench on lending to consumers,.
22/24 .. Big Beautiful bill is regressive at the bottom only BUT we have a reverse stimmie / austerity via tariffs across the board?
23/24 Ok the Gov is spending a lot still and other sectors of the market might benefit, but for subprime consumer lending securitization (really exposed in Auto) and consumer lending securitization in general have no impulse.
24/24 As for a continuation of retail leverage fuel bull market at very high valuation?
Sounds like lopsided, looks like a bull trap. Opposite of 2020 bear trap.
Sounds like lopsided, looks like a bull trap. Opposite of 2020 bear trap.
• • •
Missing some Tweet in this thread? You can try to
force a refresh