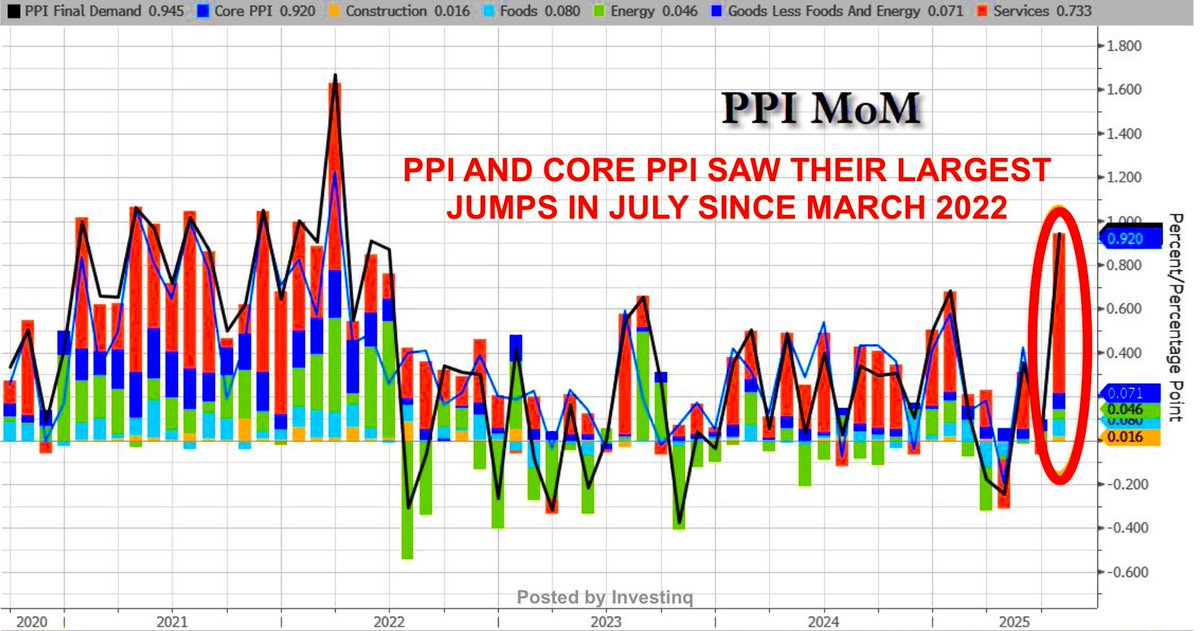
🚨 July’s inflation pipeline just erupted.
Producer prices rose 0.9% in a month, the sharpest jump in 3 years.
That’s more than four times what economists expected.
(a thread)
Producer prices rose 0.9% in a month, the sharpest jump in 3 years.
That’s more than four times what economists expected.
(a thread)
The Producer Price Index (PPI) tracks what domestic producers are paid for their output.
Think of it as prices “at the factory door” before products reach the checkout.
If it costs more for businesses to make or provide something, that pressure can end up in your bill.
Think of it as prices “at the factory door” before products reach the checkout.
If it costs more for businesses to make or provide something, that pressure can end up in your bill.
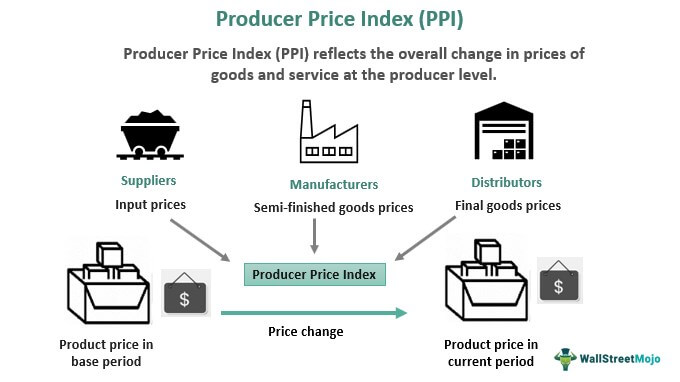
PPI is an upstream inflation gauge, meaning it measures cost changes earlier in the supply chain.
CPI (Consumer Price Index) tells us what you pay; PPI tells us what they get.
If PPI jumps, it often shows up in CPI later unless companies absorb the increase in their margins.
CPI (Consumer Price Index) tells us what you pay; PPI tells us what they get.
If PPI jumps, it often shows up in CPI later unless companies absorb the increase in their margins.
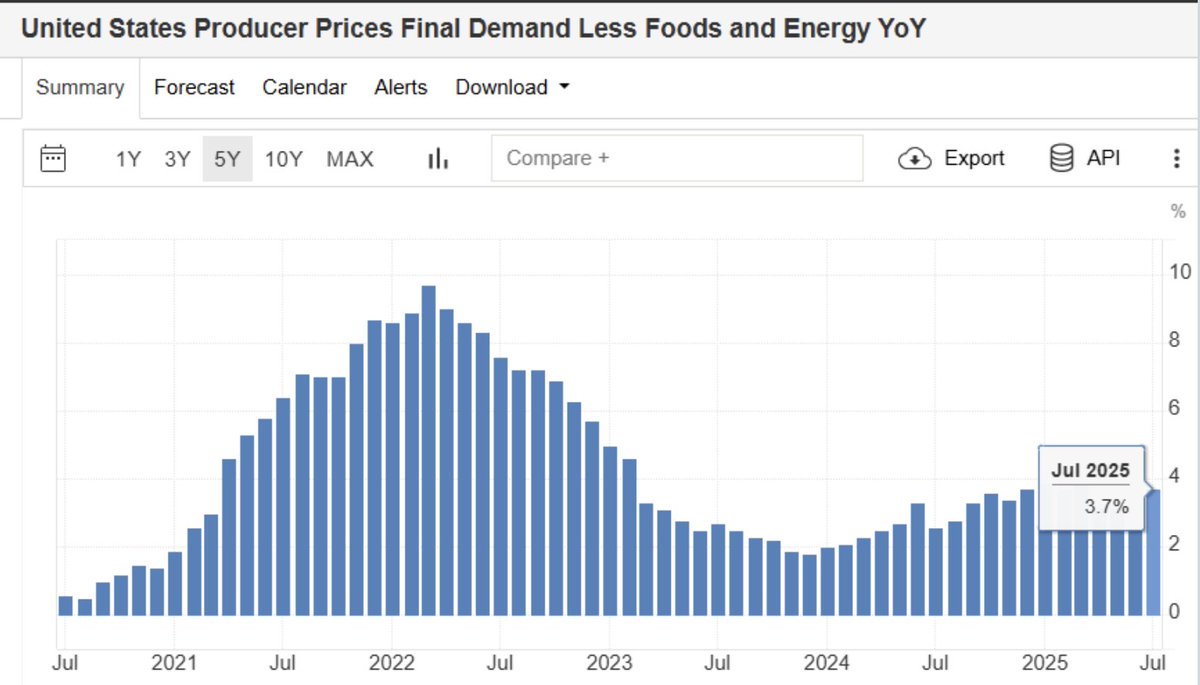
Year-over-year, PPI rose 3.3% in July.
Core PPI removing volatile food & energy rose an even hotter 3.7%.
Core is important because it strips away short-term swings like crop failures or oil price shocks, revealing the deeper trend.
Core PPI removing volatile food & energy rose an even hotter 3.7%.
Core is important because it strips away short-term swings like crop failures or oil price shocks, revealing the deeper trend.
A jump this size, alongside a hot core reading, is no small move.
It shows inflation is building across many parts of the economy.
When it’s this widespread, it’s far tougher to bring down.
It shows inflation is building across many parts of the economy.
When it’s this widespread, it’s far tougher to bring down.
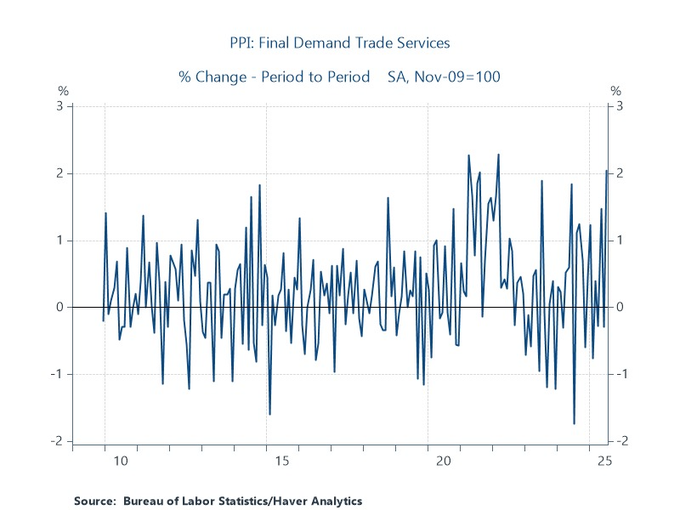
The largest contributor was services.
Over half of July’s total increase came from “trade services” margins, the difference between what wholesalers/retailers pay and what they sell for.
Those margins surged 2% in just one month.
Over half of July’s total increase came from “trade services” margins, the difference between what wholesalers/retailers pay and what they sell for.
Those margins surged 2% in just one month.
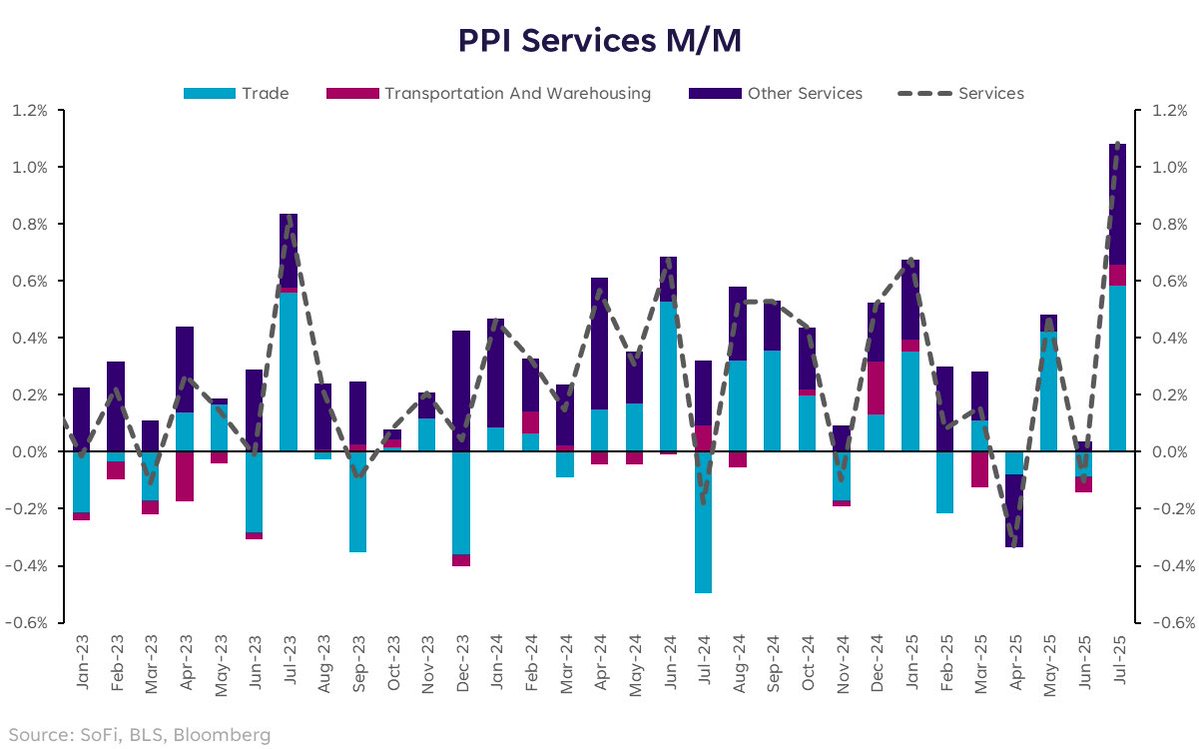
Rising margins show businesses have the pricing power to raise prices without losing customers.
That same room lets them pass along new costs like those from tariffs directly to buyers, instead of absorbing them.
It’s a sign that inflation from trade policy can stick.
That same room lets them pass along new costs like those from tariffs directly to buyers, instead of absorbing them.
It’s a sign that inflation from trade policy can stick.
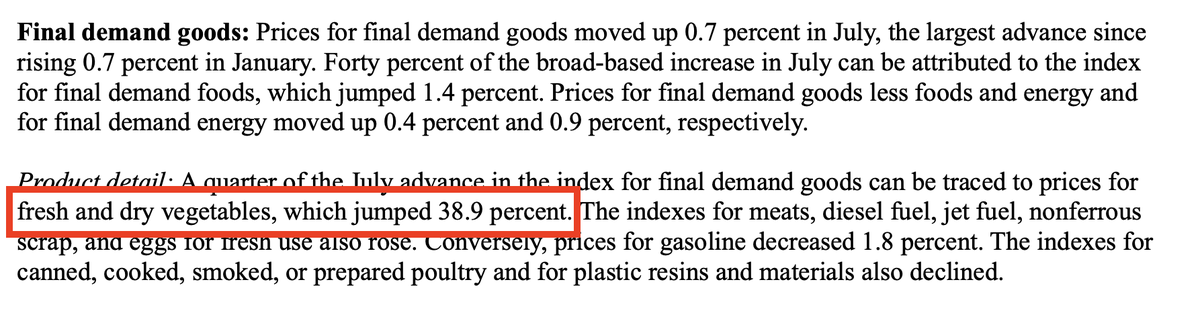
Physical goods also added pressure, climbing 0.7% in July.
Food was up 1.4%, energy 0.9%, and core goods 0.4%.
Fresh & dry vegetables alone surged nearly 38.9%, making up a quarter of the entire goods price increase.
Food was up 1.4%, energy 0.9%, and core goods 0.4%.
Fresh & dry vegetables alone surged nearly 38.9%, making up a quarter of the entire goods price increase.
Food spikes matter beyond grocery aisles.
When vegetable prices surge, restaurants, packaged food makers, and even school cafeterias face higher costs.
These can ripple outward, raising prices for meals and processed foods in the months ahead.
When vegetable prices surge, restaurants, packaged food makers, and even school cafeterias face higher costs.
These can ripple outward, raising prices for meals and processed foods in the months ahead.
Energy costs were another driver.
Diesel prices jumped 11.8% in July.
Diesel powers freight trucks, ships, and trains meaning higher transport costs for everything from groceries to electronics.
Diesel prices jumped 11.8% in July.
Diesel powers freight trucks, ships, and trains meaning higher transport costs for everything from groceries to electronics.

Transport cost spikes create a chain reaction.
If it costs more to move goods, companies either absorb the loss or raise prices.
In a strong demand environment, most will choose to pass those costs on to customers.
If it costs more to move goods, companies either absorb the loss or raise prices.
In a strong demand environment, most will choose to pass those costs on to customers.
These categories feed into PCE (Personal Consumption Expenditures), the Fed’s preferred inflation gauge.
So while they might not seem linked to your grocery bill, they matter for setting interest rate policy.
So while they might not seem linked to your grocery bill, they matter for setting interest rate policy.
Even the “supercore” PPI which strips out food, energy, and trade margins rose 0.6%, the biggest gain since March 2022.
This focuses on the most persistent inflation drivers, like wages and long-term service contracts.
This focuses on the most persistent inflation drivers, like wages and long-term service contracts.
When supercore moves higher, it means inflation is being driven by structural, sticky costs not temporary swings in commodities.
That’s a harder type of inflation to bring down without slowing the economy.
That’s a harder type of inflation to bring down without slowing the economy.
While July’s surge was led by services and margins, higher import costs from tariffs is also be an undercurrent especially for goods categories heavily dependent on foreign inputs.
These added costs can ripple through domestic supply chains in much the same way fuel spikes do.
These added costs can ripple through domestic supply chains in much the same way fuel spikes do.
PPI doesn’t always pass directly into CPI.
If consumer demand is weak, businesses may choose to absorb the higher costs.
But when increases are this broad and large, pass-through to consumers becomes much more likely.
If consumer demand is weak, businesses may choose to absorb the higher costs.
But when increases are this broad and large, pass-through to consumers becomes much more likely.
This broad spread makes inflation more persistent.
Even if one category cools, others can keep the pressure alive.
It’s like a game of whack-a-mole, fix one, another pops up.
Even if one category cools, others can keep the pressure alive.
It’s like a game of whack-a-mole, fix one, another pops up.
For the Federal Reserve, this is a problem.
Markets were expecting a September rate cut after cooler CPI earlier in the week.
But a hot PPI warns that cost pressures are returning, making it risky to loosen policy too soon.
Markets were expecting a September rate cut after cooler CPI earlier in the week.
But a hot PPI warns that cost pressures are returning, making it risky to loosen policy too soon.
Cutting rates while producer costs are rising risks reigniting consumer inflation.
The Fed now faces a balancing act: cool inflation without stalling economic growth.
That’s much harder when the inflation is embedded across sectors.
The Fed now faces a balancing act: cool inflation without stalling economic growth.
That’s much harder when the inflation is embedded across sectors.
This time it’s not just oil or food.
The pressure is coming from margins, services, and logistics areas tied to how businesses operate.
Add in the impact of tariffs on certain imported goods, and those costs get even harder to cut quickly.
The pressure is coming from margins, services, and logistics areas tied to how businesses operate.
Add in the impact of tariffs on certain imported goods, and those costs get even harder to cut quickly.
If producers keep passing these higher costs down the line, consumer inflation could heat up by year-end.
The July PPI is a reminder that inflation can flare up and this flare is coming from deep inside the supply chain.
The July PPI is a reminder that inflation can flare up and this flare is coming from deep inside the supply chain.
If you found these insights valuable: Sign up for my FREE newsletter! thestockmarket.news
I hope you've found this thread helpful.
Follow me @_Investinq for more.
Like/Repost the quote below if you can:
Follow me @_Investinq for more.
Like/Repost the quote below if you can:
https://x.com/_investinq/status/1955991432507916292?s=46
• • •
Missing some Tweet in this thread? You can try to
force a refresh