Guy Berger Profile picture
Aug 14 7 tweets 3 min read Read on X
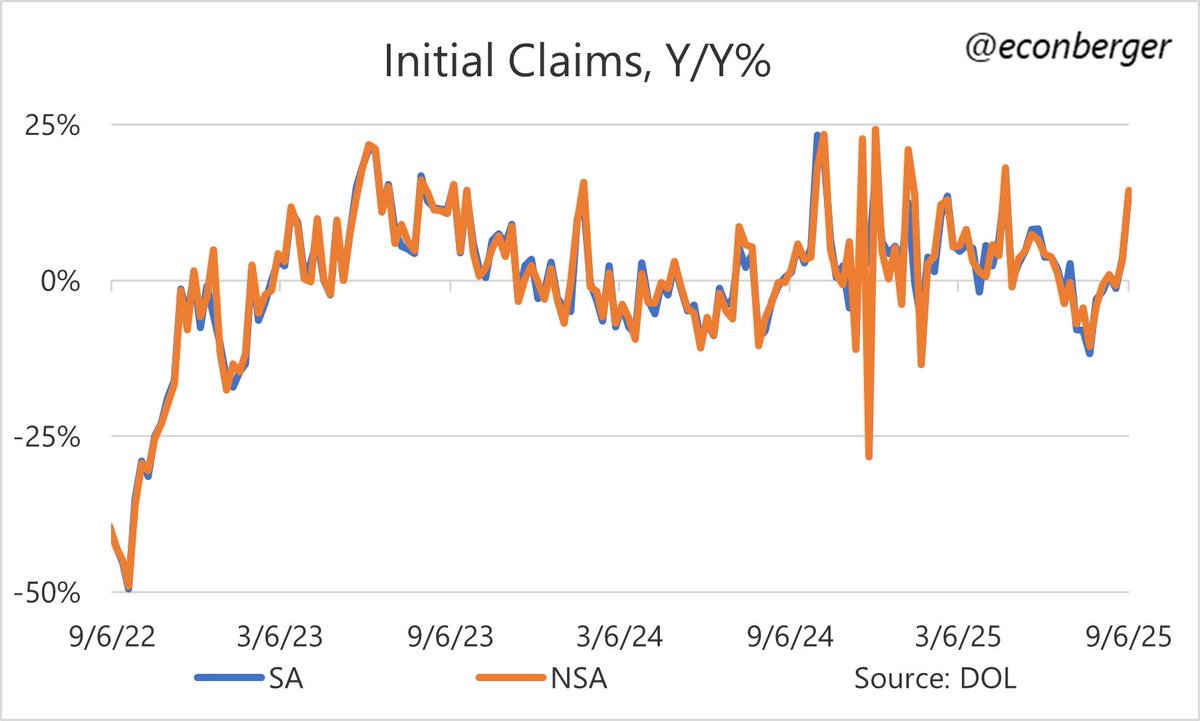
1/ Interesting tidbits on the labor market from @uscensusbureau 's latest Business Trends & Outlook Survey - which indicates the US labor market may be warming up.

Thread... Image
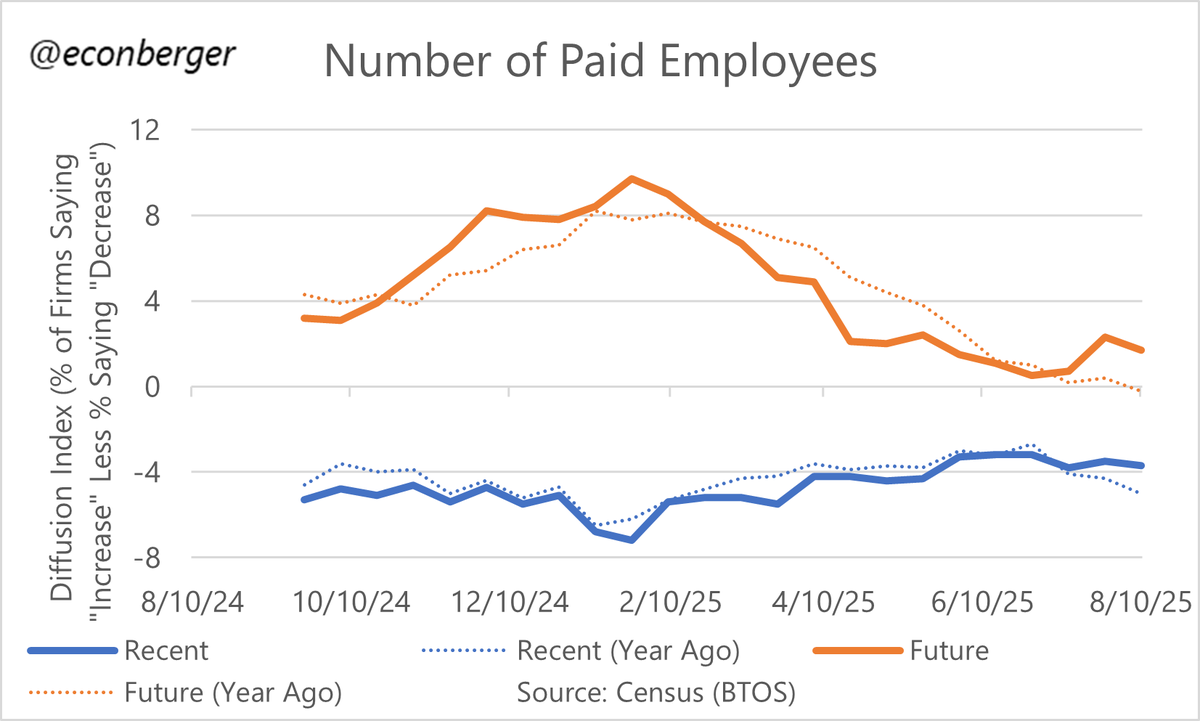
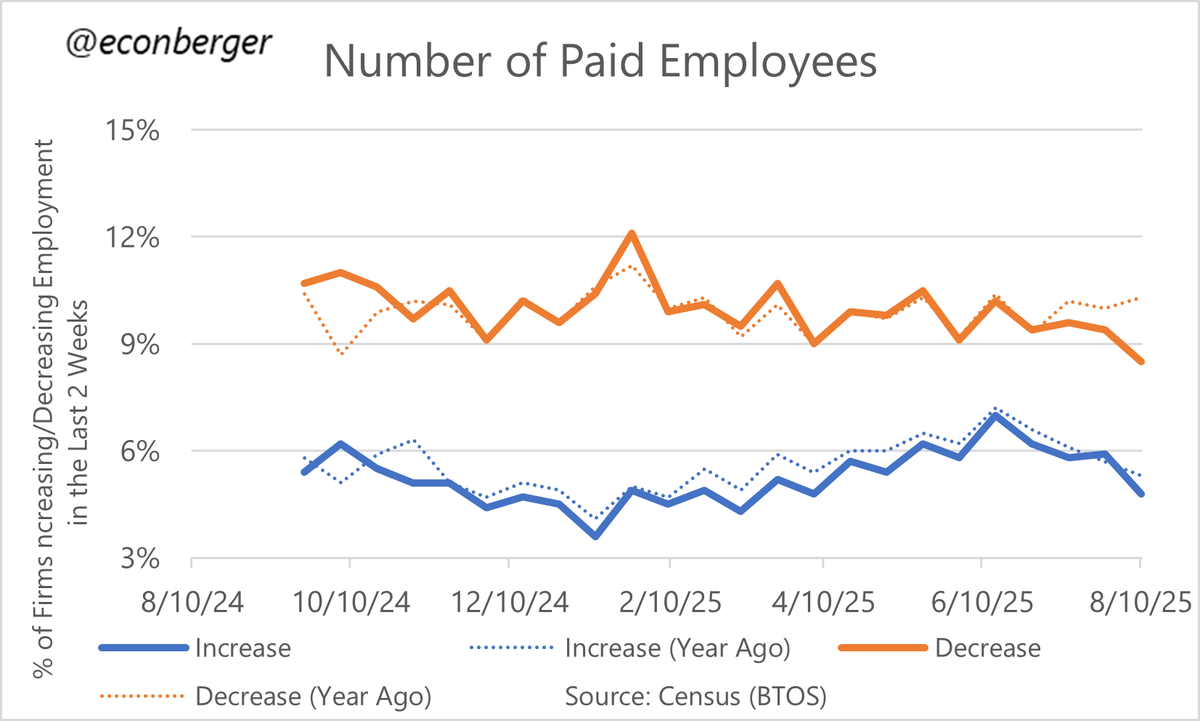
2a/ First off are recent employer actions on headcount.

For the first time in the history of this survey (which is less than 2 years), we've had 4 consecutive weeks where actions have been more expansionary (as measured by a diffusion index) than a year earlier. Image
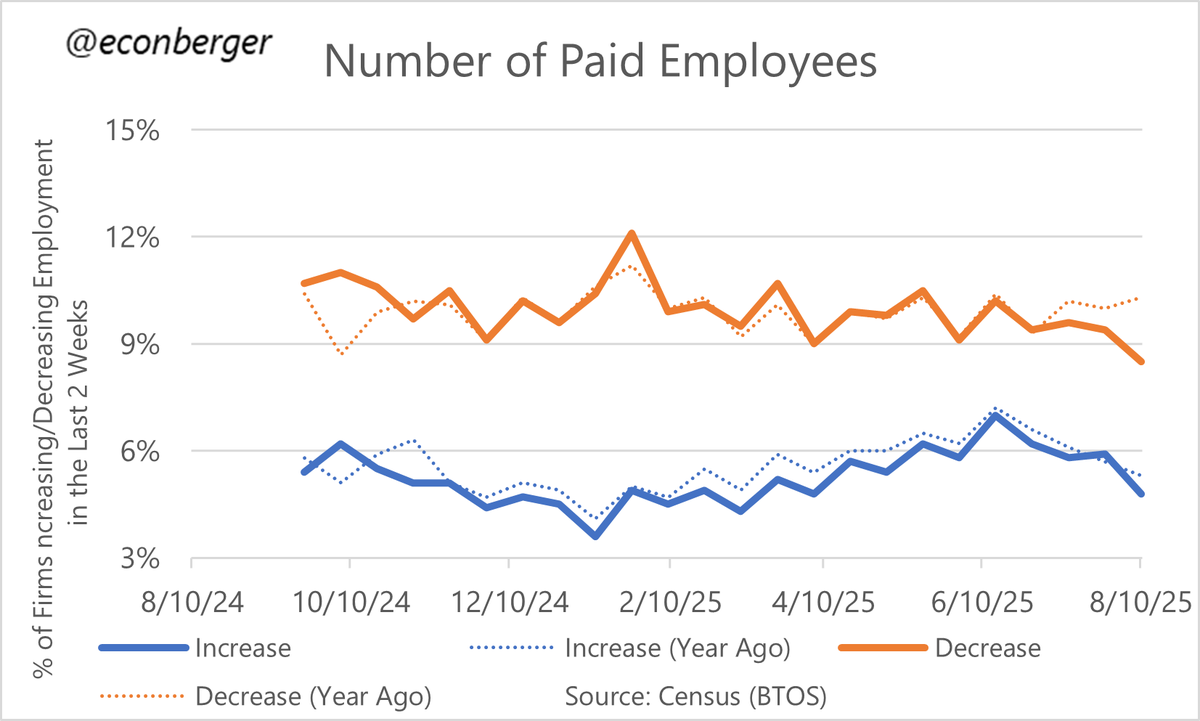
2b/ The improvement has primarily come from a sharp decline (relative to a year ago) in the share of firms cutting headcount.

Consistent with the recent decline in layoffs we've seen in the hard data.

There's been no improvement in the share of firms planning to expand. Image
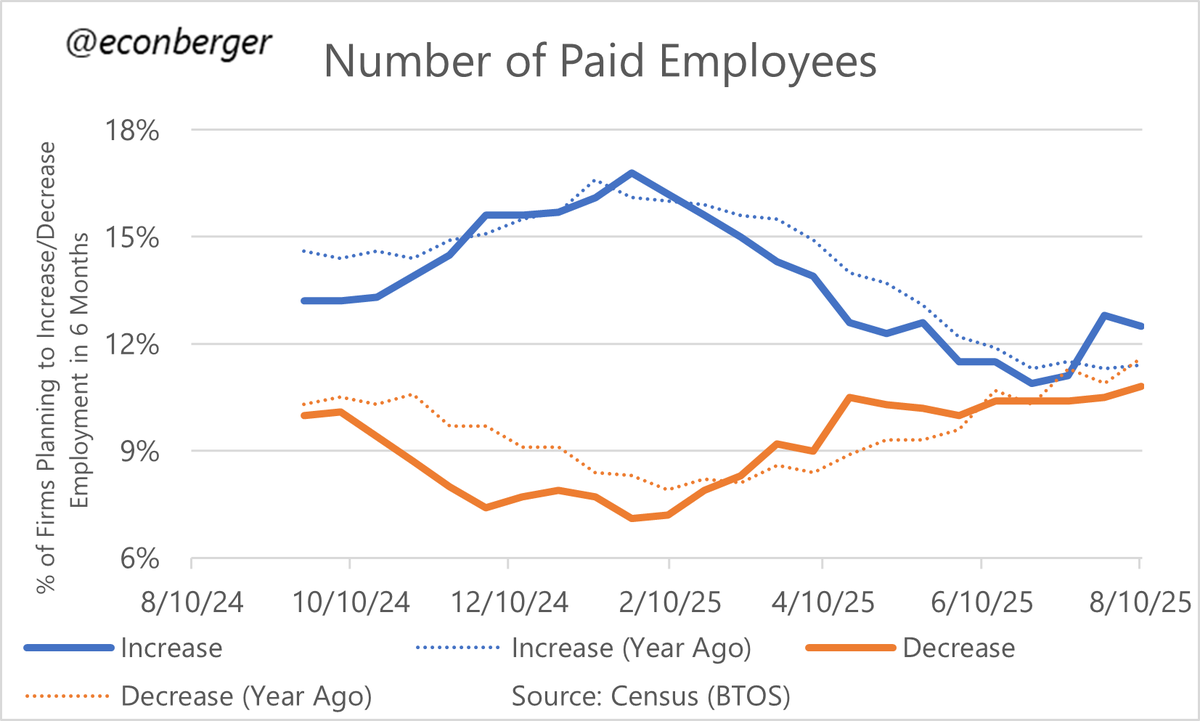
3/ Plans have fluctuated wildly since the fall, ping-ponging between extreme optimism and pessimism.

Currently we're in an optimistic phase. The share of firms planning to expand headcount has increased relative to a year ago.

We'll see what comes of these vibesy plans. Image
4/ One catch about this type of survey is firms are equally weighted!

So even though firms say they are expanding in the diffusion index (relative to a year ago), aggregating it economy-wide it might be negative if the small firms are the expanding ones (as is the case) Image
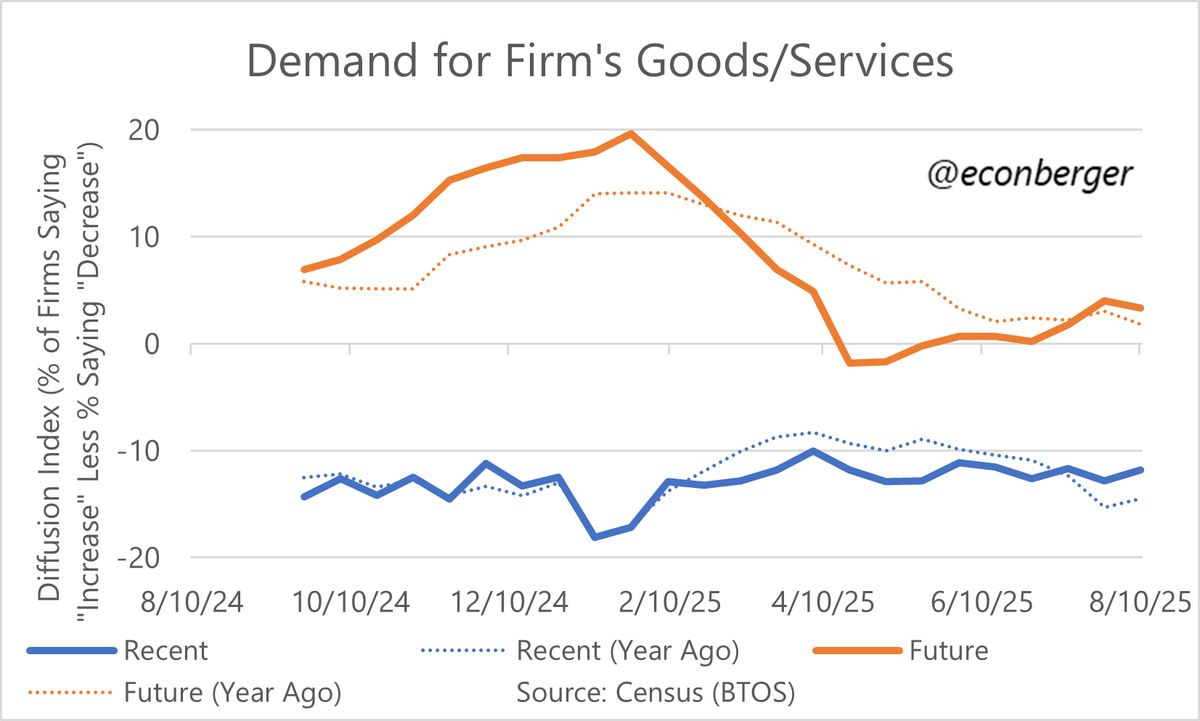
5/ Not my main domain, but US businesses are seeing rising demand for their goods & services (relative to a year ago), and also anticipate a increase in demand in 6 months. Image
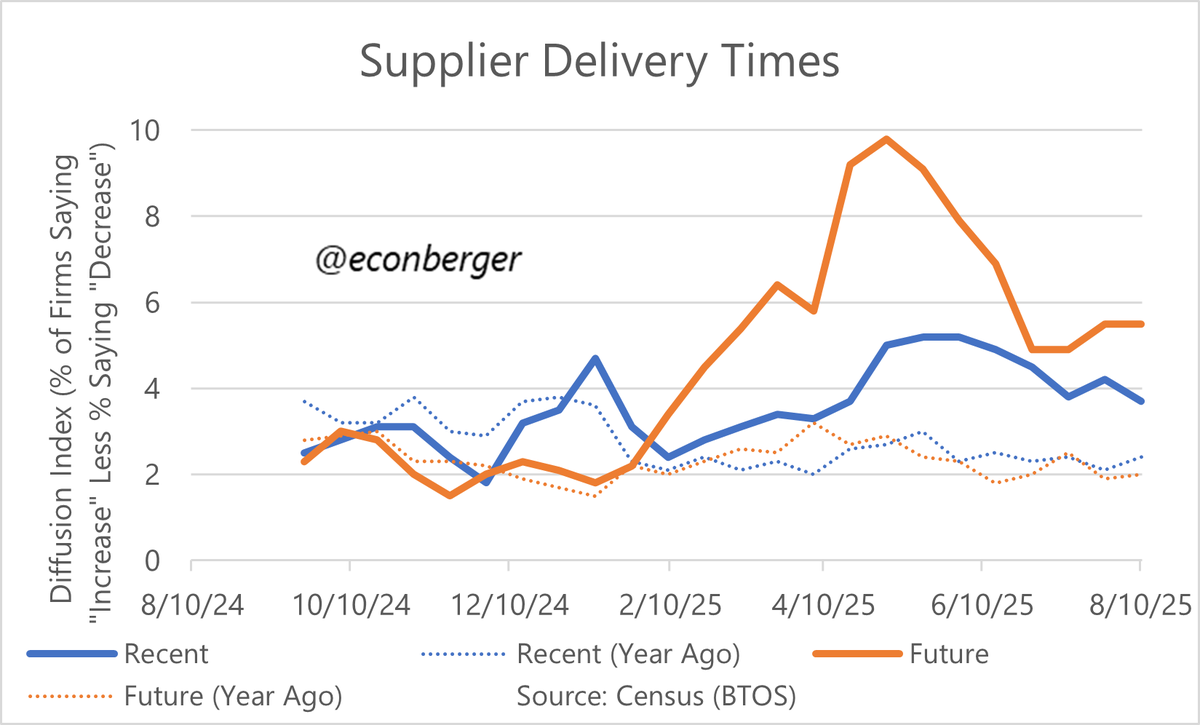
6/ The tariff-induced supply chain problems have moderated, but not fully normalized. Image

• • •

Missing some Tweet in this thread? You can try to force a refresh
 

Keep Current with Guy Berger

Guy Berger Profile picture

Stay in touch and get notified when new unrolls are available from this author!

Read all threads

This Thread may be Removed Anytime!

PDF

Twitter may remove this content at anytime! Save it as PDF for later use!

Try unrolling a thread yourself!

how to unroll video
  1. Follow @ThreadReaderApp to mention us!

  2. From a Twitter thread mention us with a keyword "unroll"
@threadreaderapp unroll

Practice here first or read more on our help page!

More from @EconBerger

Aug 14
Claims:

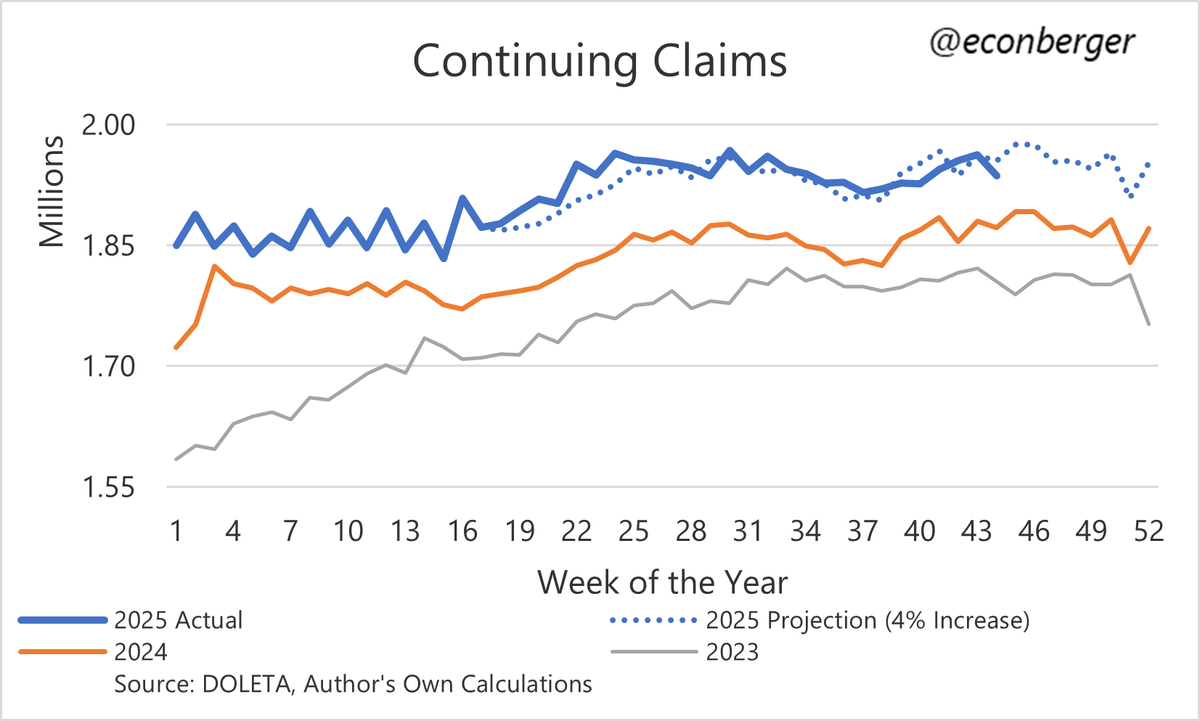
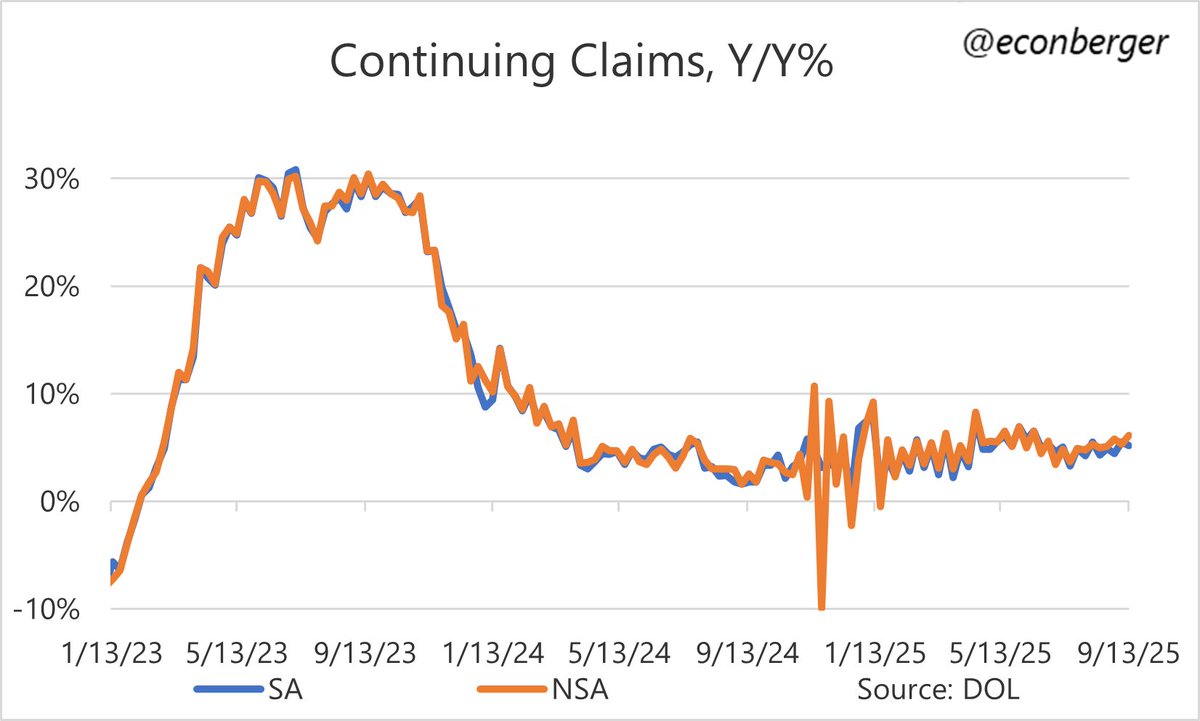
1/ Continuing claims modestly above my benchmark projection for the 2nd week in a row.

The published series should be flattish for the rest of the year (a misleadingly upbeat portrayal of the underlying trend). Image
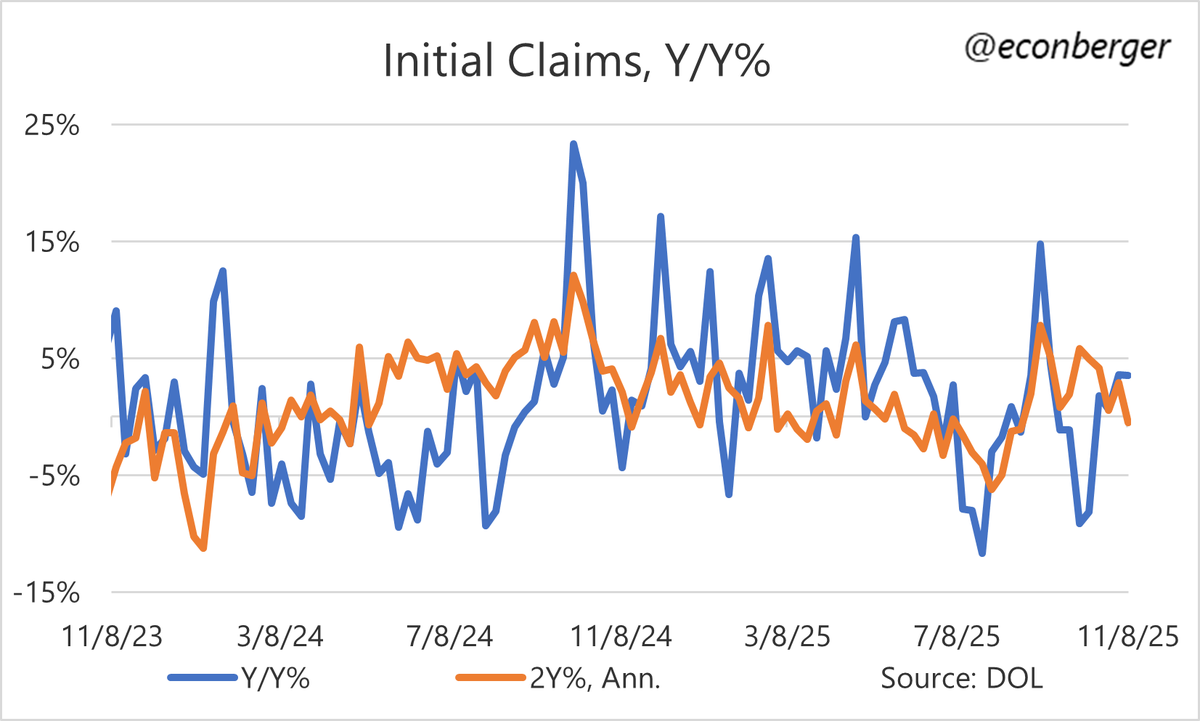
2/ The underlying trend is mid-single-digits Y/Y growth - a tiny bit better than 2 months ago, a tiny bit worse than earlier this year.

There's no sign of a sharp deceleration in the economy, nor is there any sign of acceleration. Image
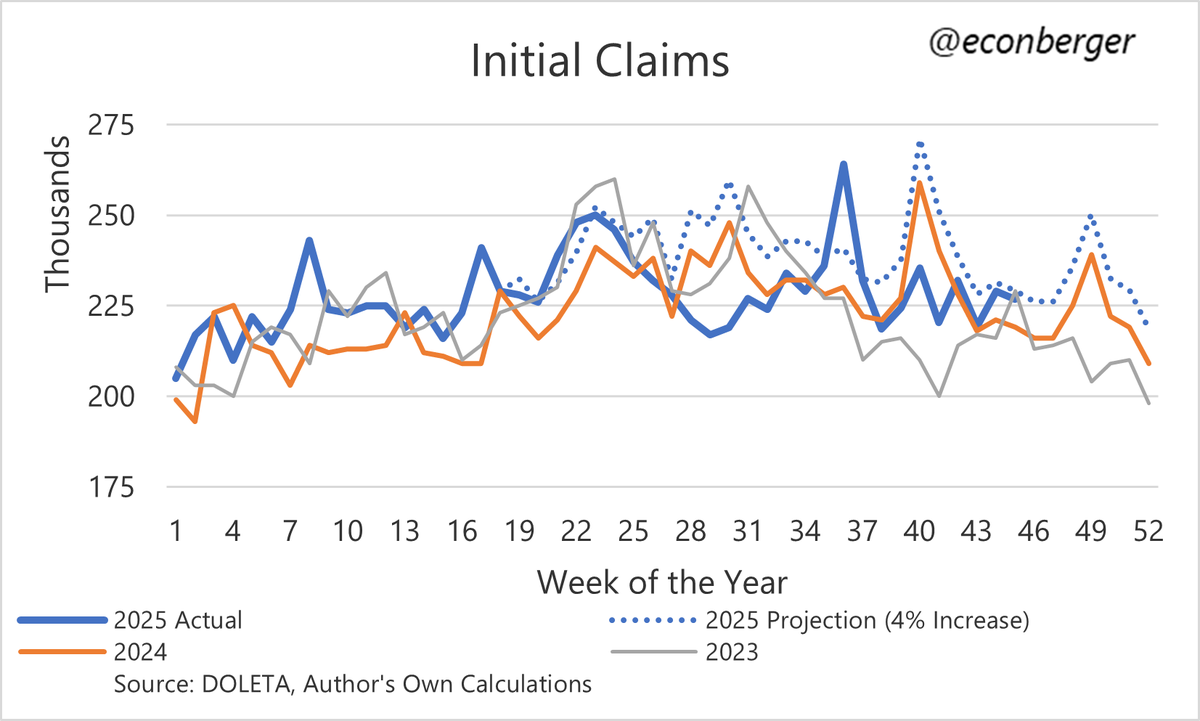
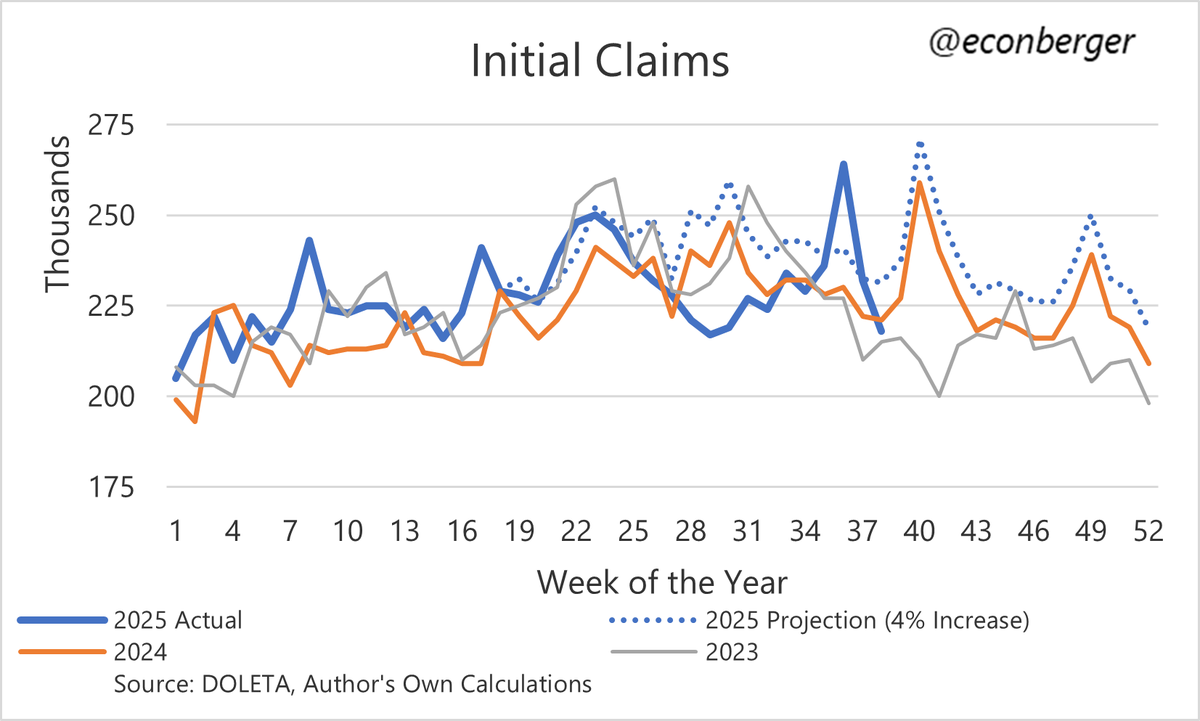
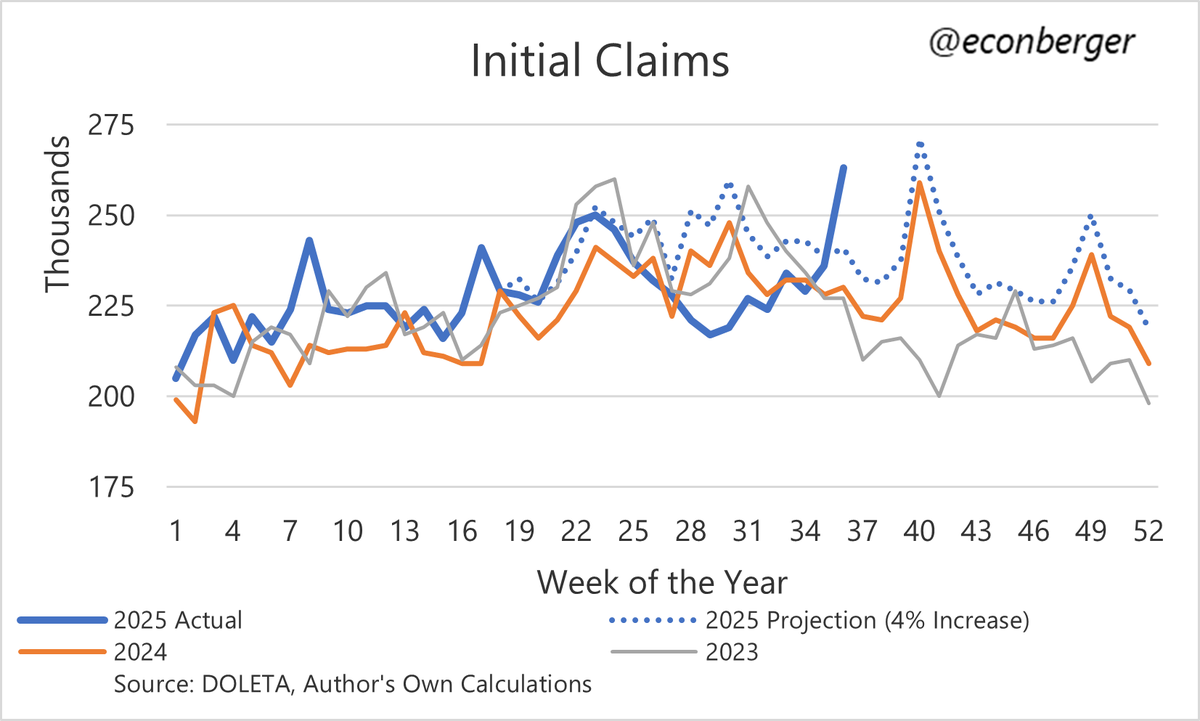
3/ Initial claims continue to run below my benchmark projection, as well as below 2023-24 levels.

Layoffs have probably fallen a little recently.

Though... it's not feeding through to a moderation in the growth of continuing claims which is what really matters. Image
Read 5 tweets
Jul 31
Claims:

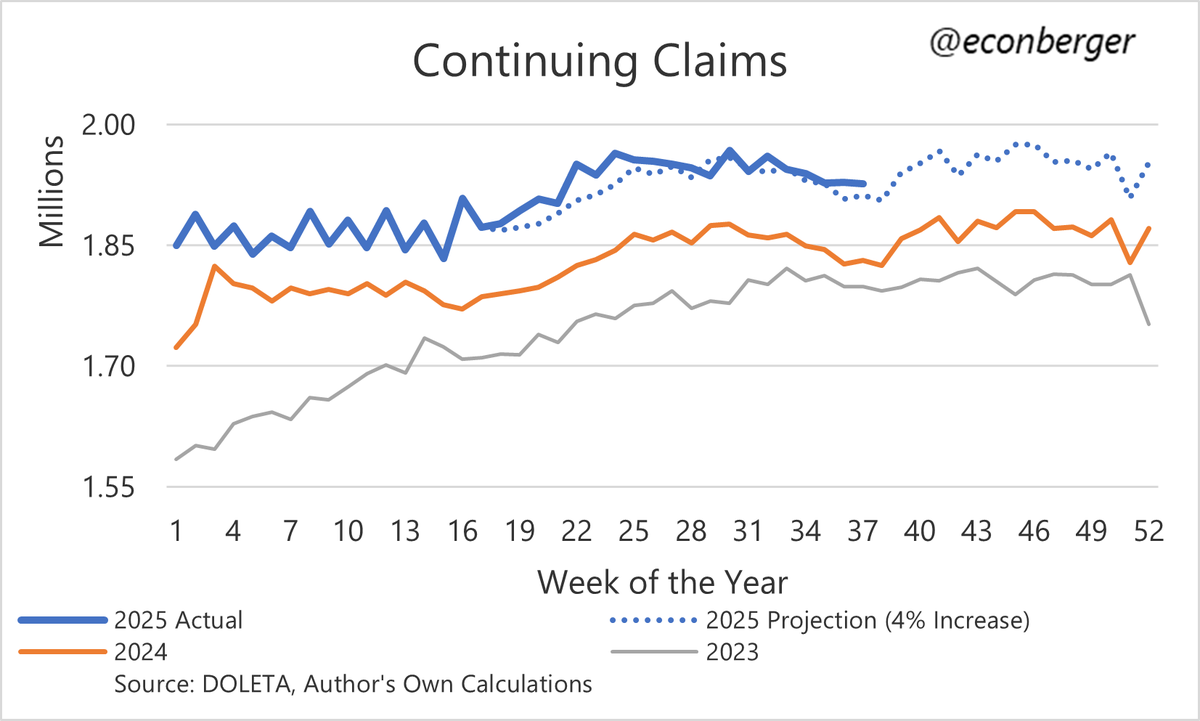
1/ Good news. The continuing claims scare of May/June faded further... continuing claims fell below my benchmark (which assumes a ~4% Y/Y increase).

They're likely to be (misleadingly) flattish for the remainder of the year, due to residual seasonality. Image
2/ Another way of seeing this: continuing claims were up about 4% Y/Y - comparable to before the scare.

That's still not *great*, reflecting a very mild ongoing deterioration. But that's not what got us worried two months ago. Image
3/ Initial claims continue to run not only below my benchmark, but below the last two years.

Layoffs appear to be coming down; we'll see if other data sources confirm this development in a few weeks. Image
Read 5 tweets
Jul 29
JOLTS: 1/ Hiring was a little on the soft side in June, but generally the main turnover indicators have been stable for some time. Cooling has been on pause since summer/fall 2024 and limited evidence that it has resumed. Image
2/ As stated earlier, hiring was on the soft side. A hiring rate of 3.3% is comparable to early 2012 levels, when the unemployment rate was a little over 8%. But there's a pretty good chance it's just noise around a stable, weak hiring trend. Image
3/ Quits are stable at 2.0% - around 2015-16 levels, when the unemployment rate was at just over 5%. People know job opportunities are limited, and are staying put as a result. Image
Read 5 tweets
Jul 24
Claims:

1/ Continuing claims a bit higher than I thought they would be, though still not that concerning.

We're probably going to be on a flattish trajectory in the published series for the remainder of the year due to residual seasonality. Image
2/ That flattish trajectory in the published series is an overly benign portrayal of what is actually happening in the underlying data, which is an ongoing slow creep upward. Image
3/ Initial claims continue to run below year-ago levels. We're still in the Hurricane Beryl base effect window so I'll want to wait a little longer before I declare that layoffs are coming down... Image
Read 5 tweets
Jul 2
1/ As with nonfarm payroll employment from the BLS, the breakeven monthly rate for ADP is much lower than it was a year ago.

Worth keeping in mind when seeing numbers like this…
2/ Without taking future revisions into account, we’ve had a similar trajectory to the unemployment rate in the first 5 months of this year with 124K/mo (vs 180K/mo a year earlier.)

Consider future revisions into account and we’re probably talking 154K vs 59K. Image
3/ I am in general mildly pessimistic about the labor market trajectory - I don’t intend to be a Pollyanna here.

But a lot of the slowing in employment growth is coming from the supply side, not the demand side.

Read more: open.substack.com/pub/macromostl…
Read 4 tweets
Jun 6
BLS charts:

1/ An increase of 139K in May, comparable to gains in the last two months (which were revised down).

My speculative hypothesis based on QCEW data through December 2024: after the eventual benchmark revision, these numbers will be closer to 70K/month. Image
2/ The unemployment rate is slowly creeping up, right along the track the Fed anticipated in March.

Was 4.244%, just shy of an unfavorable rounding. Image
3/ The employment population ratio was at 80.5% in May, and is zig-zagging a little below its cyclical peak. Image
Read 10 tweets

Did Thread Reader help you today?

Support us! We are indie developers!


This site is made by just two indie developers on a laptop doing marketing, support and development! Read more about the story.

Become a Premium Member ($3/month or $30/year) and get exclusive features!

Become Premium

Don't want to be a Premium member but still want to support us?

Make a small donation by buying us coffee ($5) or help with server cost ($10)

Donate via Paypal

Or Donate anonymously using crypto!

Ethereum

0xfe58350B80634f60Fa6Dc149a72b4DFbc17D341E copy

Bitcoin

3ATGMxNzCUFzxpMCHL5sWSt4DVtS8UqXpi copy

Thank you for your support!

Follow Us!

:(