🚨 The bond market just broke a multi-year record.
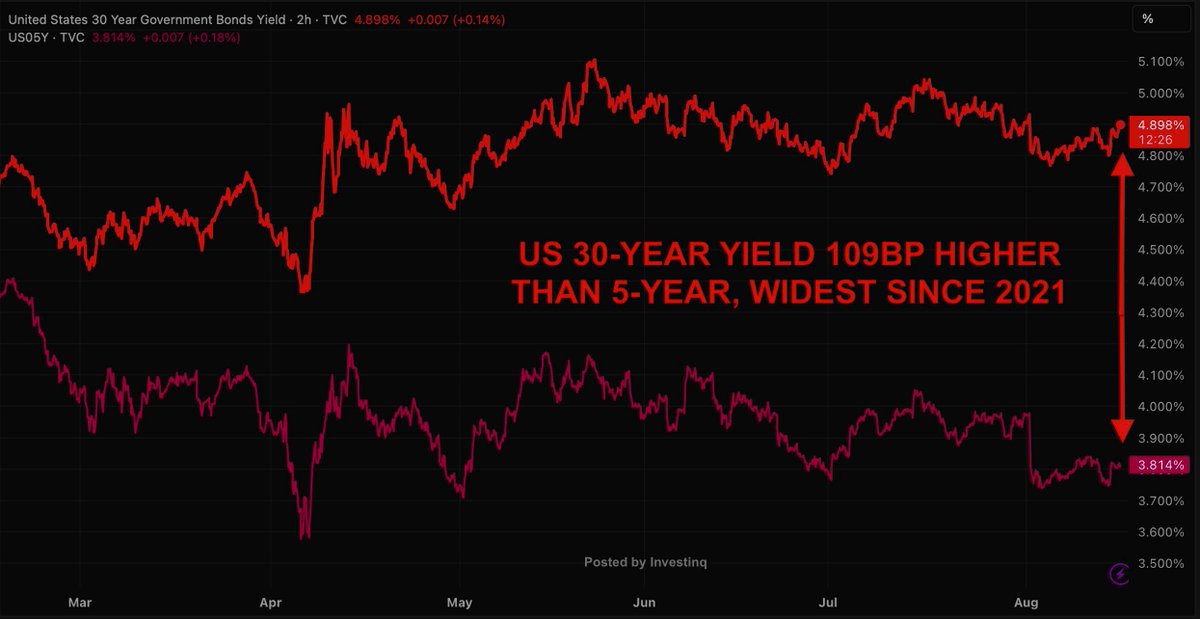
The gap between 30-year and 5-year Treasury yields just hit ~109 bps, the steepest since 2021.
Behind it is a story about debt, risk, and the Fed.
( a thread)
The gap between 30-year and 5-year Treasury yields just hit ~109 bps, the steepest since 2021.
Behind it is a story about debt, risk, and the Fed.
( a thread)
A basis point (bp) is 0.01%. So 109 bps = 1.09%.
The “5s30s spread” is simply the yield on the 30-year Treasury minus the yield on the 5-year.
When that spread increases, the yield curve is steepening, long-term rates rising faster (or falling slower) than short-term rates.
The “5s30s spread” is simply the yield on the 30-year Treasury minus the yield on the 5-year.
When that spread increases, the yield curve is steepening, long-term rates rising faster (or falling slower) than short-term rates.
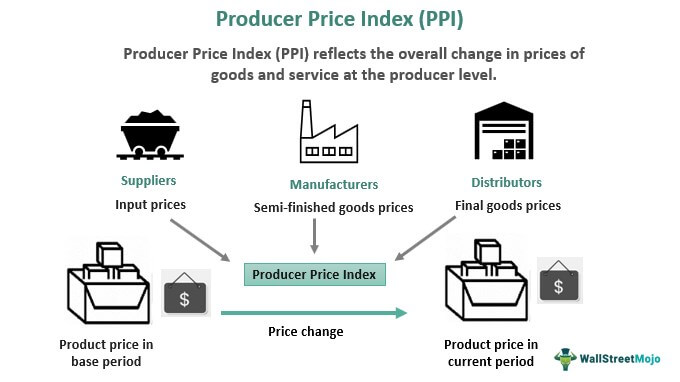
So what’s a Treasury? Two answers:
(a) The U.S. Department of the Treasury, the branch that handles taxes, spending, and borrowing when the government runs a deficit.
(b) Treasury securities, the IOUs it sells: Bills (≤1y), Notes (2–10y), Bonds (20–30y).
(a) The U.S. Department of the Treasury, the branch that handles taxes, spending, and borrowing when the government runs a deficit.
(b) Treasury securities, the IOUs it sells: Bills (≤1y), Notes (2–10y), Bonds (20–30y).
You buy one → you lend money to the U.S. government → you earn yield (interest) until it matures.
That yield is the annualized return if held to maturity but yields move daily as prices change.
If demand falls and price drops, the yield rises. Price ↓ = Yield ↑.
That yield is the annualized return if held to maturity but yields move daily as prices change.
If demand falls and price drops, the yield rises. Price ↓ = Yield ↑.
The yield curve is a chart plotting Treasury yields from shortest to longest maturity.
Normally, longer maturities pay more (more time = more risk). That’s an upward slope.
If short rates rise above long rates, the curve inverts. If it steepens, long rates climb relative to short.
Normally, longer maturities pay more (more time = more risk). That’s an upward slope.
If short rates rise above long rates, the curve inverts. If it steepens, long rates climb relative to short.
Why steepening now? Two forces:
• Short end (5-year): falling because traders expect the Federal Reserve to cut rates by ~0.75–1.00% this year.
• Long end (30-year): not falling actually rising because of term premium.
• Short end (5-year): falling because traders expect the Federal Reserve to cut rates by ~0.75–1.00% this year.
• Long end (30-year): not falling actually rising because of term premium.
Term premium is the extra yield investors demand for tying up money for decades.
It’s hazard pay for uncertainty, not just inflation, but also: huge fiscal deficits, massive issuance, liquidity risks, political uncertainty, and buyer constraints.
It’s hazard pay for uncertainty, not just inflation, but also: huge fiscal deficits, massive issuance, liquidity risks, political uncertainty, and buyer constraints.
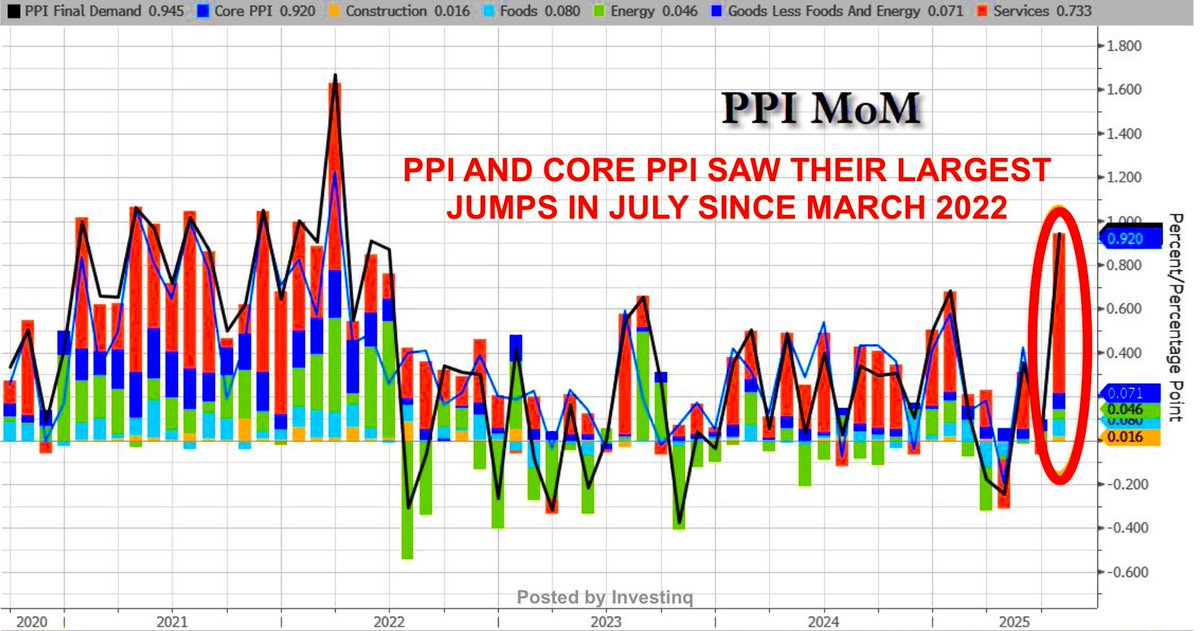
This is different from inflation expectations.
Those expectations measured via TIPS breakevens show 5-year inflation near ~3%, stable.
Term premium is the other part of yield: payment for risk and illiquidity, not just for expected price increases.
Those expectations measured via TIPS breakevens show 5-year inflation near ~3%, stable.
Term premium is the other part of yield: payment for risk and illiquidity, not just for expected price increases.
The mechanism pushing the long end higher starts with supply.
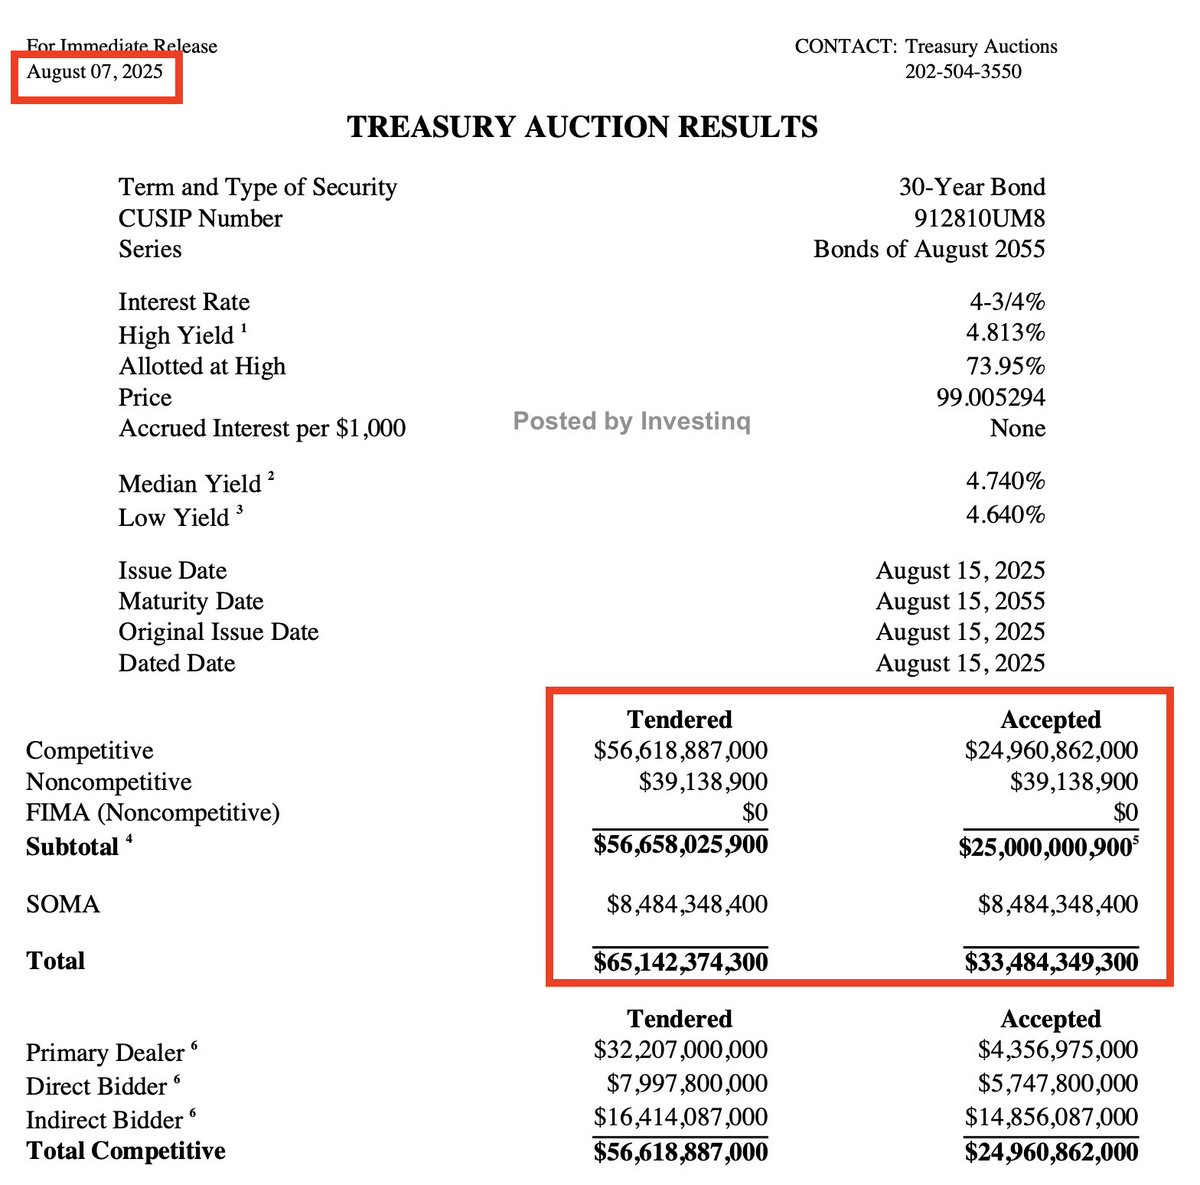
The Treasury is selling $25B of 30-year bonds each month.
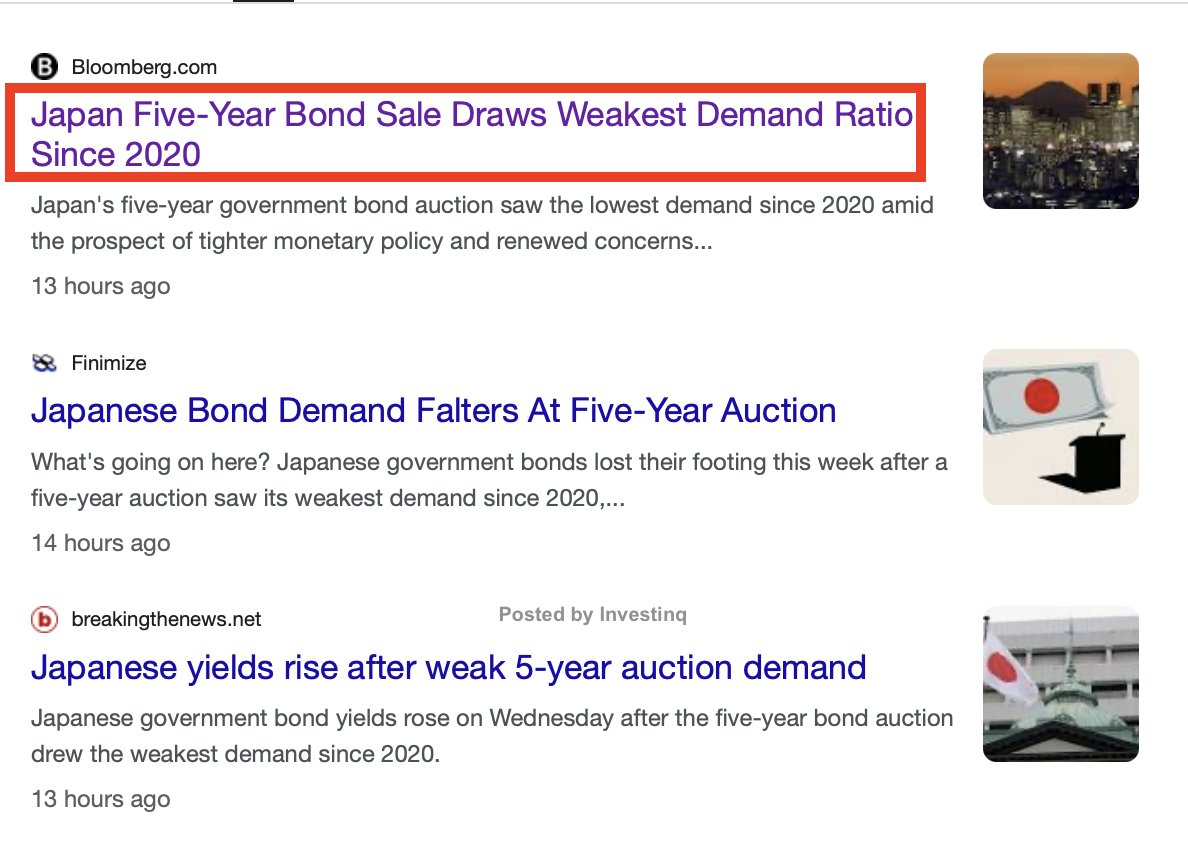
August’s auction had a bid-to-cover of 2.27 (vs ~2.43 average). Weaker demand pushes prices down and yields up to attract buyers.
The Treasury is selling $25B of 30-year bonds each month.
August’s auction had a bid-to-cover of 2.27 (vs ~2.43 average). Weaker demand pushes prices down and yields up to attract buyers.
Who bids at these auctions?
• Primary dealers — big banks making markets in Treasuries
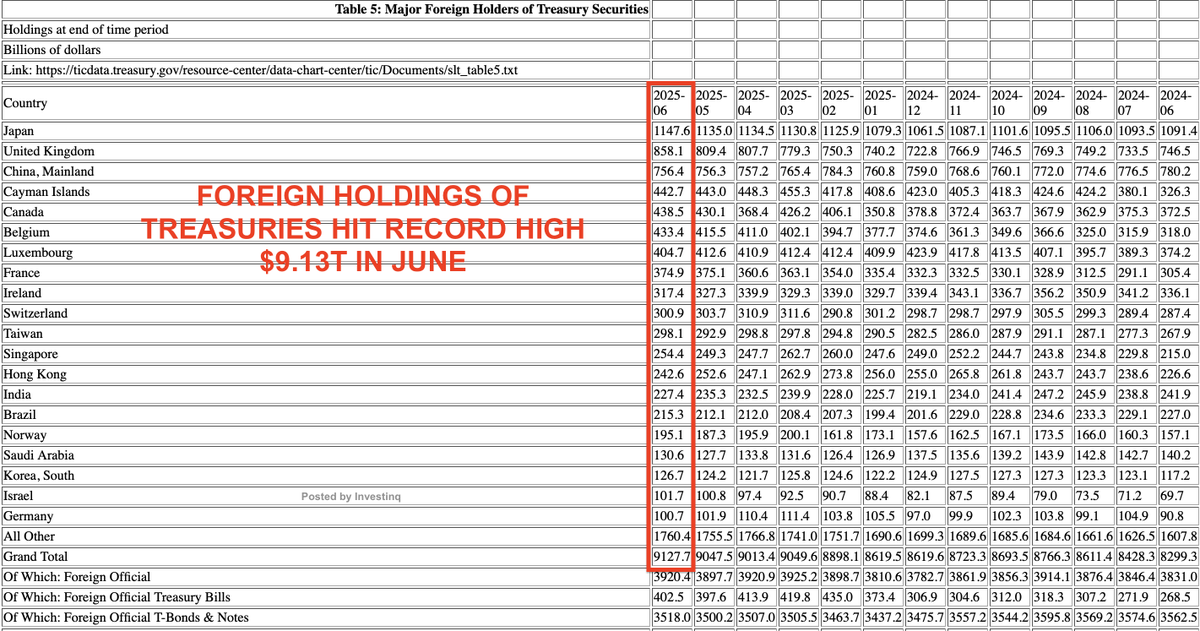
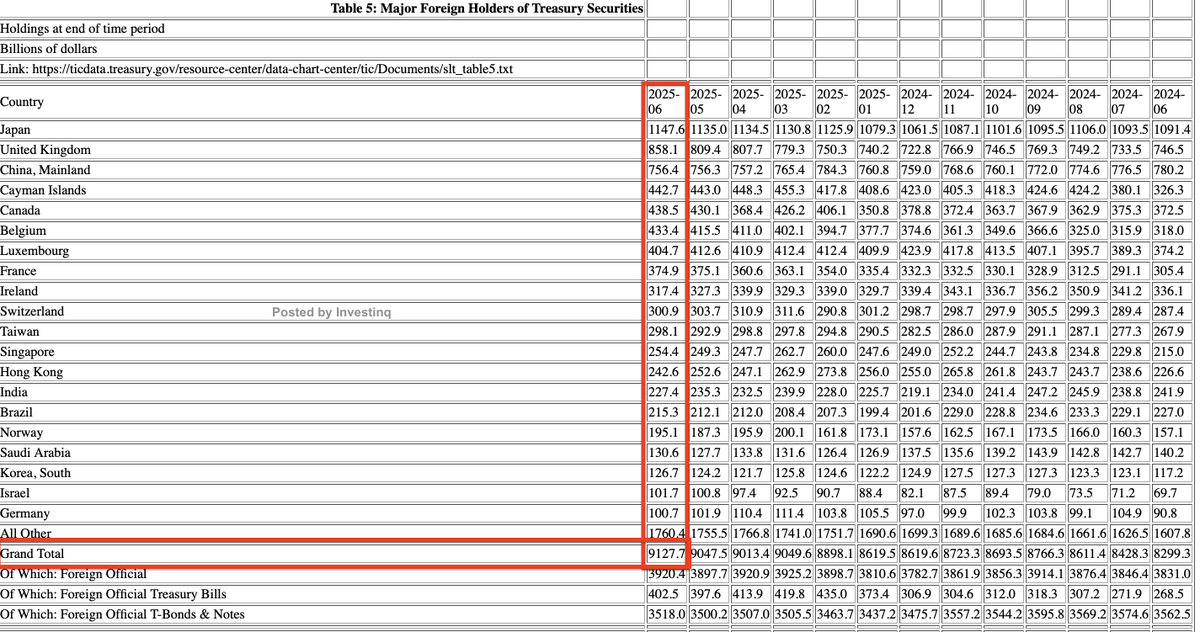
• Indirect bidders — foreign central banks, sovereign funds, asset managers
• Direct bidders — pensions, funds, hedge funds, individuals
If any group steps back, yields rise.
• Primary dealers — big banks making markets in Treasuries
• Indirect bidders — foreign central banks, sovereign funds, asset managers
• Direct bidders — pensions, funds, hedge funds, individuals
If any group steps back, yields rise.
The long end moves more than the short end because of duration and convexity.
• Duration = sensitivity of price to yield changes. 30-years swing far more than 5-years.
• Convexity = how that sensitivity shifts as yields move, amplifying volatility in long bonds.
• Duration = sensitivity of price to yield changes. 30-years swing far more than 5-years.
• Convexity = how that sensitivity shifts as yields move, amplifying volatility in long bonds.
Market structure is amplifying this.
The Fed is doing Quantitative Tightening (QT), letting bonds roll off without reinvestment. That means the private market must absorb more supply.
Banks face capital rules, limiting how much they can hold.
The Fed is doing Quantitative Tightening (QT), letting bonds roll off without reinvestment. That means the private market must absorb more supply.
Banks face capital rules, limiting how much they can hold.
Then come technical flows.
Funds run curve trades (steepeners/flatteners), basis trades (cash vs futures), and swap-spread trades.
When volatility spikes tariffs, headlines, trading errors these unwind fast, forcing big 30-year sales and steepening the spread.
Funds run curve trades (steepeners/flatteners), basis trades (cash vs futures), and swap-spread trades.
When volatility spikes tariffs, headlines, trading errors these unwind fast, forcing big 30-year sales and steepening the spread.
A vivid example:
In April, tariff headlines forced hedge funds to dump 30-years, spiking yields ~46 bps in a week.
On Aug 7, a suspected “fat-finger” sale of 80,000 10-year futures pushed yields higher right before a weak 30-year auction.
In April, tariff headlines forced hedge funds to dump 30-years, spiking yields ~46 bps in a week.
On Aug 7, a suspected “fat-finger” sale of 80,000 10-year futures pushed yields higher right before a weak 30-year auction.
Foreign capital adds another twist.
International buyers often hedge U.S. bonds against currency swings using short-term rates.
Fed cuts lower hedge costs, making long Treasuries more attractive but supply still outruns demand so far.
International buyers often hedge U.S. bonds against currency swings using short-term rates.
Fed cuts lower hedge costs, making long Treasuries more attractive but supply still outruns demand so far.
The math behind long yields: Nominal long yield ≈ average expected short rates + term premium. Right now:
• Expected short rates → falling
• Term premium → rising
The second term is driving most of the increase.
• Expected short rates → falling
• Term premium → rising
The second term is driving most of the increase.
Steep curves can mean two things:
• Good-steep: growth optimism, early-cycle expansion.
• Risk-steep: hazard pay for uncertainty.
Today’s is a risk-steep, deficits are large, issuance is heavy, and buyers want more compensation.
• Good-steep: growth optimism, early-cycle expansion.
• Risk-steep: hazard pay for uncertainty.
Today’s is a risk-steep, deficits are large, issuance is heavy, and buyers want more compensation.
Real-world effects:
• Mortgage rates (tied to long yields) stay mid-6%+, slowing housing.
• Corporate borrowing costs rise, delaying projects.
• Government interest bills balloon as cheap debt is replaced with expensive debt.
• Mortgage rates (tied to long yields) stay mid-6%+, slowing housing.
• Corporate borrowing costs rise, delaying projects.
• Government interest bills balloon as cheap debt is replaced with expensive debt.
Who likes this? Banks.
They borrow short (cheap) and lend long (higher), pocketing the difference net interest margin.
Steeper curves can boost profits and lending if borrowers can handle higher long-term rates.
They borrow short (cheap) and lend long (higher), pocketing the difference net interest margin.
Steeper curves can boost profits and lending if borrowers can handle higher long-term rates.
For markets, it’s mixed. If steepness = Fed cuts + stable long yields, stocks (esp. banks) may rally.
If steepness = long yields rising on fiscal fear, rate-sensitive sectors like real estate and growth tech could take a hit.
If steepness = long yields rising on fiscal fear, rate-sensitive sectors like real estate and growth tech could take a hit.
Will the inversion end? Probably.
If the Fed cuts, short rates drop, keeping the curve upward-sloping.
The question: will long yields ease, or will term premium keep the steepness elevated?
If the Fed cuts, short rates drop, keeping the curve upward-sloping.
The question: will long yields ease, or will term premium keep the steepness elevated?
What could flatten it?
• Smaller long-term issuance
• Regulatory relief for banks
• Lower macro uncertainty
• A growth scare dragging long yields down faster than the Fed cuts
• Smaller long-term issuance
• Regulatory relief for banks
• Lower macro uncertainty
• A growth scare dragging long yields down faster than the Fed cuts
What could steepen it further?
• Bigger auctions
• Persistent weak demand
• Technical blow-ups in futures/swaps
• Sticky inflation limiting Fed’s ability to cut
• Bigger auctions
• Persistent weak demand
• Technical blow-ups in futures/swaps
• Sticky inflation limiting Fed’s ability to cut
Bottom line: This isn’t your “growth is back” steepener.
It’s a risk-premium steepener, short end anchored by Fed cut expectations, long end lifted by deficits, supply gluts, and market structure stress.
It looks “normal” again but for reasons that are anything but.
It’s a risk-premium steepener, short end anchored by Fed cut expectations, long end lifted by deficits, supply gluts, and market structure stress.
It looks “normal” again but for reasons that are anything but.
If you found these insights valuable: Sign up for my FREE newsletter! thestockmarket.news
I hope you've found this thread helpful.
Follow me @_Investinq for more.
Like/Repost the quote below if you can:
Follow me @_Investinq for more.
Like/Repost the quote below if you can:
https://x.com/_investinq/status/1956375289337880961?s=46
• • •
Missing some Tweet in this thread? You can try to
force a refresh