These 7 statistical analysis concepts have helped me as an AI Data Scientist.
Let's go: 🧵
Let's go: 🧵
Step 1: Learn These Descriptive Statistics
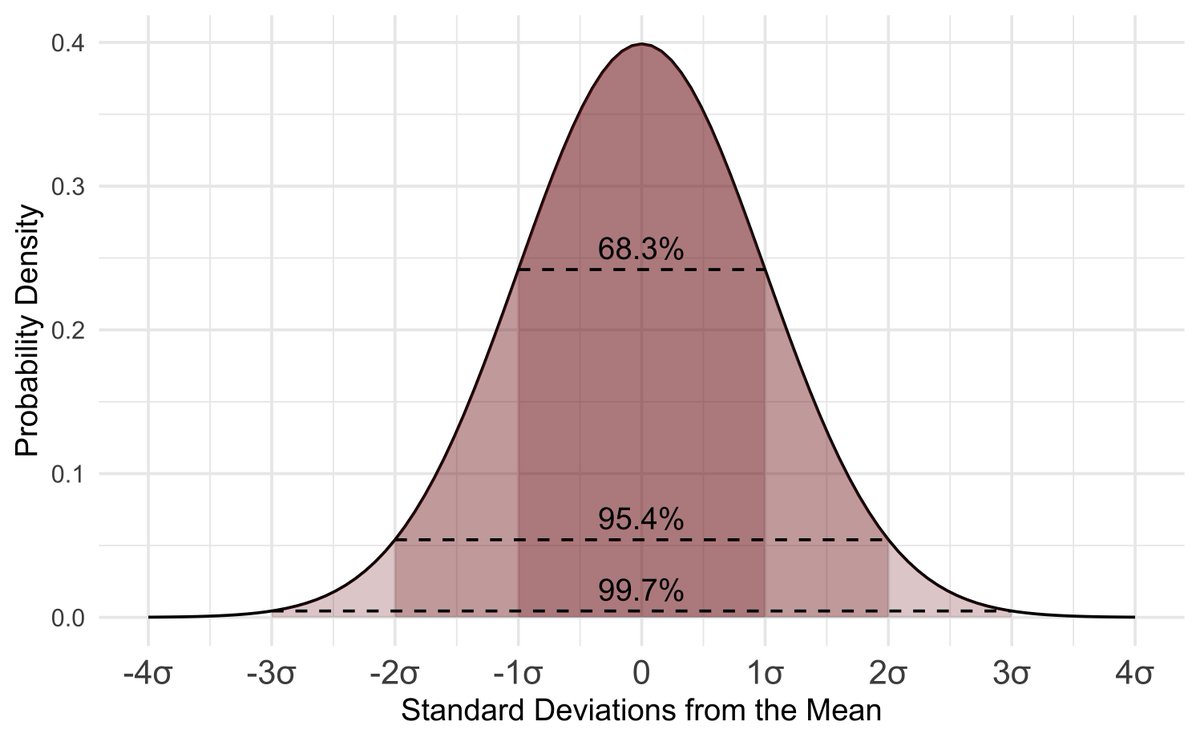
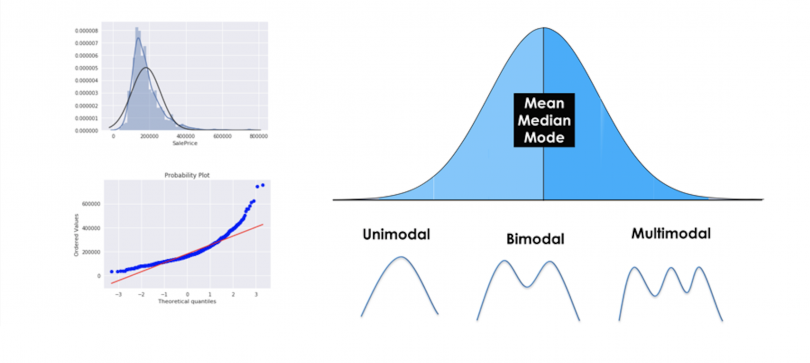
Mean, median, mode, variance, standard deviation. Used to summarize data and spot variability. These are key for any data scientist to understand what’s in front of them in their data sets.
Mean, median, mode, variance, standard deviation. Used to summarize data and spot variability. These are key for any data scientist to understand what’s in front of them in their data sets.
2. Learn Probability
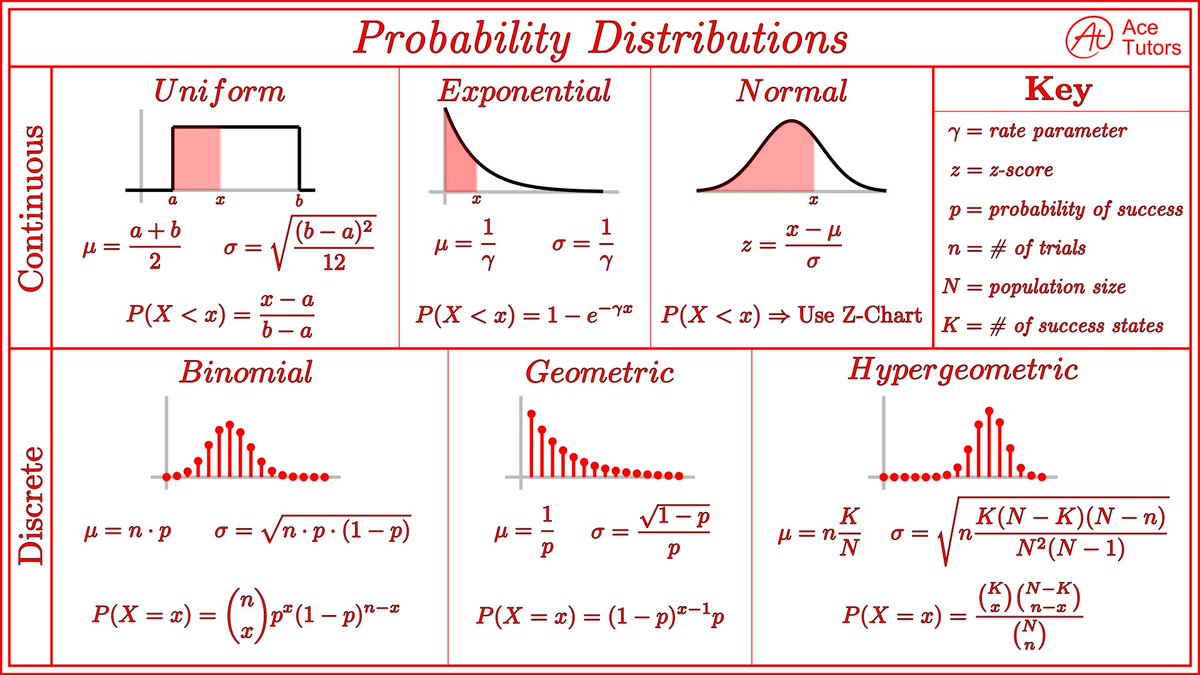
Know your distributions (Normal, Binomial) & Bayes’ Theorem. The backbone of modeling and reasoning under uncertainty. Central Limit Theorem is a must too.
Know your distributions (Normal, Binomial) & Bayes’ Theorem. The backbone of modeling and reasoning under uncertainty. Central Limit Theorem is a must too.
3. Hypothesis Testing:
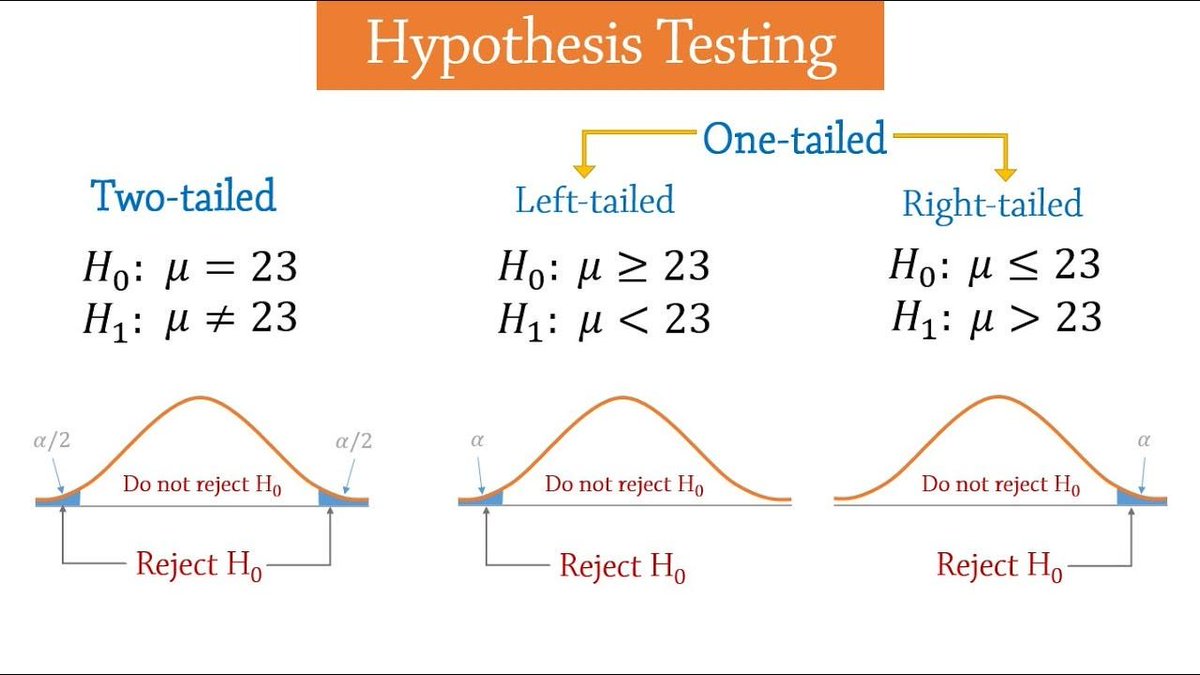
P-values, confidence intervals, t-tests. Learn how to validate findings and quantify uncertainty. Don’t skip Type I/II errors—they’re real-world pitfalls. Type 2 errors especially.
P-values, confidence intervals, t-tests. Learn how to validate findings and quantify uncertainty. Don’t skip Type I/II errors—they’re real-world pitfalls. Type 2 errors especially.
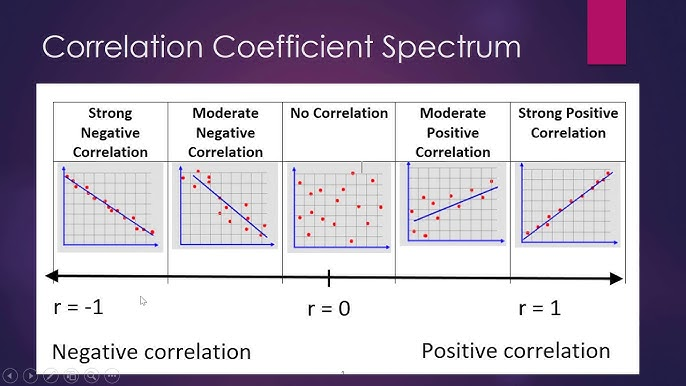
4. Correlation:
Pearson or Spearman coefficients show relationships, but causation isn’t guaranteed. Watch for confounders to avoid bad calls. Pearson alone has helped me identify tons of business insights.
Pearson or Spearman coefficients show relationships, but causation isn’t guaranteed. Watch for confounders to avoid bad calls. Pearson alone has helped me identify tons of business insights.
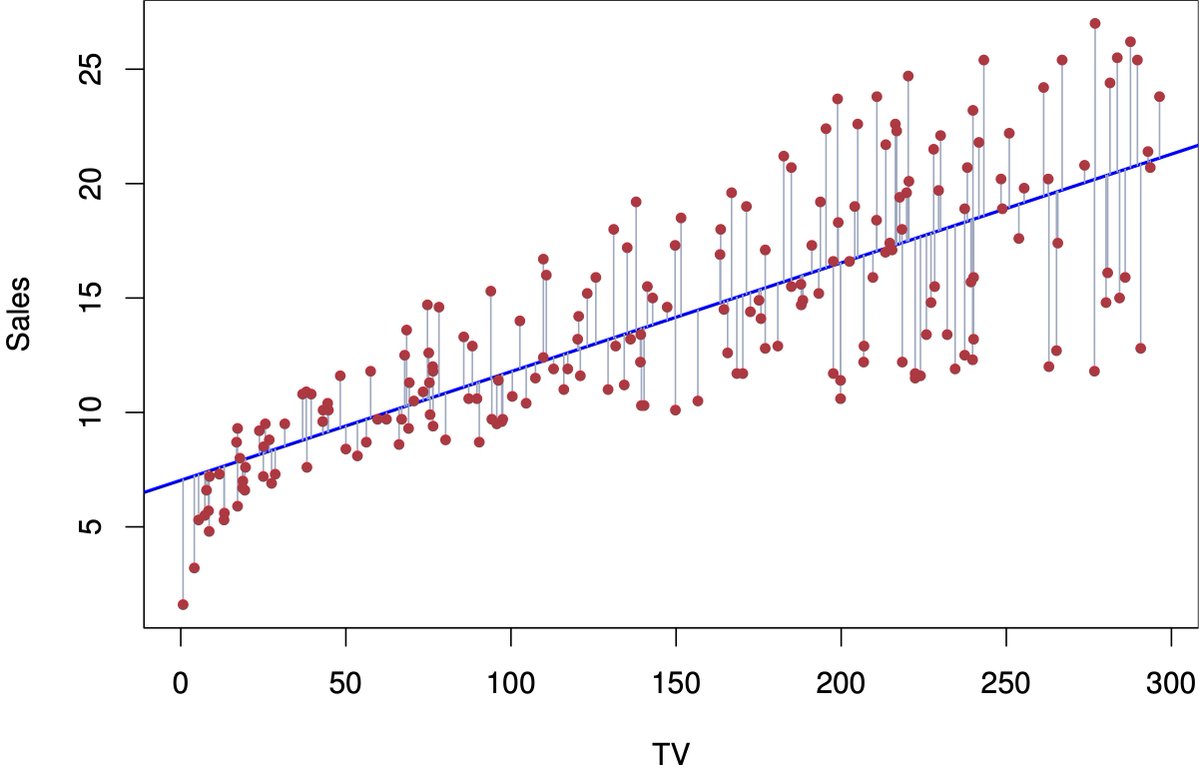
5. Regression:
Linear for prediction, logistic for classification. Master coefficients, R-squared, and assumptions (normality, linearity).
Linear for prediction, logistic for classification. Master coefficients, R-squared, and assumptions (normality, linearity).
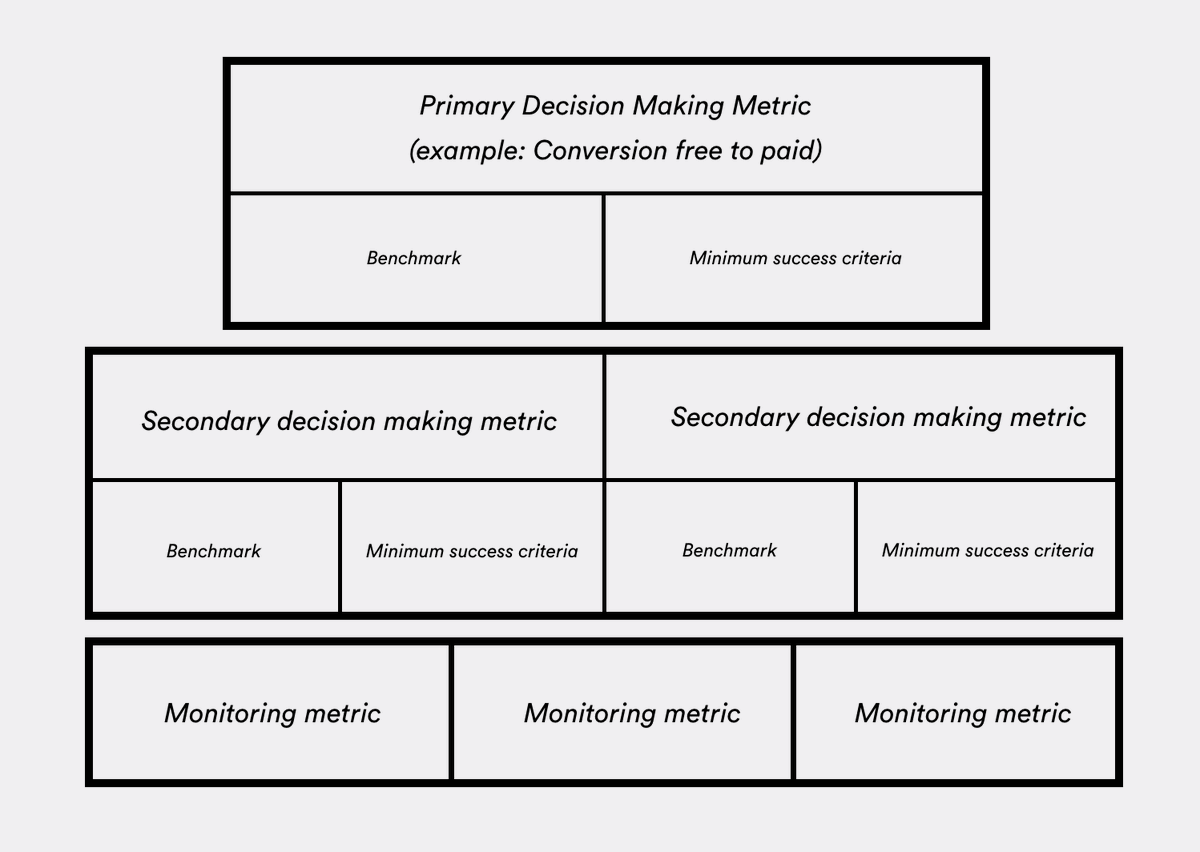
6. Experimental Design:
Random sampling, A/B testing, statistical power. Get the setup right or your conclusions will crumble. Sample size matters.
Random sampling, A/B testing, statistical power. Get the setup right or your conclusions will crumble. Sample size matters.
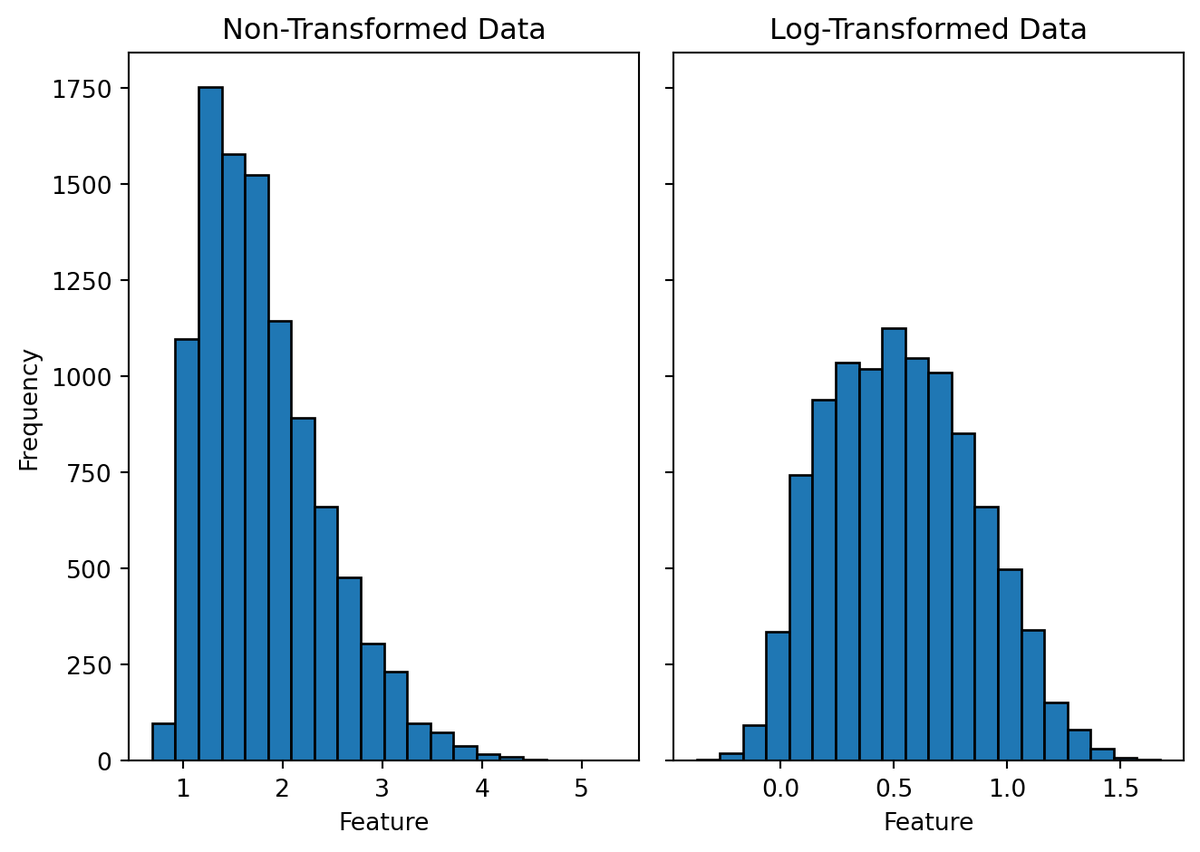
7. Practical Stats Transformations:
Outlier detection (IQR, z-scores), data transformations (log, standardize). Clean, prep, and interpret like a pro.
Outlier detection (IQR, z-scores), data transformations (log, standardize). Clean, prep, and interpret like a pro.
8. There's a new problem that has surfaced that is changing data science-- Companies NOW want AI.
Yet 99% of data scientists are ignoring it.
That's a huge advantage to you. I'd like to help.
Yet 99% of data scientists are ignoring it.
That's a huge advantage to you. I'd like to help.
On Wednesday, August 20th, I'm sharing one of my best AI Projects:
How I built a Customer Segmentation Agent with Python + AI
Register here (1570+ registered): learn.business-science.io/ai-register
How I built a Customer Segmentation Agent with Python + AI
Register here (1570+ registered): learn.business-science.io/ai-register

That's a wrap! Over the next 24 days, I'm sharing the 24 concepts that helped me become a data scientist.
If you enjoyed this thread:
1. Follow me @mdancho84 for more of these
2. RT the tweet below to share this thread with your audience
If you enjoyed this thread:
1. Follow me @mdancho84 for more of these
2. RT the tweet below to share this thread with your audience
https://twitter.com/815555071517872128/status/1956379239474765887
P.S. Want free AI, Machine Learning, and Data Science Tips with Python code every Sunday?
Don't forget to sign up for my AI/ML Tips Newsletter Here: learn.business-science.io/free-ai-tips
Don't forget to sign up for my AI/ML Tips Newsletter Here: learn.business-science.io/free-ai-tips
• • •
Missing some Tweet in this thread? You can try to
force a refresh