1/
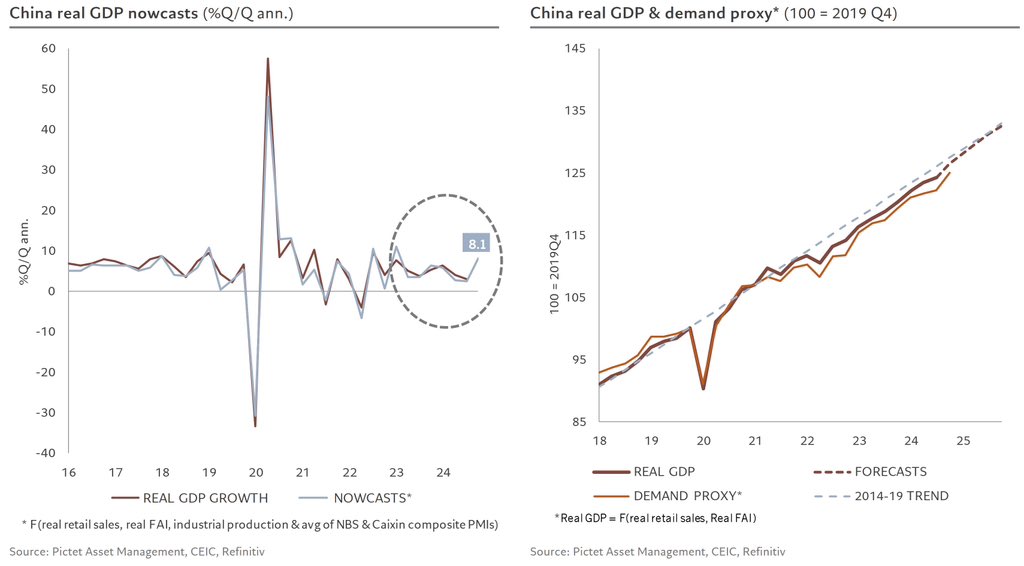
After a solid first half of the year, July saw a sharp slowdown driven by contracting domestic demand.
Our Q3 GDP nowcast points to a contraction of more than 2% q/q annualised, the weakest quarterly pace since early 2022
After a solid first half of the year, July saw a sharp slowdown driven by contracting domestic demand.
Our Q3 GDP nowcast points to a contraction of more than 2% q/q annualised, the weakest quarterly pace since early 2022

2/
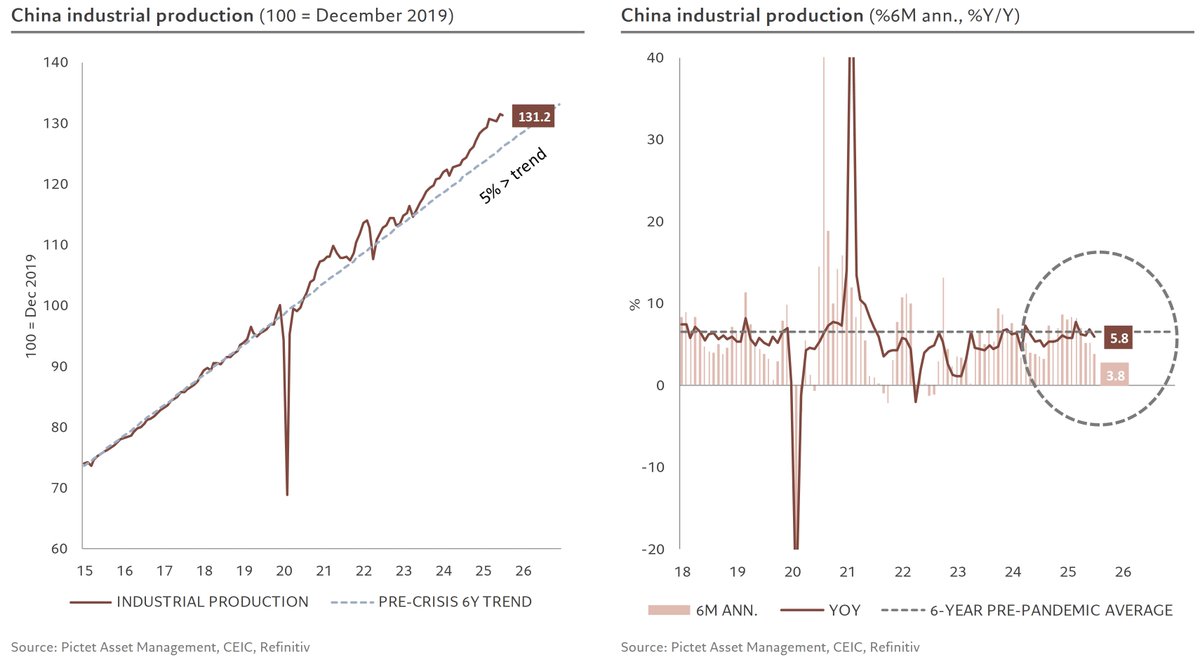
Industrial production also slowed. While still ~4% above its pre-pandemic trend and up a decent 5.8% y/y, the 6-month annualised pace dropped to just 3.8%, down from more than 5% in June
Industrial production also slowed. While still ~4% above its pre-pandemic trend and up a decent 5.8% y/y, the 6-month annualised pace dropped to just 3.8%, down from more than 5% in June
3/
Consumption spending (incl. services) had been recovering through June, standing only 1% below its pre-pandemic trend. In July, a decline in retail sales, not the most dynamic part of consumption, pulled 6-month annualised growth down to just 0.8%.
Consumption spending (incl. services) had been recovering through June, standing only 1% below its pre-pandemic trend. In July, a decline in retail sales, not the most dynamic part of consumption, pulled 6-month annualised growth down to just 0.8%.

4/
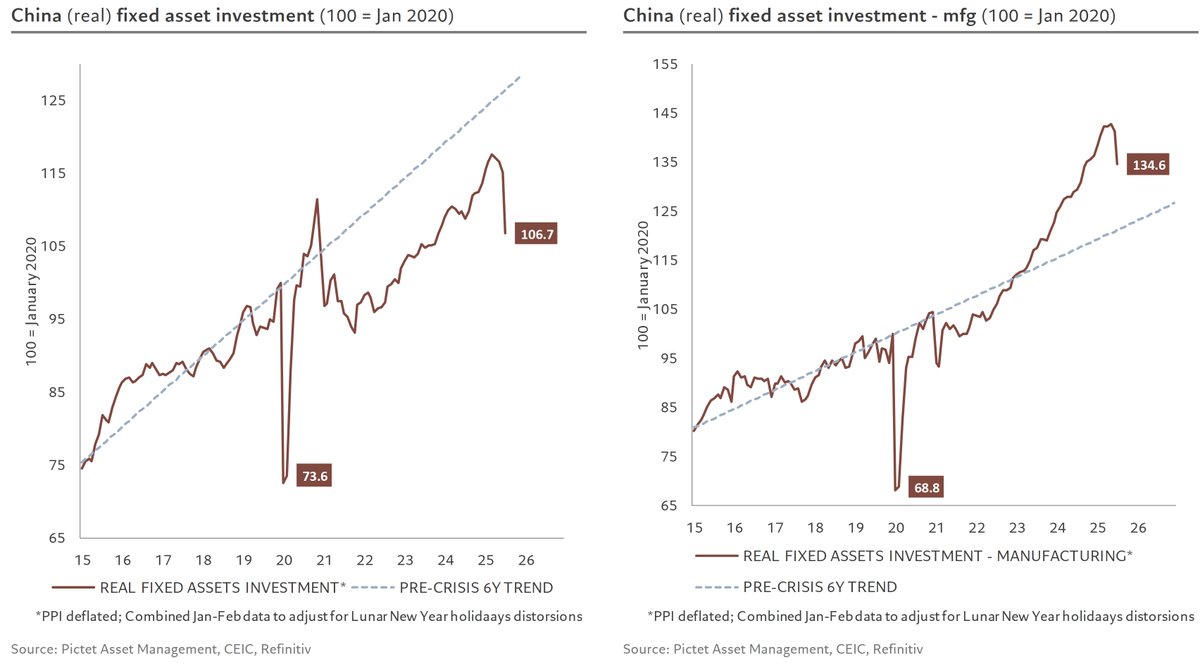
The biggest July surprise came from fixed asset investment: all three major components contracted, including manufacturing investment, which had run well above pre-Covid norms for over two years
The biggest July surprise came from fixed asset investment: all three major components contracted, including manufacturing investment, which had run well above pre-Covid norms for over two years
5/
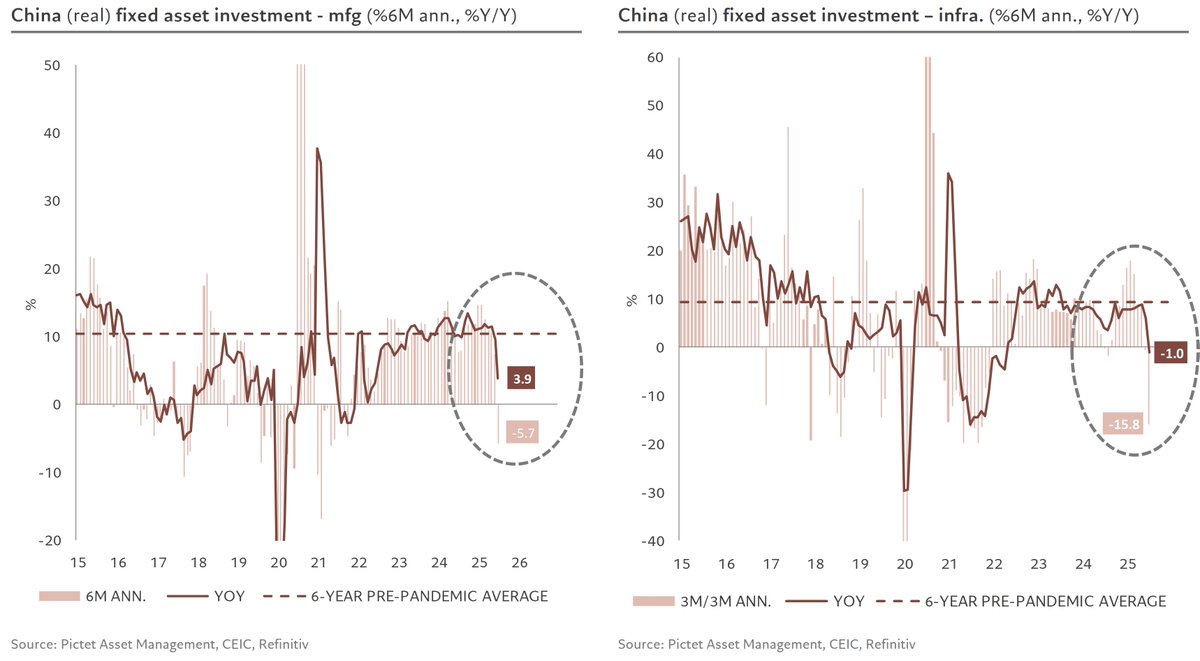
As a result, real investment is down 1.9% y/y and over 14% at a 6-month annualised pace.
Manufacturing remains positive y/y (+3.9%) but is falling ~6% on a 6-month basis; infrastructure has plunged (-16% 6m ann.).
Part of the pullback reflects the campaign against “disorderly” or “involutionary” competition, aimed at curbing overcapacity and deflation
6/
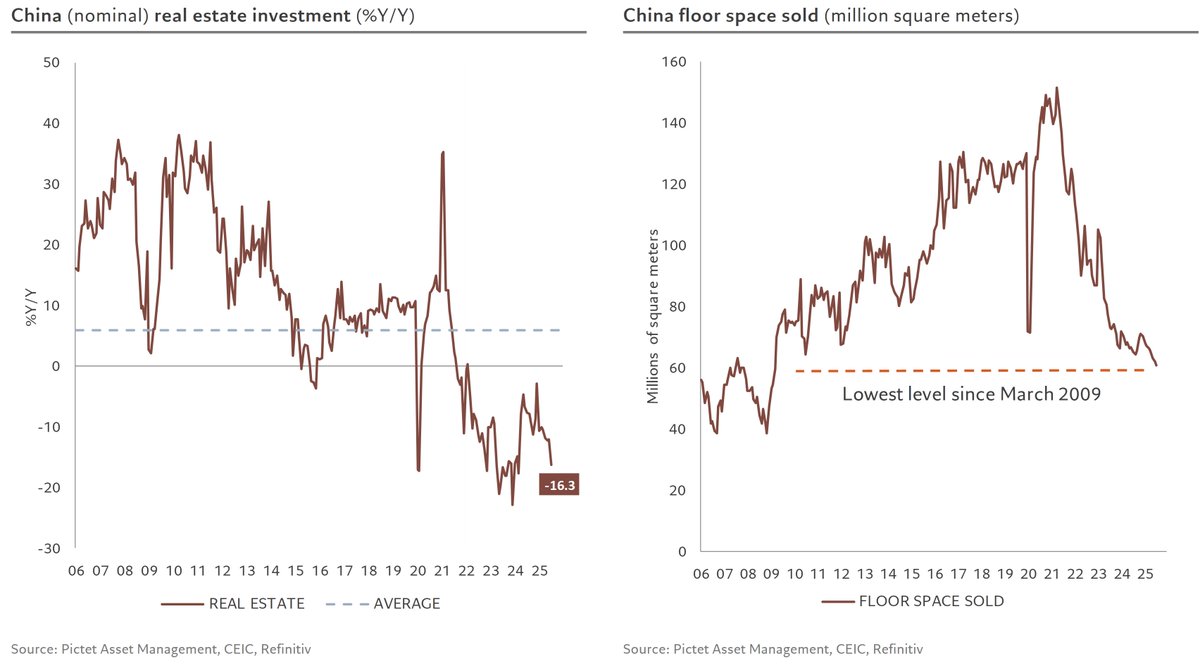
Real-estate investment also weighed heavily, contracting 16% y/y, with demand for residential space falling to new lows since 2009.
Real-estate investment also weighed heavily, contracting 16% y/y, with demand for residential space falling to new lows since 2009.
7/
Residential supply remains flat at its lowest level in over 20 years, keeping unsold inventories at 22 months of demand, only slightly lower than before, but far from a normal ~13-month level
Residential supply remains flat at its lowest level in over 20 years, keeping unsold inventories at 22 months of demand, only slightly lower than before, but far from a normal ~13-month level

8/
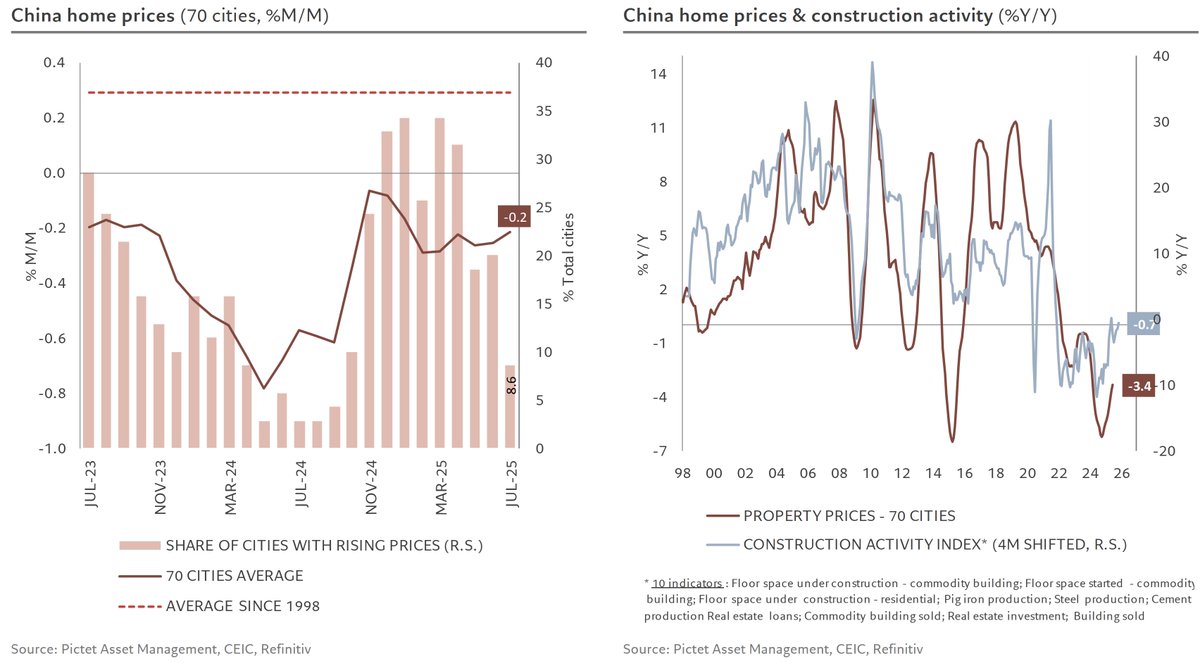
These inventories keep downward pressure on prices (-0.2% m/m), with fewer than 20% of cities recording gains.
The only silver lining: the sector is no longer falling further, our activity index is flat y/y, meaning real estate no longer drags significantly on overall growth
These inventories keep downward pressure on prices (-0.2% m/m), with fewer than 20% of cities recording gains.
The only silver lining: the sector is no longer falling further, our activity index is flat y/y, meaning real estate no longer drags significantly on overall growth
9/
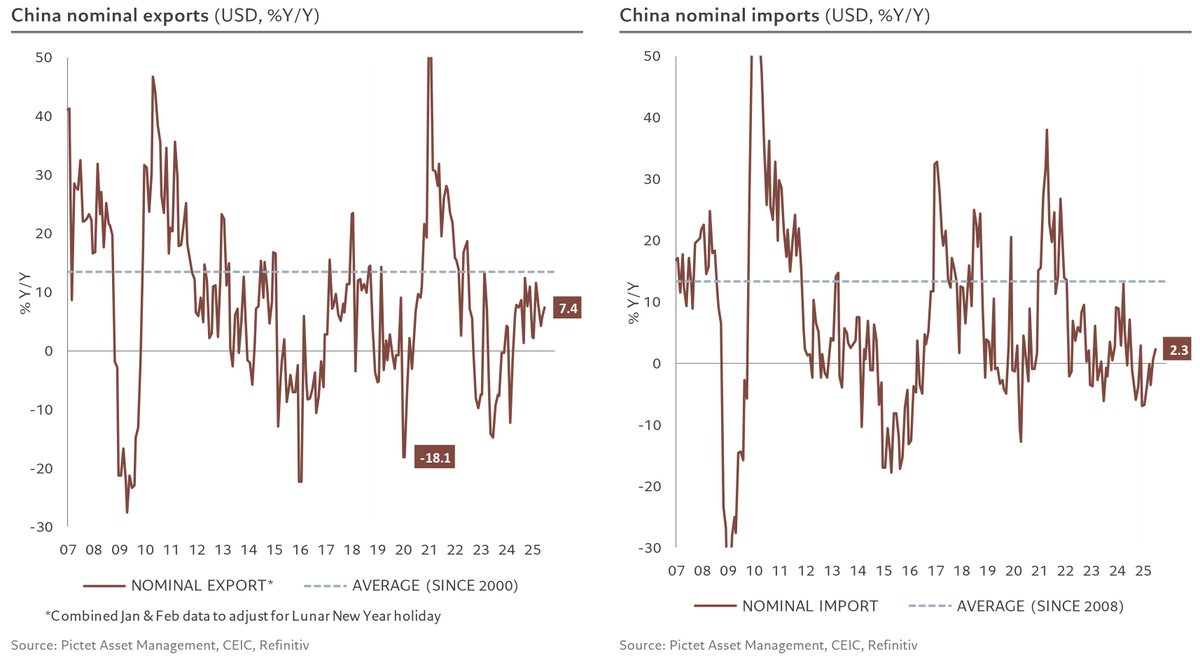
External demand remains a bright spot in value terms: exports rose >7% y/y in July, while imports returned to positive territory (+2% y/y)
External demand remains a bright spot in value terms: exports rose >7% y/y in July, while imports returned to positive territory (+2% y/y)
10/
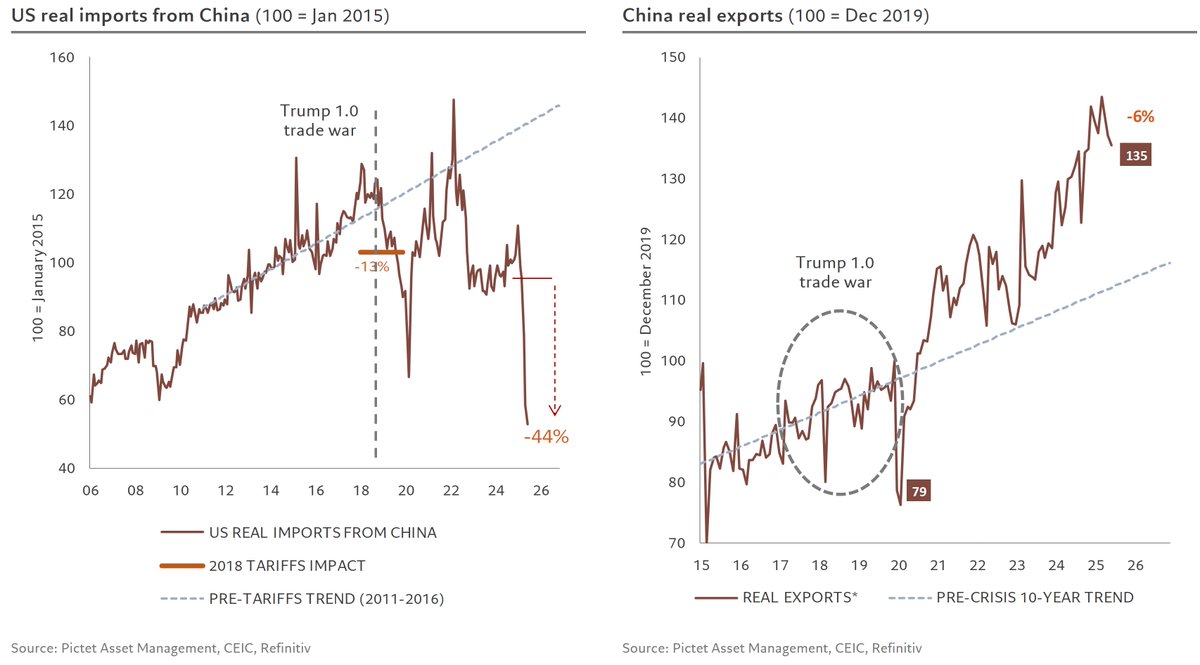
In volume terms (June data), exports to the US have dropped ~44% since March, pulling total Chinese exports down 6% over the same period. This decline is entirely due to the US (13% of China’s exports); shipments to the rest of the world remain flat, yet at high levels
In volume terms (June data), exports to the US have dropped ~44% since March, pulling total Chinese exports down 6% over the same period. This decline is entirely due to the US (13% of China’s exports); shipments to the rest of the world remain flat, yet at high levels
11/
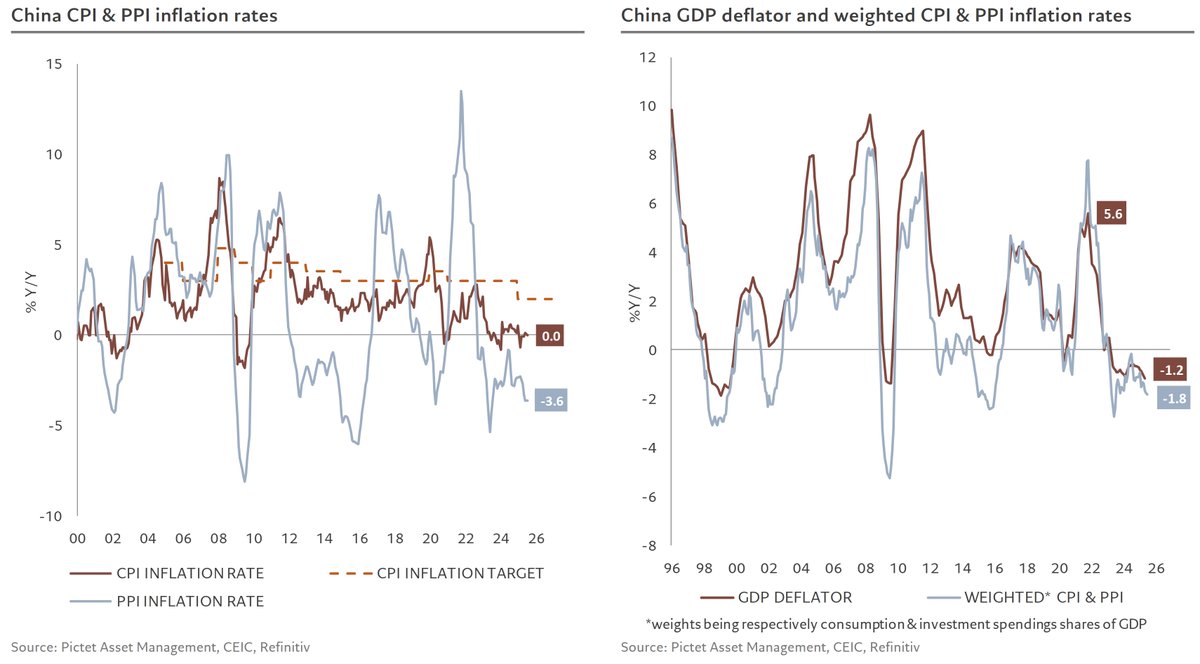
On prices, CPI edged back to 0% y/y, while PPI fell 3.6% y/y. Together, they signal another deterioration in the GDP deflator in July
On prices, CPI edged back to 0% y/y, while PPI fell 3.6% y/y. Together, they signal another deterioration in the GDP deflator in July
12/
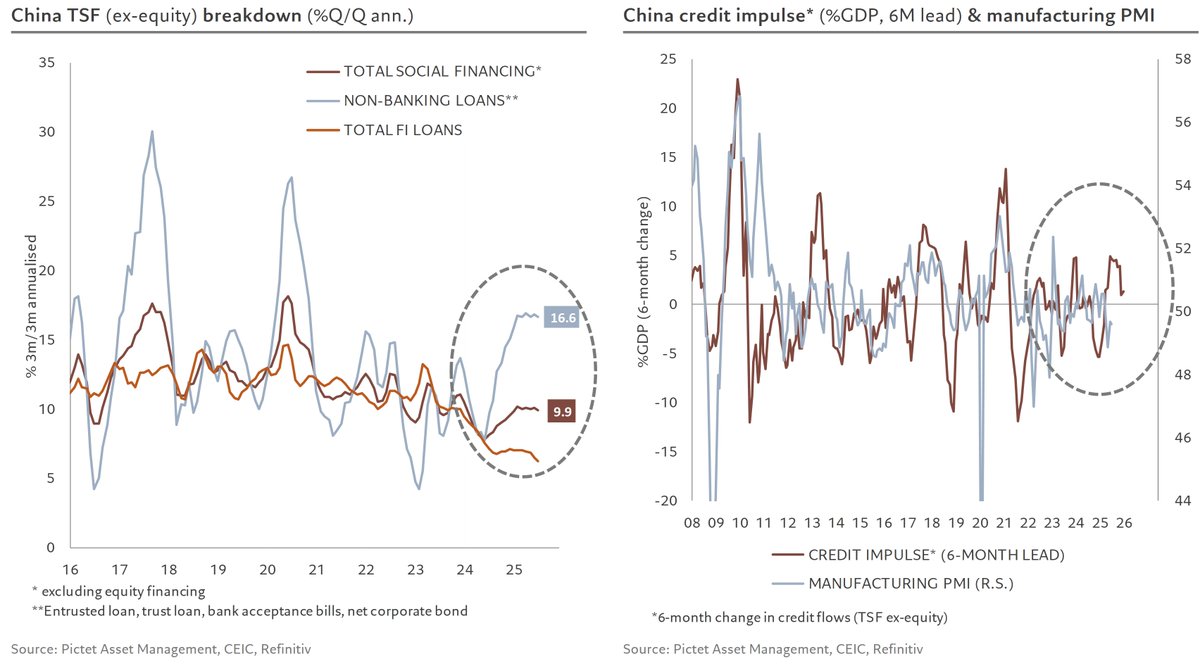
Credit conditions also softened, with the first monthly contraction in new RMB loans in 20 years.
Thanks to strong government bond issuance, the credit impulse remained broadly unchanged and still positive.
After deferring broad policy stimulus following six resilient months, the authorities may now have little choice but to bring it forward
• • •
Missing some Tweet in this thread? You can try to
force a refresh