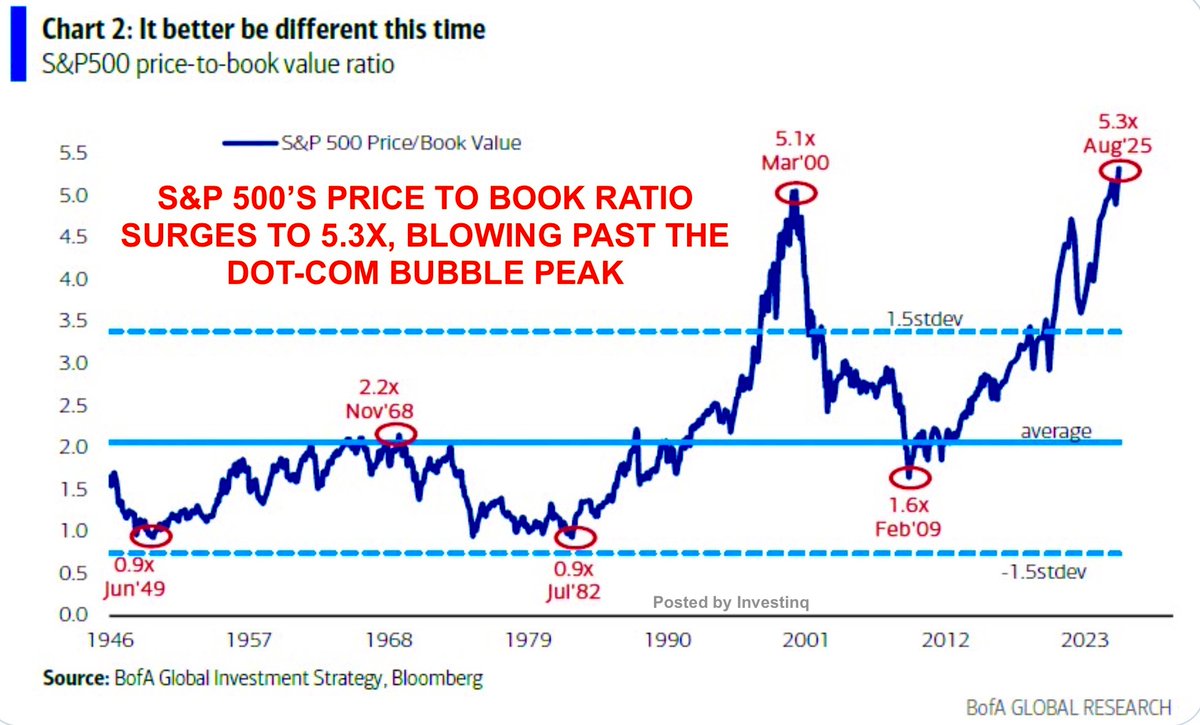
🚨 The S&P 500 just broke a record not seen since the dot-com bubble.
Price-to-book ratio: 5.3×. That’s higher than 2000’s peak.
History says we’re playing with fire.
( a thread)
Price-to-book ratio: 5.3×. That’s higher than 2000’s peak.
History says we’re playing with fire.
( a thread)
What exactly is P/B? Think of it as the market price of a company compared to its “book value,” which is basically assets minus liabilities (net worth on paper).
If P/B = 5, investors are paying $5 for every $1 of assets.
A simple measure, but one that reveals when markets are stretched.
If P/B = 5, investors are paying $5 for every $1 of assets.
A simple measure, but one that reveals when markets are stretched.
Why care? Because history shows P/B extremes precede turning points.
• In 1968, when P/B hit ~2.2×, the S&P 500 lost 36% by 1970.
• In 2000, P/B peaked at 5.1×, and the dot-com bust followed.
In contrast, cheap levels (0.9× in 1982, 1.6× in 2009) marked the start of multi-year bull runs.
• In 1968, when P/B hit ~2.2×, the S&P 500 lost 36% by 1970.
• In 2000, P/B peaked at 5.1×, and the dot-com bust followed.
In contrast, cheap levels (0.9× in 1982, 1.6× in 2009) marked the start of multi-year bull runs.
The pattern is consistent: high ratios = muted returns or crashes, low ratios = strong gains.
Valuations don’t predict the exact timing, but they’re great at signaling risk.
Today, at 5.3×, the U.S. market sits in uncharted waters, higher than any peak investors have seen before.
Valuations don’t predict the exact timing, but they’re great at signaling risk.
Today, at 5.3×, the U.S. market sits in uncharted waters, higher than any peak investors have seen before.
Here’s the kicker: this record isn’t broad-based. It’s being driven by a handful of megacap tech + AI names.
Nvidia alone now accounts for 8.2% of the entire S&P 500, more weight than any single stock has carried in decades.
The top 10 stocks make up ~40% of the index.
Nvidia alone now accounts for 8.2% of the entire S&P 500, more weight than any single stock has carried in decades.
The top 10 stocks make up ~40% of the index.
That concentration means the entire market is leaning on a few giants.
If they keep soaring, the index can hold but if just one or two stumble, the house of cards can wobble fast.
History shows narrow rallies leave markets more fragile than broad-based ones.
If they keep soaring, the index can hold but if just one or two stumble, the house of cards can wobble fast.
History shows narrow rallies leave markets more fragile than broad-based ones.
Step back and compare globally. 57% of U.S. firms trade above 3× book.
Europe? Only 32%. Japan? Just 16% and nearly 40% of Japanese firms trade below book, meaning the market values them less than their assets.
Emerging markets? ~1.8×. The U.S. looks like an outlier.
Europe? Only 32%. Japan? Just 16% and nearly 40% of Japanese firms trade below book, meaning the market values them less than their assets.
Emerging markets? ~1.8×. The U.S. looks like an outlier.
Translation: U.S. stocks are very expensive, while Europe, Japan, and EMs look cheap.
This gap matters. If U.S. multiples can’t hold, capital could flow abroad.
Investors already note that international markets trade at valuations that look far more “reasonable” by historical standards.
This gap matters. If U.S. multiples can’t hold, capital could flow abroad.
Investors already note that international markets trade at valuations that look far more “reasonable” by historical standards.
But here’s the twist: is book value even relevant today?
Book equity ignores intangibles like R&D, patents, software, data, and brands, the backbone of modern tech companies.
So when you divide price by book, today’s firms look more expensive than they may truly be.
Book equity ignores intangibles like R&D, patents, software, data, and brands, the backbone of modern tech companies.
So when you divide price by book, today’s firms look more expensive than they may truly be.
Example: a chipmaker spends billions on research, but that vanishes from book value.
Buybacks shrink equity, which mathematically pushes P/B higher.
So while today’s 5.3× number looks outrageous, it partly reflects how accounting lags behind intangible-heavy business models.
Buybacks shrink equity, which mathematically pushes P/B higher.
So while today’s 5.3× number looks outrageous, it partly reflects how accounting lags behind intangible-heavy business models.
The pattern is consistent: high ratios = muted returns or crashes, low ratios = strong gains.
Valuations don’t predict the exact timing, but they’re great at signaling risk.
Today, at 5.3×, the U.S. market sits in uncharted waters, higher than any peak investors have seen before.
Valuations don’t predict the exact timing, but they’re great at signaling risk.
Today, at 5.3×, the U.S. market sits in uncharted waters, higher than any peak investors have seen before.
Here’s the kicker: this record isn’t broad-based. It’s being driven by a handful of megacap tech + AI names.
Nvidia alone now accounts for 8.2% of the entire S&P 500, more weight than any single stock has carried in decades.
The top 10 stocks make up ~40% of the index.
Nvidia alone now accounts for 8.2% of the entire S&P 500, more weight than any single stock has carried in decades.
The top 10 stocks make up ~40% of the index.
That concentration means the entire market is leaning on a few giants.
If they keep soaring, the index can hold but if just one or two stumble, the house of cards can wobble fast.
History shows narrow rallies leave markets more fragile than broad-based ones.
If they keep soaring, the index can hold but if just one or two stumble, the house of cards can wobble fast.
History shows narrow rallies leave markets more fragile than broad-based ones.
Step back and compare globally. 57% of U.S. firms trade above 3× book.
Europe? Only 32%. Japan? Just 16% and nearly 40% of Japanese firms trade below book, meaning the market values them less than their assets.
Emerging markets? ~1.8×. The U.S. looks like an outlier.
Europe? Only 32%. Japan? Just 16% and nearly 40% of Japanese firms trade below book, meaning the market values them less than their assets.
Emerging markets? ~1.8×. The U.S. looks like an outlier.
Still, high valuations have never been friendly to long-term returns.
Bank of America says P/B and similar metrics predict 10-year returns far better than short-term moves.
And State Street reminds us: when sentiment cracked in 2000 and 2007, drawdowns were over 40%.
Bank of America says P/B and similar metrics predict 10-year returns far better than short-term moves.
And State Street reminds us: when sentiment cracked in 2000 and 2007, drawdowns were over 40%.
Translation: U.S. stocks are very expensive, while Europe, Japan, and EMs look cheap.
This gap matters. If U.S. multiples can’t hold, capital could flow abroad.
Investors already note that international markets trade at valuations that look far more “reasonable” by historical standards.
This gap matters. If U.S. multiples can’t hold, capital could flow abroad.
Investors already note that international markets trade at valuations that look far more “reasonable” by historical standards.
But here’s the twist: is book value even relevant today?
Book equity ignores intangibles like R&D, patents, software, data, and brands, the backbone of modern tech companies.
So when you divide price by book, today’s firms look more expensive than they may truly be.
Book equity ignores intangibles like R&D, patents, software, data, and brands, the backbone of modern tech companies.
So when you divide price by book, today’s firms look more expensive than they may truly be.
Bulls vs. Bears:
• Bulls say AI is transformational, boosting productivity and profits enough to justify today’s multiples.
• Bears say this is classic bubble logic, lofty expectations concentrated in a few names.
If AI delivers, P/B might hold. If not, mean reversion could be brutal.
• Bulls say AI is transformational, boosting productivity and profits enough to justify today’s multiples.
• Bears say this is classic bubble logic, lofty expectations concentrated in a few names.
If AI delivers, P/B might hold. If not, mean reversion could be brutal.
Example: a chipmaker spends billions on research, but that vanishes from book value.
Buybacks shrink equity, which mathematically pushes P/B higher.
So while today’s 5.3× number looks outrageous, it partly reflects how accounting lags behind intangible-heavy business models.
Buybacks shrink equity, which mathematically pushes P/B higher.
So while today’s 5.3× number looks outrageous, it partly reflects how accounting lags behind intangible-heavy business models.
Still, high valuations have never been friendly to long-term returns.
Bank of America says P/B and similar metrics predict 10-year returns far better than short-term moves.
And State Street reminds us: when sentiment cracked in 2000 and 2007, drawdowns were over 40%.
Bank of America says P/B and similar metrics predict 10-year returns far better than short-term moves.
And State Street reminds us: when sentiment cracked in 2000 and 2007, drawdowns were over 40%.
Bulls vs. Bears:
• Bulls say AI is transformational, boosting productivity and profits enough to justify today’s multiples.
• Bears say this is classic bubble logic, lofty expectations concentrated in a few names.
If AI delivers, P/B might hold. If not, mean reversion could be brutal.
• Bulls say AI is transformational, boosting productivity and profits enough to justify today’s multiples.
• Bears say this is classic bubble logic, lofty expectations concentrated in a few names.
If AI delivers, P/B might hold. If not, mean reversion could be brutal.
Meanwhile, macro headwinds loom
• Rates are 4.25 to 4-50 % (vs near zero in the 2010s).
• Inflation is still 2.7%
• U.S. deficits remain huge, keeping yields high
Normally, these factors compress valuations. Yet passive flows keep piling money into the largest tech names, inflating them further
• Rates are 4.25 to 4-50 % (vs near zero in the 2010s).
• Inflation is still 2.7%
• U.S. deficits remain huge, keeping yields high
Normally, these factors compress valuations. Yet passive flows keep piling money into the largest tech names, inflating them further
Remember: ~60% of the U.S. market is now owned by passive index funds.
Every dollar that flows into ETFs gets funneled disproportionately into the biggest stocks Nvidia, Microsoft, Apple.
It’s a self-reinforcing cycle: the big get bigger until momentum breaks.
Every dollar that flows into ETFs gets funneled disproportionately into the biggest stocks Nvidia, Microsoft, Apple.
It’s a self-reinforcing cycle: the big get bigger until momentum breaks.
Strategists are waving caution flags.
Many suggest trimming U.S. exposure, rotating into cheaper international markets, and diversifying with value stocks, dividends, bonds, or gold.
Not an all-out exit, but a prudent rebalancing to protect against extremes.
Many suggest trimming U.S. exposure, rotating into cheaper international markets, and diversifying with value stocks, dividends, bonds, or gold.
Not an all-out exit, but a prudent rebalancing to protect against extremes.
Remember: ~60% of the U.S. market is now owned by passive index funds.
Every dollar that flows into ETFs gets funneled disproportionately into the biggest stocks Nvidia, Microsoft, Apple.
It’s a self-reinforcing cycle: the big get bigger until momentum breaks.
Every dollar that flows into ETFs gets funneled disproportionately into the biggest stocks Nvidia, Microsoft, Apple.
It’s a self-reinforcing cycle: the big get bigger until momentum breaks.
The billion-dollar question: bubble or new normal?
• Bulls argue AI will fundamentally change the economy.
• Skeptics argue “this time it’s different” is the most dangerous phrase in investing.
Oaktree warns: the top 7 U.S. stocks now = 33% of the index, vs 22% during dot-com.
• Bulls argue AI will fundamentally change the economy.
• Skeptics argue “this time it’s different” is the most dangerous phrase in investing.
Oaktree warns: the top 7 U.S. stocks now = 33% of the index, vs 22% during dot-com.
Bottom line: At 5.3× P/B, U.S. stocks have never been this expensive.
Yes, intangibles matter but history shows extreme valuations rarely end quietly.
Either AI rewrites the rules or investors face a painful reminder that valuation gravity always returns.
Yes, intangibles matter but history shows extreme valuations rarely end quietly.
Either AI rewrites the rules or investors face a painful reminder that valuation gravity always returns.
So the question is simple but profound: Would you bet that this time really is different or that history, once again, rhymes?
If you found these insights valuable: Sign up for my FREE newsletter! thestockmarket.news
If you found these insights valuable: Sign up for my FREE newsletter! thestockmarket.news
Strategists are waving caution flags.
Many suggest trimming U.S. exposure, rotating into cheaper international markets, and diversifying with value stocks, dividends, bonds, or gold.
Not an all-out exit, but a prudent rebalancing to protect against extremes.
Many suggest trimming U.S. exposure, rotating into cheaper international markets, and diversifying with value stocks, dividends, bonds, or gold.
Not an all-out exit, but a prudent rebalancing to protect against extremes.
The billion-dollar question: bubble or new normal?
• Bulls argue AI will fundamentally change the economy.
• Skeptics argue “this time it’s different” is the most dangerous phrase in investing.
Oaktree warns: the top 7 U.S. stocks now = 33% of the index, vs 22% during dot-com.
• Bulls argue AI will fundamentally change the economy.
• Skeptics argue “this time it’s different” is the most dangerous phrase in investing.
Oaktree warns: the top 7 U.S. stocks now = 33% of the index, vs 22% during dot-com.
Bottom line: At 5.3× P/B, U.S. stocks have never been this expensive.
Yes, intangibles matter but history shows extreme valuations rarely end quietly.
Either AI rewrites the rules or investors face a painful reminder that valuation gravity always returns.
Yes, intangibles matter but history shows extreme valuations rarely end quietly.
Either AI rewrites the rules or investors face a painful reminder that valuation gravity always returns.
So the question is simple but profound: Would you bet that this time really is different or that history, once again, rhymes?
If you found these insights valuable: Sign up for my FREE newsletter! thestockmarket.news
If you found these insights valuable: Sign up for my FREE newsletter! thestockmarket.news
I hope you've found this thread helpful.
Follow me @_Investinq for more.
Like/Repost the quote below if you can:
Follow me @_Investinq for more.
Like/Repost the quote below if you can:
https://x.com/_investinq/status/1957448802647830919?s=46
• • •
Missing some Tweet in this thread? You can try to
force a refresh