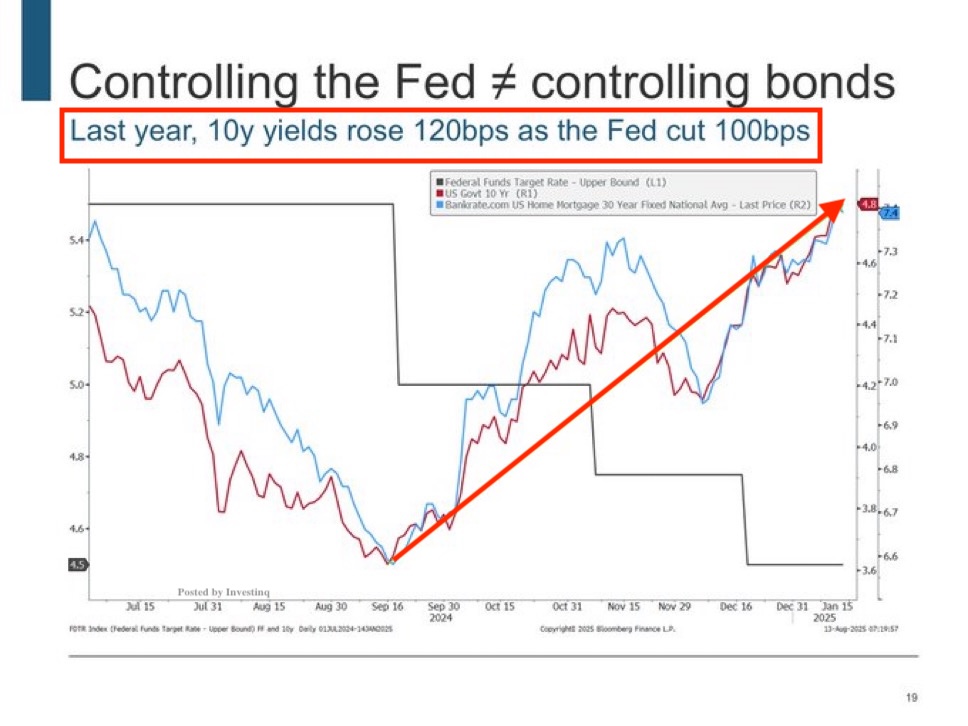
Central banks are cutting rates but borrowing costs are surging.
After a 100 bps Fed cut last year, the 10yr Treasury rose almost the same.
And UK 30yr gilts just hit their highest since 1998 after easing.
( a thread)
After a 100 bps Fed cut last year, the 10yr Treasury rose almost the same.
And UK 30yr gilts just hit their highest since 1998 after easing.
( a thread)
Let’s start simple. The Fed (US) and BoE (UK) set the policy rate, the overnight interest rate.
That’s the cost of borrowing money for one day.
But mortgages and 30yr bonds don’t care about one day, they care about the next 10–30 years.
That’s the cost of borrowing money for one day.
But mortgages and 30yr bonds don’t care about one day, they care about the next 10–30 years.
That’s why long-term bonds matter. The 10yr Treasury (US) and the 30yr gilt (UK) are like benchmarks for borrowing costs. They’re priced by what investors expect for the future:
– growth
– inflation
– government debt
Not just today’s policy.
– growth
– inflation
– government debt
Not just today’s policy.
The gap between short-term and long-term rates is shown in the yield curve.
It’s just a line connecting interest rates across different maturities (1yr, 2yr, 10yr, 30yr).
When short-term rates fall but long-term rates rise, the curve steepens. That’s what we’ve seen since late 2024.
It’s just a line connecting interest rates across different maturities (1yr, 2yr, 10yr, 30yr).
When short-term rates fall but long-term rates rise, the curve steepens. That’s what we’ve seen since late 2024.
So why would rate cuts make long yields rise? Because cuts send a signal. If investors think cuts mean:
– inflation might rise,
– governments will borrow more, or
– central banks acted too late…
They demand higher yields to lend long-term.
– inflation might rise,
– governments will borrow more, or
– central banks acted too late…
They demand higher yields to lend long-term.
This is called the term premium
.
Think of it as a “bonus yield” for tying up your money for 10–30 years.
In calm times, it’s tiny but with sticky inflation, big deficits, and record debt sales, the term premium has surged.
.
Think of it as a “bonus yield” for tying up your money for 10–30 years.
In calm times, it’s tiny but with sticky inflation, big deficits, and record debt sales, the term premium has surged.
Here’s an analogy: Would you lend money for 30 years at 3%, if inflation could run hot, governments keep borrowing, and politics are messy?
Probably not.
You’d want 4–5% instead. That extra yield = the term premium.
Probably not.
You’d want 4–5% instead. That extra yield = the term premium.
Supply also matters.
Governments fund themselves by selling bonds. More supply = lower bond prices = higher yields.
It’s just supply and demand.
Governments fund themselves by selling bonds. More supply = lower bond prices = higher yields.
It’s just supply and demand.
In the US, this shows up in Treasury auctions. When demand is weak, two things happen:
– low bid-to-cover ratios (few bids per bond)
– large tails (yields clear higher than expected)
That’s investors saying: “Pay us more.”
– low bid-to-cover ratios (few bids per bond)
– large tails (yields clear higher than expected)
That’s investors saying: “Pay us more.”
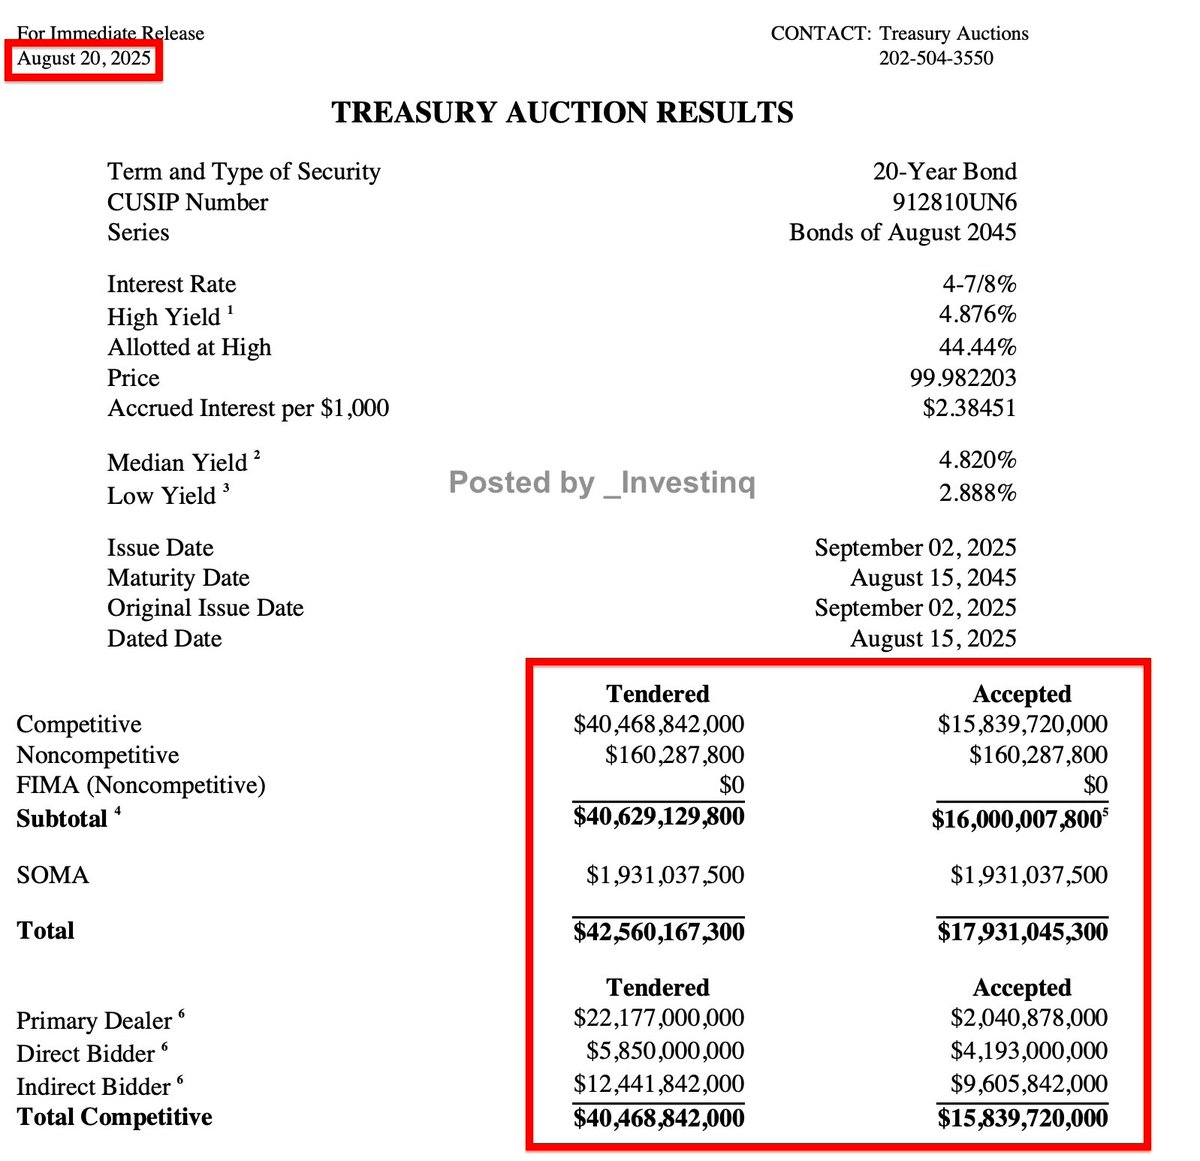
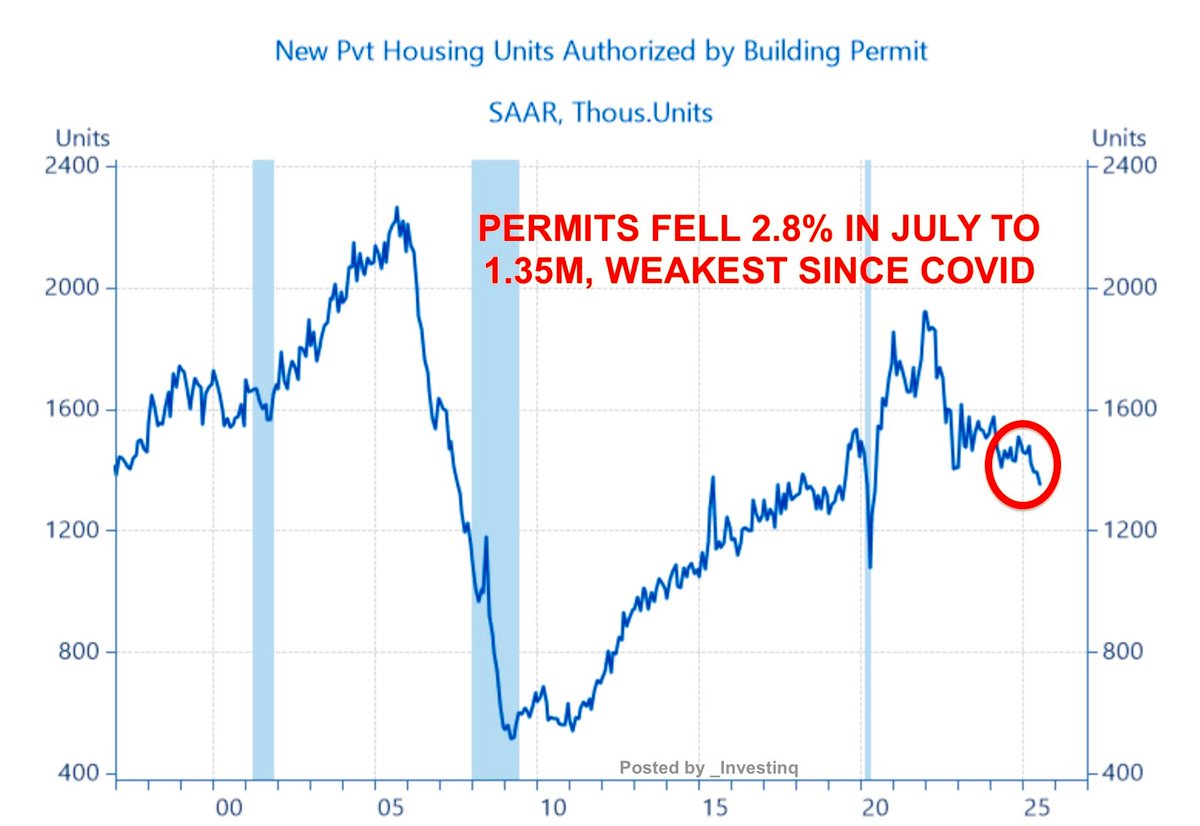
Example: May 2025. The US sold $16bn of 20yr Treasuries. Demand was soft.
The auction cleared at ~5.05%, higher than markets expected.
The next day, yields across the curve rose including the 10yr and mortgage rates rose too.
The auction cleared at ~5.05%, higher than markets expected.
The next day, yields across the curve rose including the 10yr and mortgage rates rose too.
The UK faces the same problem.
In 2025, the UK’s Debt Management Office announced £299bn of gilt issuance.
That flood of supply pushed 30yr gilt yields to their highest since 1998. Even worse, demand for long gilts has dried up so the gov’t shifted to shorter bonds.
In 2025, the UK’s Debt Management Office announced £299bn of gilt issuance.
That flood of supply pushed 30yr gilt yields to their highest since 1998. Even worse, demand for long gilts has dried up so the gov’t shifted to shorter bonds.
And demand is shrinking everywhere.
Foreign central banks, pensions, and insurers big buyers in the past are scaling back.
Some let their bonds mature without reinvesting.
That leaves fewer “natural” buyers. To attract new ones, yields have to rise.
Foreign central banks, pensions, and insurers big buyers in the past are scaling back.
Some let their bonds mature without reinvesting.
That leaves fewer “natural” buyers. To attract new ones, yields have to rise.
Inflation fears make things worse.
If central banks cut rates while inflation is still above target, investors get nervous. Add tariffs, fiscal stimulus, or tax cuts → and worries about higher prices grow.
So investors demand extra yield as insurance.
If central banks cut rates while inflation is still above target, investors get nervous. Add tariffs, fiscal stimulus, or tax cuts → and worries about higher prices grow.
So investors demand extra yield as insurance.
But here’s a key detail: Most of the 2024 rise wasn’t from inflation expectations.
It came from real yields, the inflation-adjusted return.
Meaning: investors don’t expect crazy inflation. They just want more compensation for uncertainty.
It came from real yields, the inflation-adjusted return.
Meaning: investors don’t expect crazy inflation. They just want more compensation for uncertainty.
Quick definitions:
– Nominal yield = the bond’s headline interest rate.
– Breakeven inflation = what markets expect inflation to be.
– Real yield = nominal yield – breakeven.
If a 10yr yields 4.6% and inflation is 2.2%, real yield = 2.4%. That’s very high.
– Nominal yield = the bond’s headline interest rate.
– Breakeven inflation = what markets expect inflation to be.
– Real yield = nominal yield – breakeven.
If a 10yr yields 4.6% and inflation is 2.2%, real yield = 2.4%. That’s very high.
Fiscal fears pile on.
When real interest rates (r) > real growth (g), debt becomes harder to manage.
The US deficit is ~6–7% of GDP. UK debt is near 97% of GDP.
Investors demand a fiscal risk premium, higher yields to cover debt worries.
When real interest rates (r) > real growth (g), debt becomes harder to manage.
The US deficit is ~6–7% of GDP. UK debt is near 97% of GDP.
Investors demand a fiscal risk premium, higher yields to cover debt worries.
This is the return of the bond vigilantes. Not an actual group, just a phrase for markets punishing governments.
When deficits rise, they sell long bonds.Yields climb.
It’s discipline imposed by markets.
When deficits rise, they sell long bonds.Yields climb.
It’s discipline imposed by markets.
In the UK, this is politically sensitive. In 2022, Liz Truss’s mini-budget caused gilt yields to explode.
Now in 2025, Rachel Reeves faces rising yields again, this time gradually, but to the same 1998 levels.
Either way, higher borrowing costs squeeze governments.
Now in 2025, Rachel Reeves faces rising yields again, this time gradually, but to the same 1998 levels.
Either way, higher borrowing costs squeeze governments.
And here’s where it hits households: Mortgage rates follow the 10yr Treasury, not the Fed’s overnight rate.
That’s why after the Fed’s Sept ’24 cut, mortgage rates didn’t drop.
They actually rose, from ~6.1% to ~6.8%.
That’s why after the Fed’s Sept ’24 cut, mortgage rates didn’t drop.
They actually rose, from ~6.1% to ~6.8%.
It’s repeating now. Mortgage rates just hit 6.58%, their lowest since Oct ’24.
But they may not fall much after the next Fed cut because markets already expect that cut.
It’s already priced in.
But they may not fall much after the next Fed cut because markets already expect that cut.
It’s already priced in.
What does “priced in” mean? It means investors move ahead of time.
If everyone expects the Fed to cut, bond yields already adjust.
By the time the cut happens, there’s no surprise left.
If everyone expects the Fed to cut, bond yields already adjust.
By the time the cut happens, there’s no surprise left.
That’s why mortgage pros hear this all the time:
Clients: “I’ll wait for the Fed cut before buying.” Loan officers: “Too late, it’s already priced in.”
Markets move on expectations, not announcements.
Clients: “I’ll wait for the Fed cut before buying.” Loan officers: “Too late, it’s already priced in.”
Markets move on expectations, not announcements.
So what actually moves mortgage rates? Surprises.
Jobs data, inflation reports, bond auctions.
If data comes in stronger or weaker than expected, yields swing and mortgage rates swing with them.
Jobs data, inflation reports, bond auctions.
If data comes in stronger or weaker than expected, yields swing and mortgage rates swing with them.
Lesson: Mortgage rates are market-driven.
They follow the 10yr Treasury.
They’re influenced by bond demand, inflation, and risk in mortgage-backed securities. The Fed matters but indirectly.
They follow the 10yr Treasury.
They’re influenced by bond demand, inflation, and risk in mortgage-backed securities. The Fed matters but indirectly.
And the UK housing market faces the same problem.
Even as the BoE cuts, gilt yields keep mortgage costs high.
Borrowers waiting for cheap loans find: it’s not policy that sets affordability, it’s the bond market.
Even as the BoE cuts, gilt yields keep mortgage costs high.
Borrowers waiting for cheap loans find: it’s not policy that sets affordability, it’s the bond market.
The ripple effects go beyond housing.
Higher long yields → higher discount rates → stocks look less attractive. Corporate borrowing costs rise.
Emerging markets get squeezed as US yields push their dollar debt higher.
Higher long yields → higher discount rates → stocks look less attractive. Corporate borrowing costs rise.
Emerging markets get squeezed as US yields push their dollar debt higher.
That’s why many analysts say the era of ultra-low yields is over.
In the 2010s, QE, low inflation, and fiscal restraint kept yields near zero. Now those anchors are gone.
Long-term borrowing costs are structurally higher.
In the 2010s, QE, low inflation, and fiscal restraint kept yields near zero. Now those anchors are gone.
Long-term borrowing costs are structurally higher.
Could yields fall again? Yes.
If inflation cools, growth slows, and demand for bonds improves, yields can drift down.
But with big deficits and huge bond supply, the floor for yields is higher now.
If inflation cools, growth slows, and demand for bonds improves, yields can drift down.
But with big deficits and huge bond supply, the floor for yields is higher now.
So what should you watch?
– Treasury & gilt auctions (demand)
– Inflation data (CPI, PPI)
– Jobs & growth data (GDP, payrolls)
– Fiscal headlines (spending, deficits)
These move long yields and mortgage rates faster than Fed cuts.
– Treasury & gilt auctions (demand)
– Inflation data (CPI, PPI)
– Jobs & growth data (GDP, payrolls)
– Fiscal headlines (spending, deficits)
These move long yields and mortgage rates faster than Fed cuts.
And credibility matters.
If investors think central banks will cave to politics or cut too soon, confidence erodes.
That loss of trust pushes yields higher. Markets demand protection.
If investors think central banks will cave to politics or cut too soon, confidence erodes.
That loss of trust pushes yields higher. Markets demand protection.
History shows this pattern.
1994: surprise Fed hikes → global bond selloff.
2013: Bernanke’s taper tantrum → yields soared.
2024–25 looks similar: markets flexing against central banks.
1994: surprise Fed hikes → global bond selloff.
2013: Bernanke’s taper tantrum → yields soared.
2024–25 looks similar: markets flexing against central banks.
So the paradox isn’t really a paradox.
– Short-term rates follow the Fed.
– Long-term rates follow inflation, debt, and demand.
– Mortgages follow long-term rates.
That’s why cuts don’t equal cheaper home loans.
– Short-term rates follow the Fed.
– Long-term rates follow inflation, debt, and demand.
– Mortgages follow long-term rates.
That’s why cuts don’t equal cheaper home loans.
Final takeaway: The Fed and BoE can cut the short end but the market sets the long end.
Until deficits shrink, inflation cools, and bond demand strengthens…
Borrowing costs won’t fall the way most people expect.
Until deficits shrink, inflation cools, and bond demand strengthens…
Borrowing costs won’t fall the way most people expect.
If you found these insights valuable: Sign up for my FREE newsletter! thestockmarket.news
I hope you've found this thread helpful.
Follow me @_Investinq for more.
Like/Repost the quote below if you can:
Follow me @_Investinq for more.
Like/Repost the quote below if you can:
https://x.com/_investinq/status/1957520846894805225?s=46
• • •
Missing some Tweet in this thread? You can try to
force a refresh