Office vacancies just hit 20.7%, a new U.S. record.
Landlords are walking. Cities are losing tax revenue.
And yet, Wall Street shrugs like nothing’s wrong.
( a thread)
Landlords are walking. Cities are losing tax revenue.
And yet, Wall Street shrugs like nothing’s wrong.
( a thread)
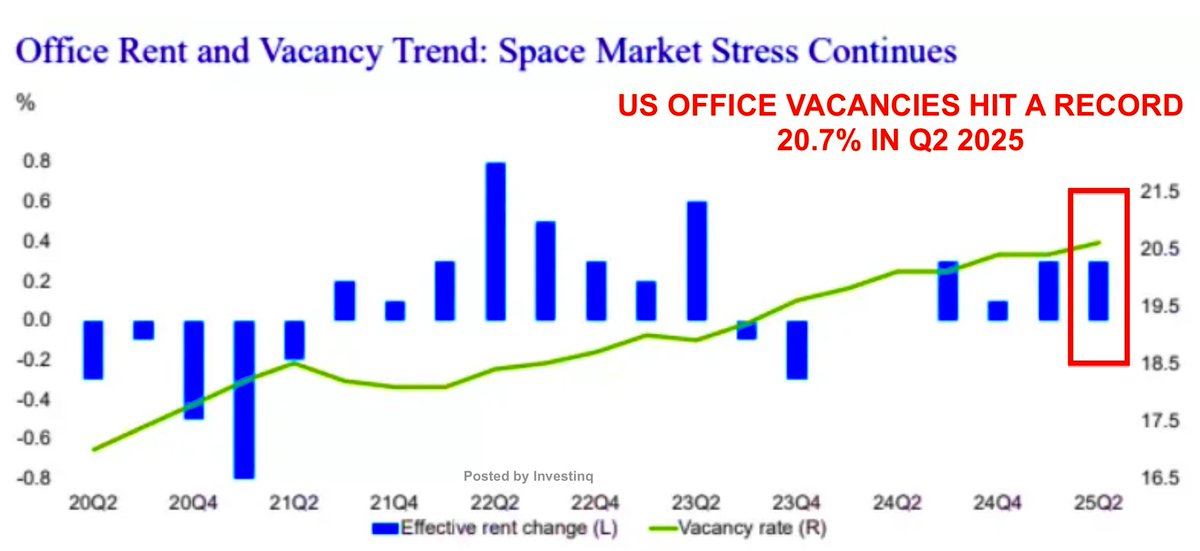
Office vacancy rates in the U.S. are now at record highs, crossing 20.7% in Q2 2025. That means 1 in 5 offices is sitting empty.
This isn’t just a big city problem, it’s happening across the board.
But office is only one piece of the puzzle.
This isn’t just a big city problem, it’s happening across the board.
But office is only one piece of the puzzle.
CRE = commercial real estate. That includes offices, retail stores, warehouses, hotels, and apartment buildings.
Right now, every major CRE sector is under stress.
Some from remote work. Others from rate hikes but the pain is spreading fast.
Right now, every major CRE sector is under stress.
Some from remote work. Others from rate hikes but the pain is spreading fast.
Over $2 trillion in CRE debt is coming due between now and 2027. That’s the “debt wall.”
Most of it was issued when rates were 2–3%.
Now? Many borrowers will have to refinance at 6–9%, if they even can and that’s where the defaults begin.
Most of it was issued when rates were 2–3%.
Now? Many borrowers will have to refinance at 6–9%, if they even can and that’s where the defaults begin.
Delinquencies on office loans in CMBS commercial mortgage-backed securities are soaring.
Think of CMBS like mortgage bonds for buildings.
They’re defaulting because rent cash flows have dried up and many buildings are now worth far less than the loan itself.
Think of CMBS like mortgage bonds for buildings.
They’re defaulting because rent cash flows have dried up and many buildings are now worth far less than the loan itself.
It’s not just offices. CMBS delinquency rates by property type:
• Office: 14.3%
• Retail (malls, stores): 8.1%
• Hotels: 6.8%
• Apartments: 5.9%
This is a cross-sector contagion now.
• Office: 14.3%
• Retail (malls, stores): 8.1%
• Hotels: 6.8%
• Apartments: 5.9%
This is a cross-sector contagion now.
Some say: “Just turn offices into apartments.” but most buildings weren’t built for people to live in.
Reconfiguring plumbing, lighting, and zoning is so expensive that only ~10% of properties are even eligible for conversion..
Reconfiguring plumbing, lighting, and zoning is so expensive that only ~10% of properties are even eligible for conversion..
Cities are now facing their own crisis. Property taxes from commercial buildings are a core part of their revenue.
If values crash, so do city budgets.
Boston may lose $1.7B. San Francisco? $1B shortfall by 2028. NYC, Chicago, DC, similar stories.
If values crash, so do city budgets.
Boston may lose $1.7B. San Francisco? $1B shortfall by 2028. NYC, Chicago, DC, similar stories.
Many major metros rely on property taxes from commercial buildings to fund schools, transit, and safety.
If CRE valuations fall, so does city revenue that means budget shortfalls, layoffs, or higher taxes.
If CRE valuations fall, so does city revenue that means budget shortfalls, layoffs, or higher taxes.
And here’s where things get systemic: Banks especially smaller ones own most CRE debt.
Over 70% of CRE loans are held by regional banks.
If defaults pile up, their capital buffers erode fast. Remember SVB? This could be bigger.
Over 70% of CRE loans are held by regional banks.
If defaults pile up, their capital buffers erode fast. Remember SVB? This could be bigger.
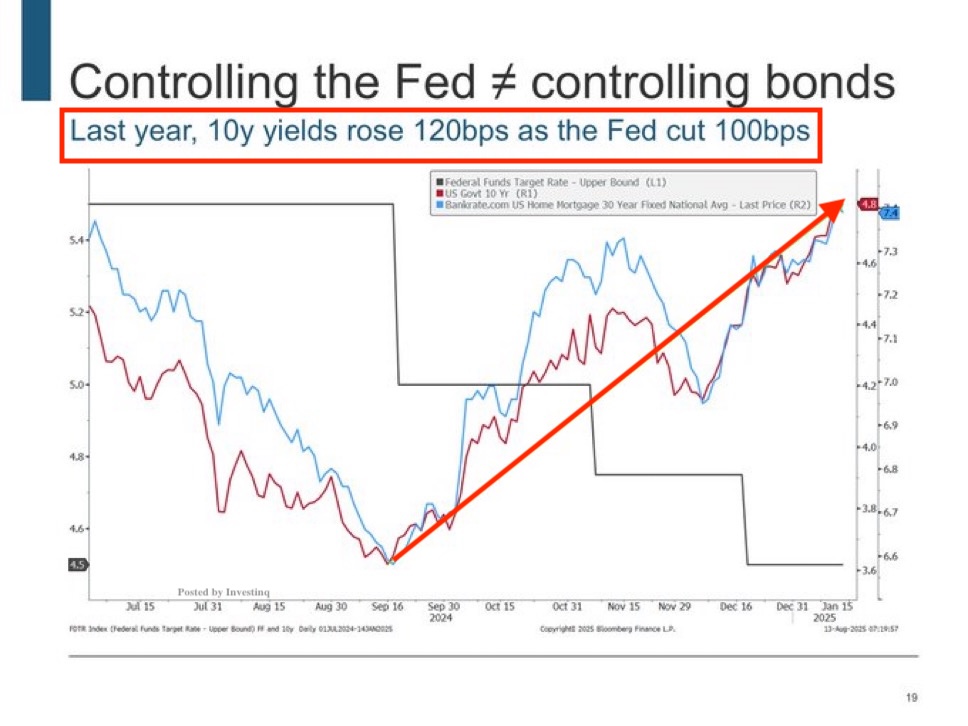
But the Fed can’t cut rates quickly. Inflation is still sticky.
And lowering rates too soon risks reigniting inflation.
So CRE borrowers are stuck: rising costs, falling income, no relief in sight.
And lowering rates too soon risks reigniting inflation.
So CRE borrowers are stuck: rising costs, falling income, no relief in sight.
The reason many corporations are pushing for return-to-office policies isn’t just culture. It’s financial.
Landlords need tenants. Lenders need payments.
And keeping offices filled even artificially buys them time.
Landlords need tenants. Lenders need payments.
And keeping offices filled even artificially buys them time.
We’ve now reached a point where investors, city governments, and banks are all exposed to the same risk:
Commercial real estate losing value, delinquency rising, and refinancing failing.
That’s a contagion, not just a downturn.
Commercial real estate losing value, delinquency rising, and refinancing failing.
That’s a contagion, not just a downturn.
What does this all mean? The collapse is already underway, just not in a dramatic 2008-style flash.
It’s slow, uneven, but structural.
And unless rates drop fast or values rise miraculously, this grinds on through 2026–2027.
It’s slow, uneven, but structural.
And unless rates drop fast or values rise miraculously, this grinds on through 2026–2027.
The stock market doesn’t seem to care for now.
But if the CRE pain spills into banks or municipal budgets, the contagion could widen.
This isn’t a niche problem. This is a national one.
But if the CRE pain spills into banks or municipal budgets, the contagion could widen.
This isn’t a niche problem. This is a national one.
If you found these insights valuable: Sign up for my FREE newsletter! thestockmarket.news
• • •
Missing some Tweet in this thread? You can try to
force a refresh