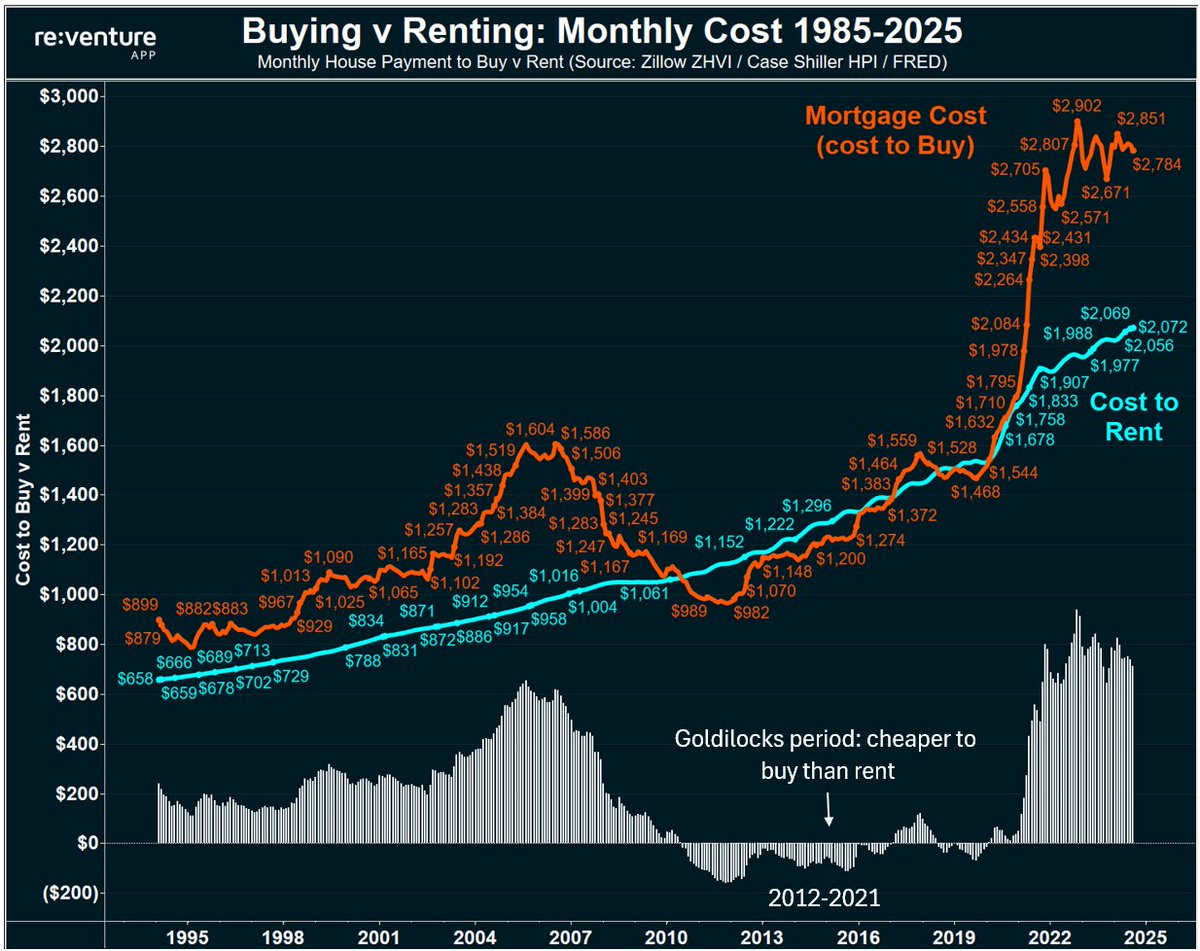
Historical cost of Buying v Renting.
This explains everything about the current housing market.
This explains everything about the current housing market.

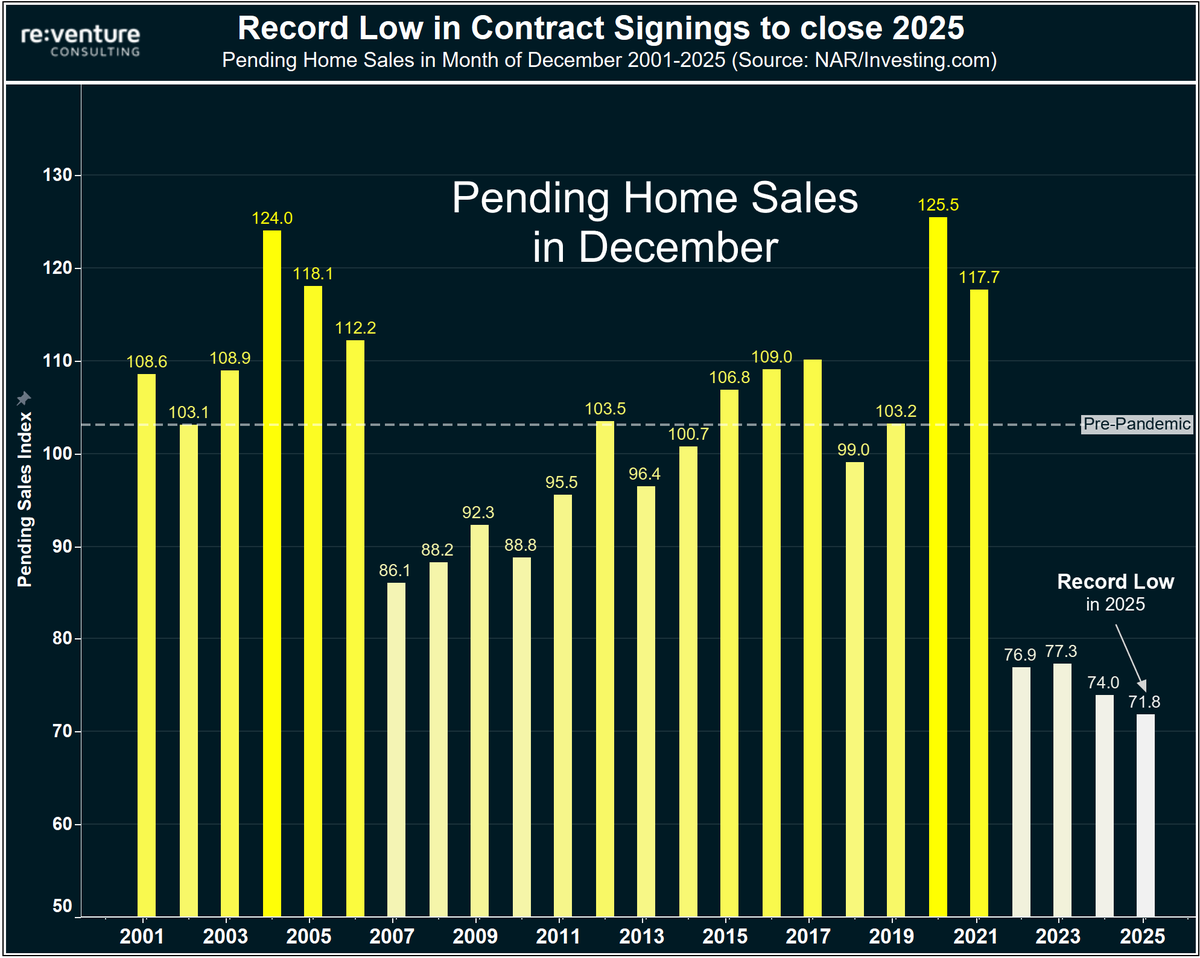
1) Today's premium to buy of $713/month is one of the highest on record, and a key reason why homebuyer demand is near record lows.
First-time buyers are doing the simple math, and deciding to stay renting, since it saves them money in the short-term.
First-time buyers are doing the simple math, and deciding to stay renting, since it saves them money in the short-term.
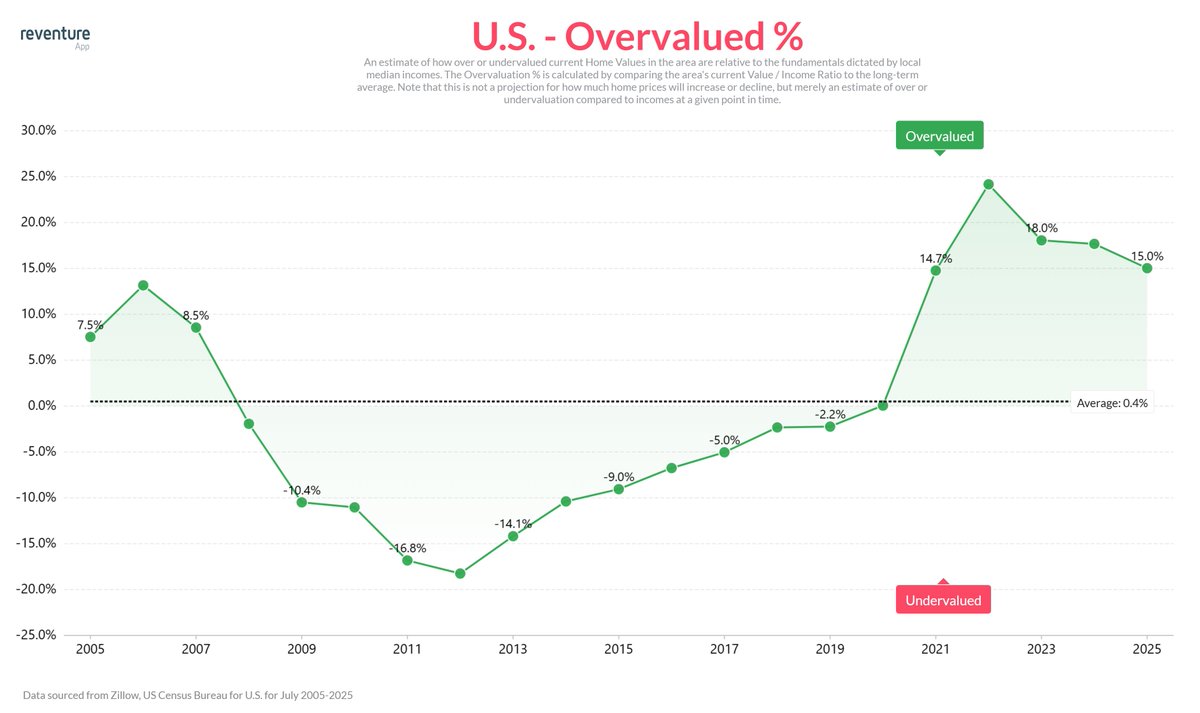
2) Especially when you consider how overvalued home prices are today.
Not only is it more expensive to own on a per month basis - it looks like a bad long-term investment given how expensive the prices have become.
Not only is it more expensive to own on a per month basis - it looks like a bad long-term investment given how expensive the prices have become.
3) Home values in the U.S. are 15% overvalued today compared to their historical norms relative to income.
So why would I buy when prices are overvalued?
This is the question almost every first-time homebuyer is asking themselves.
So why would I buy when prices are overvalued?
This is the question almost every first-time homebuyer is asking themselves.
4) Rate cuts and lower mortgage rates could help bridge the gap and bring more buyers back into the market by making the monthly payment lower.
However - it would likely require big mortgage rate reductions to make a noticeable dent in the monthly payment.
However - it would likely require big mortgage rate reductions to make a noticeable dent in the monthly payment.
5) For instance, Mortgage Rates dropping from 6.6% to 5.6% would only lower the monthly payment to buy down to around $2,550/month.
Meaning there would still be a roughly $500/month premium to buy v rent.
Meaning there would still be a roughly $500/month premium to buy v rent.
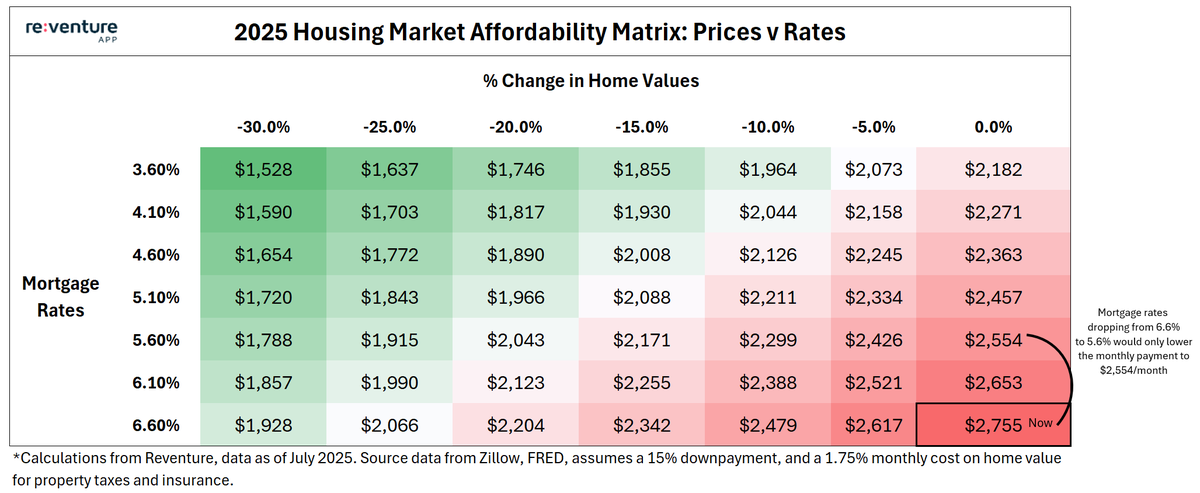
6) If Mortgage rates dropped to 4.6%, then the monthly payment would go down to $2,363/month.
Which would still be roughly $300/month more than the cost to rent.
It's evident that rate cuts alone aren't going to be enough to stimulate the housing market.
Which would still be roughly $300/month more than the cost to rent.
It's evident that rate cuts alone aren't going to be enough to stimulate the housing market.
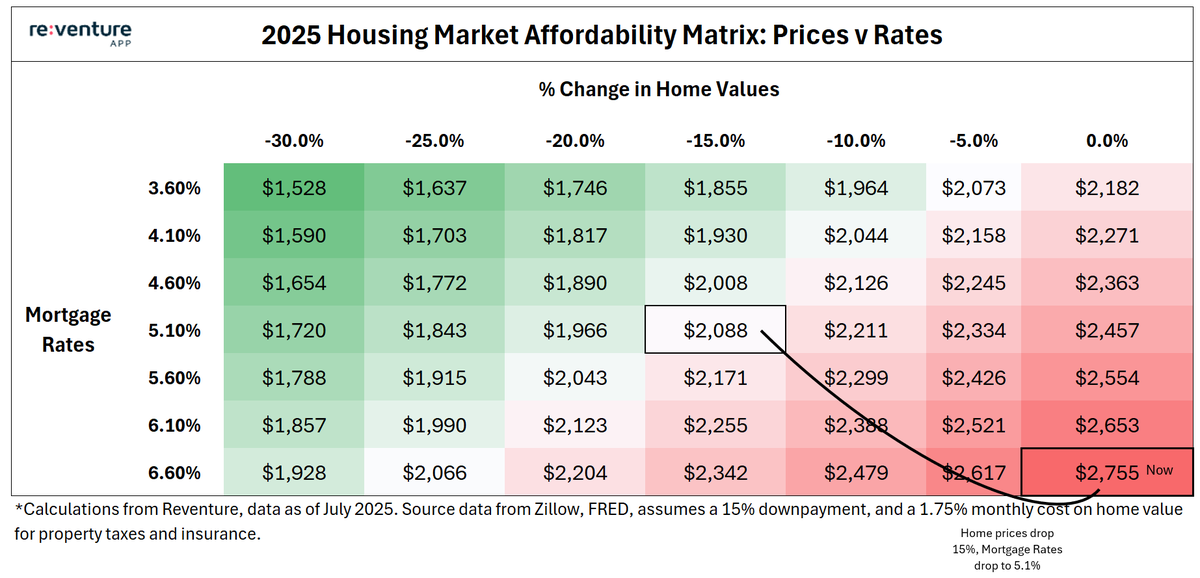
7) Now here's what would get buyers back.
Mortgage Rates drop to 5.1%.
Home prices drop 15%.
All of a sudden - cost to buy and rent is now the same.
Mortgage Rates drop to 5.1%.
Home prices drop 15%.
All of a sudden - cost to buy and rent is now the same.
8) One thing I need to address is how many people who are "bullish" on the housing market grew up in real estate during a period where the cost to buy was cheaper than the cost to rent.
From 2012-21, it was cheaper to buy than rent on the U.S. Housing Market.
This is ultimately what caused strong buyer demand and price growth for the decades of the 2010s and into COVID.
From 2012-21, it was cheaper to buy than rent on the U.S. Housing Market.
This is ultimately what caused strong buyer demand and price growth for the decades of the 2010s and into COVID.
9) I can't overstate how rare this period was, and how much this positively impacted home price appreciation during this period.
The financial incentives were squarely in favor of buying, as housholds could actually save money on their monthly payment by doing so.
That period from 2012-21 is likely never coming back, and was a unique result of cheap home prices after the last crash combined with Fed interest rate suppression.
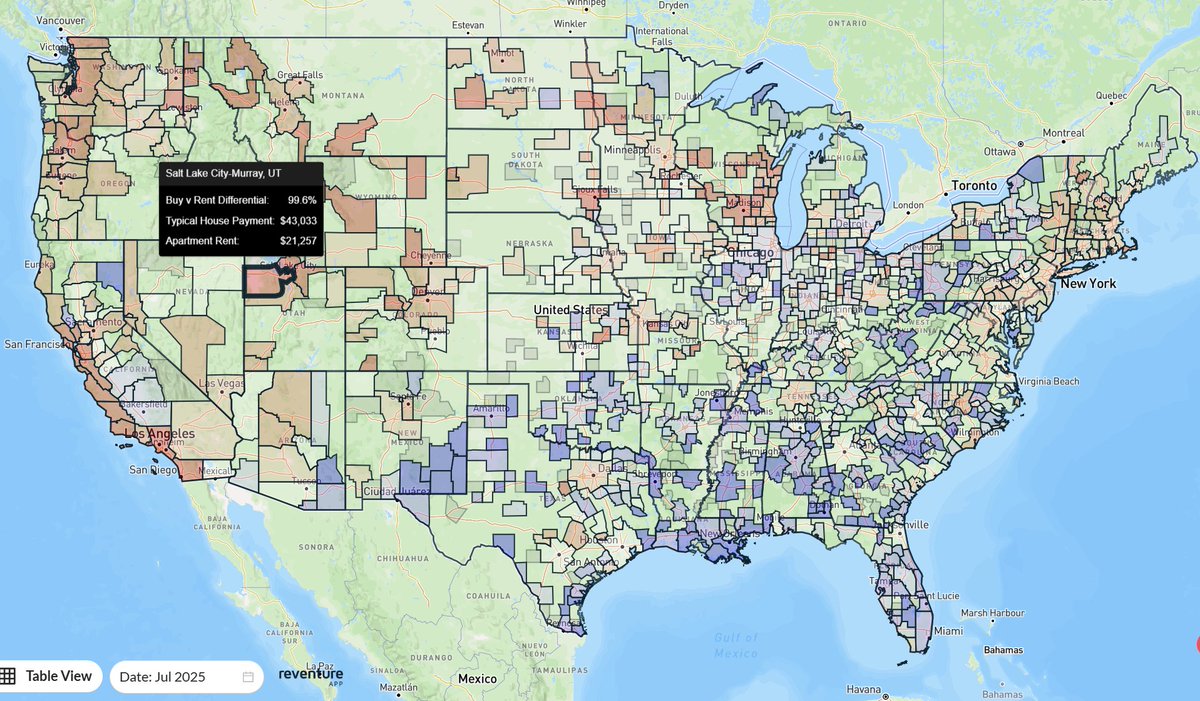
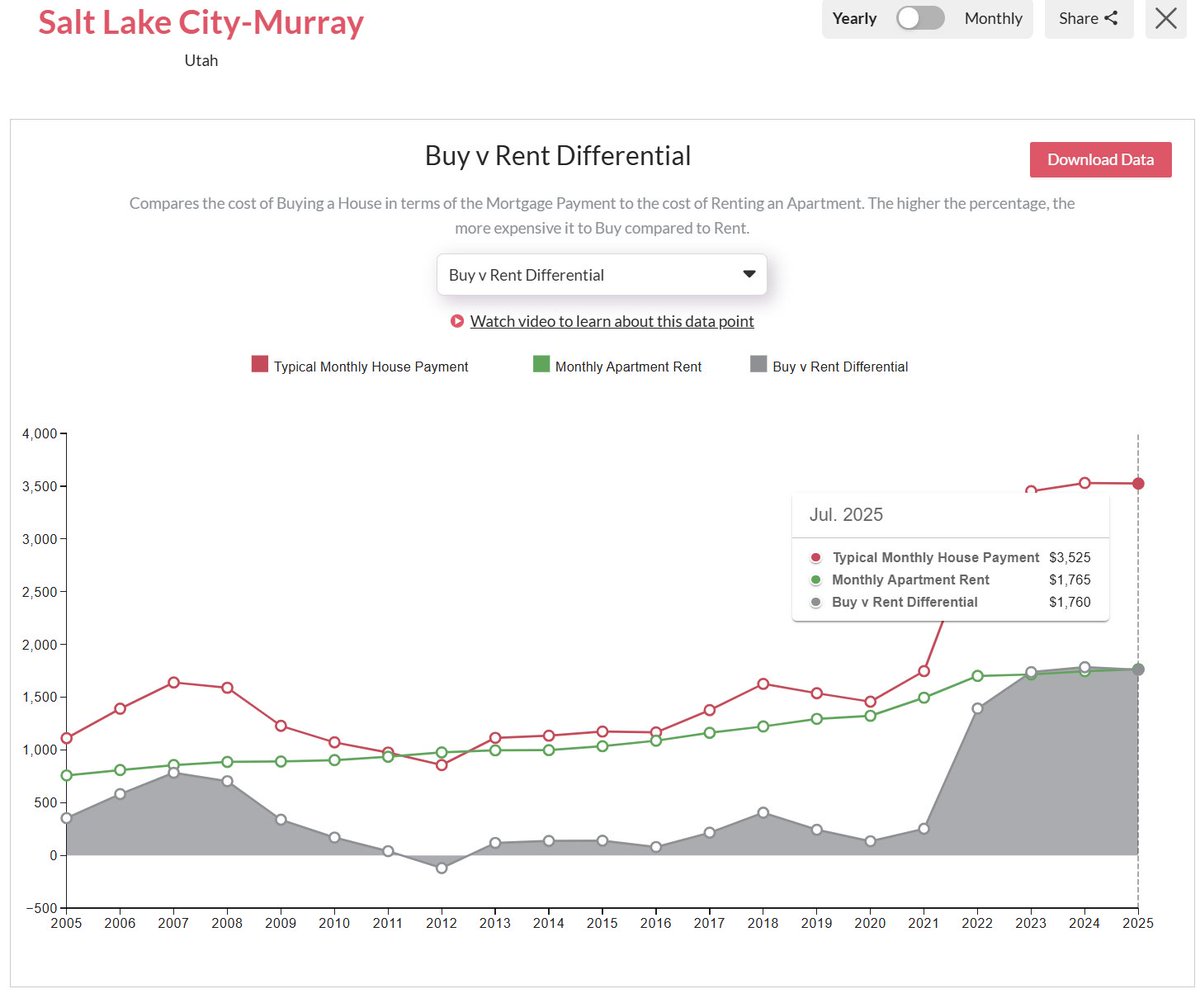
10) But of course there's big variation by market.
On Reventure App, we have Buy v Rent differential data broken out by metros, counties, and ZIP codes.
You can see it's the Western Half of the U.S. which is really driving the buy v rent premium up.
(Salt Lake City is 99% more expensive to buy!)
On Reventure App, we have Buy v Rent differential data broken out by metros, counties, and ZIP codes.
You can see it's the Western Half of the U.S. which is really driving the buy v rent premium up.
(Salt Lake City is 99% more expensive to buy!)
11) You can see this data across time as well.
In a market like Salt Lake, the cost to buy v rent was almost identical from 2012-2021.
Now it's $1,700/month more expensive to buy.
In a market like Salt Lake, the cost to buy v rent was almost identical from 2012-2021.
Now it's $1,700/month more expensive to buy.
12) Access the Buy v Rent differntial data for your market on Reventure App Premium.
This data will help you as a buyer or investor understand if it make sense to buy in today's market, and how the current data compares to long-term trends.
We just had a user in Orange County, CA actually decide to go ahead and buy a house because they realized it's always more expensive to buy than rent there.
So it can be used both to facilitate transactions, or to exercise discretion and wait/look for more affordable areas.
Sign up for a premium plan at $49/month to harness the power of high-end real estate data in your decision-making.
reventure.app
• • •
Missing some Tweet in this thread? You can try to
force a refresh