This article was published recently that reports the aerostability of SARS-CoV-2. I’ve been asked for my thoughts, and given that this is in my wheelhouse, I have a few.
https://x.com/danwalker9999/status/1957605147040739544
In the study, the authors aimed to explore how long SC2 remained viable in the air, on a surface and the combination the 2. To measure this, they built an aerosolization chamber. Chambers like this have been used for decades, and extensively to study SC2
pmc.ncbi.nlm.nih.gov/articles/PMC90…
pmc.ncbi.nlm.nih.gov/articles/PMC90…
In looking at their setup, there doesn’t appear to be anything extremely novel or unique to this system. Over the years, I’ve seen numerous systems designed to explore airborne viral decay in a similar manor.
Context: Studying aerosolized microbes is extremely difficult, with many factors at play. It is very easy to misinterpret artifacts of the technique itself as something happening within the experiment. The first video on my YouTube channel dives into this:
Context (1): This is why it is so important to benchmark your system using previously reported, well understood, microbes before looking into less well understood systems.
You need to demonstrate what you are seeing is real, and not an artifact of the technique you are using.
You need to demonstrate what you are seeing is real, and not an artifact of the technique you are using.
Context (2): We spent 5 years developing the CELEBS technology before publishing any results. We wanted to make sure that we fully understood the system, and understood what we were reporting (ie if we saw differences in decay, why?).
Context (3): After we made our first SC2 decay measurements, we spent a year before publishing the data. We needed to understand why our data appeared to differ from other studies. Until we knew that, we didn’t know if what we were seeing was due to the technique.
Personally, I feel that if you want to use a new instrument/technique to measure something, you ought to first publish a paper benchmarking the instrument to previous studies. Otherwise, you are simply reporting numbers, and it is impossible to interpret what they mean.
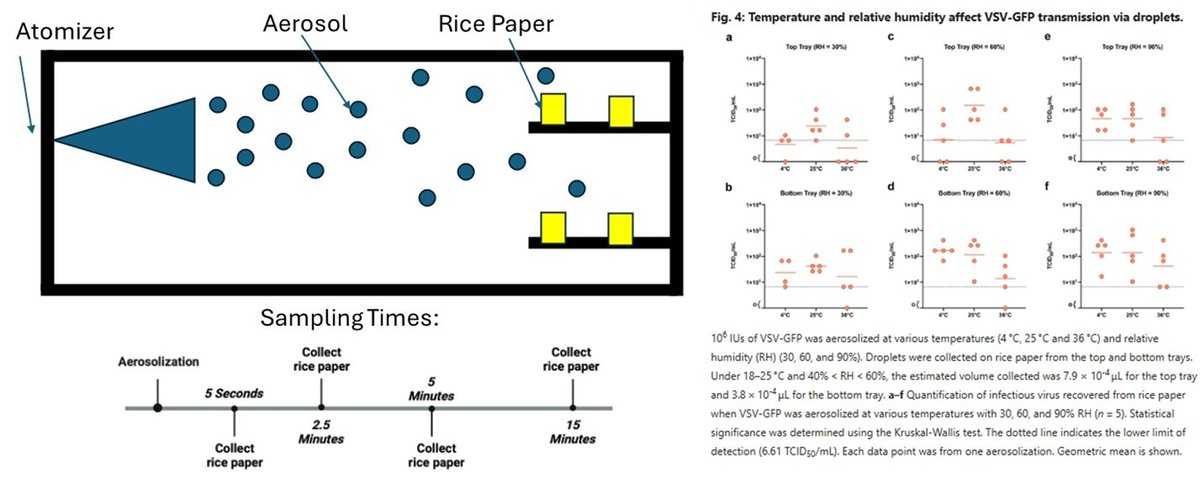
As mentioned, in this study they wanted to measure airborne viral decay. I made this sketch of the experimental setup. Virus solution is aerosolized into the chamber, and periodically the rice paper is removed and the amount of virus on the paper is quantified. 

The readout the infectivity (TCID50) in the rice paper (or later in various other materials) as a function of time, humidity, and temperature. 
Rant (1): Loose use of terminology is an issue. TRANSMISSION is a complex process, within which airborne decay is one of many factors.
Transmission is not measured in this study, yet they repeatedly claim they are. This is problematic.
Transmission is not measured in this study, yet they repeatedly claim they are. This is problematic.
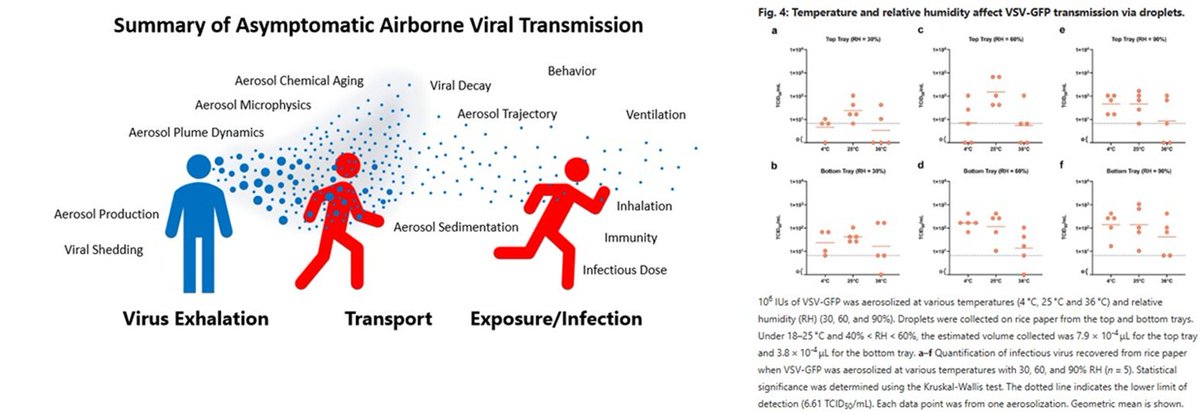
Rant (2):I literally wrote a thread about this the other day. People reporting that they measured transmission when they measured decay is INCORRECT. Period.
You need animal or human models to measure transmission.
You need animal or human models to measure transmission.
https://x.com/ukhadds/status/1955675711936581742
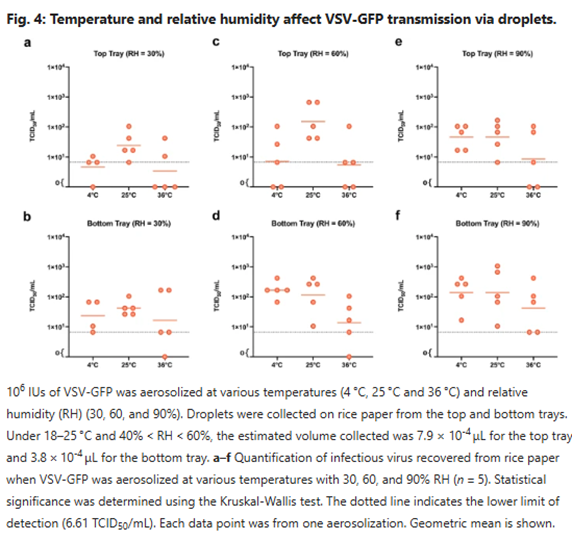
Where was I? Oh yeah, humidity and temperature will affect multiple parameters in this experimental setup. I’ve highlighted just some them in the figure below (there are more).
There is interconnectivity between these processes as well (size affecting sedimentation rate).
There is interconnectivity between these processes as well (size affecting sedimentation rate).
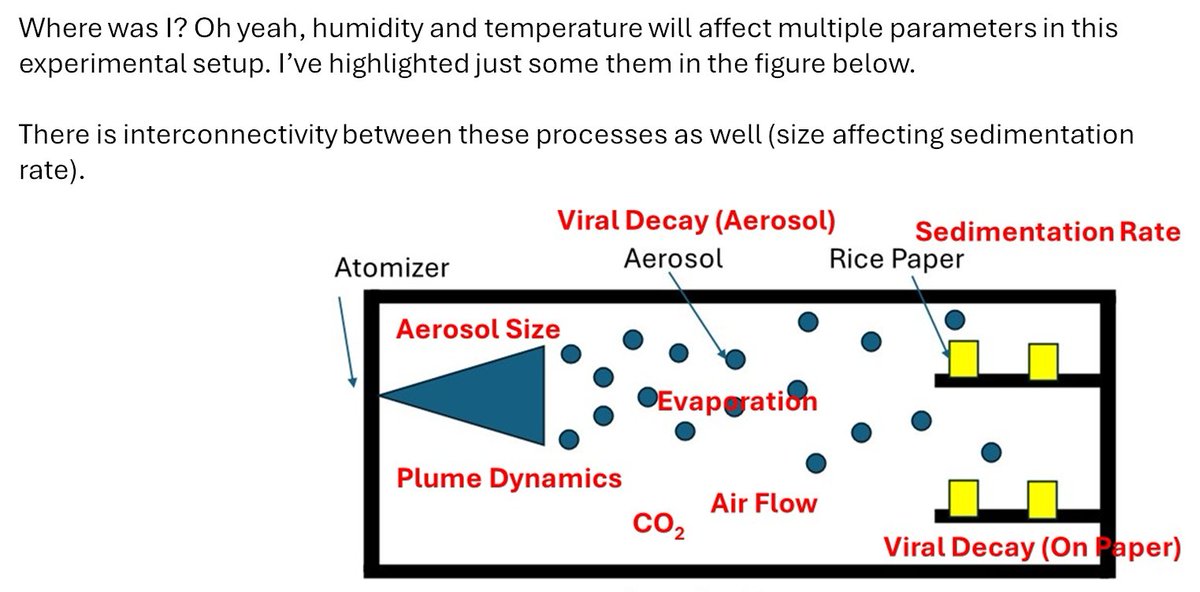
What is being defined as “transmission” in this study is the cumulative effect of all of these processes onto a single readout. The absence of control in this system severely limits what can be learned. 
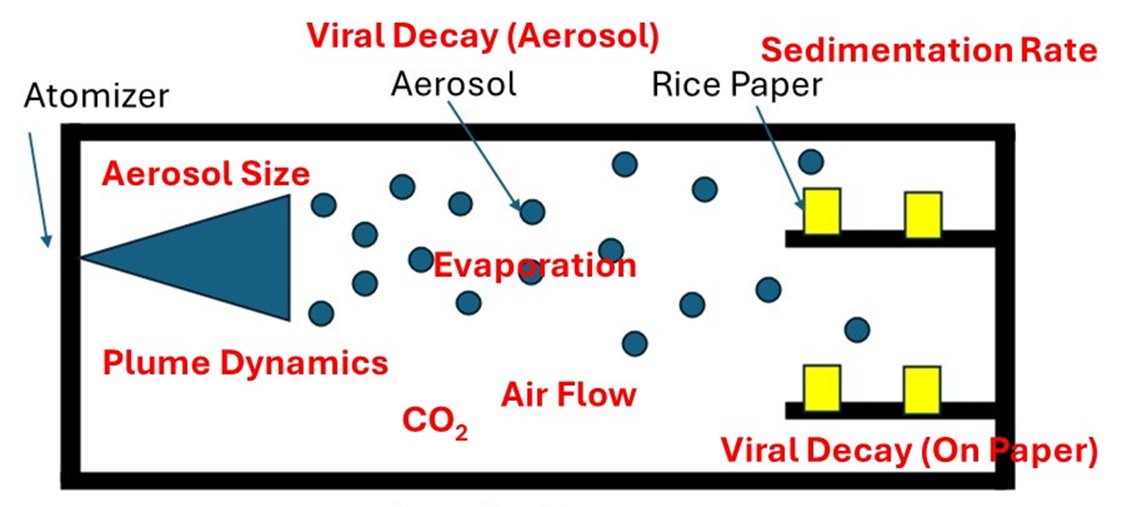
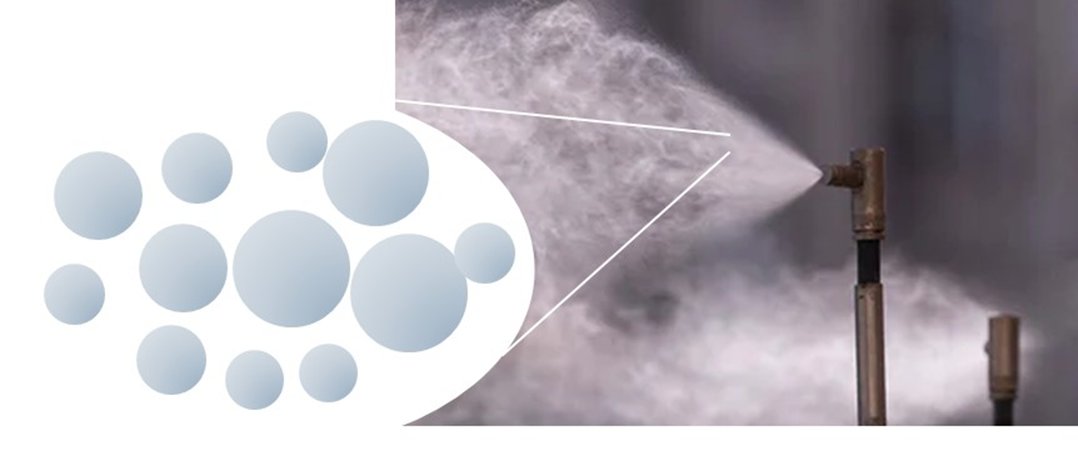
For example, there is a dramatic range in size of the particles studied (diameter from ~10 to 1000). To convert this to TCID50, these values would need to be cubed. What this means is that the trajectory/sedimentation rates of the larger droplets will have a dramatic effect. 
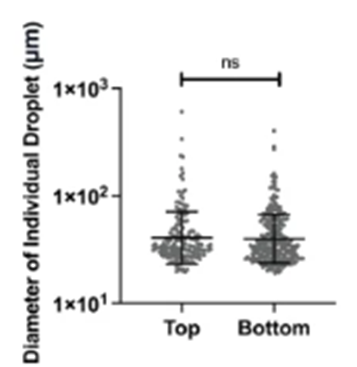
The authors argue that the broader size range is a benefit. I would argue that adding noise into your experimental setup severely limits your ability to interpret your data and understand the underlying drivers of what you are reporting. 

An “internal standard” is used in studies to help control the variables in the experiment. For instance, in airborne viral decay studies, the ratio of TCID50/RNA copies is used to measure decay rates. This is because the RNA is thought to decay much slower than the infectivity.
By using an internal standard, the decay rate of the virus can be solved for. In this study, they didn’t do that. Rather, they report changes in TCID50. This makes it impossible to determine why they see a reported difference. 
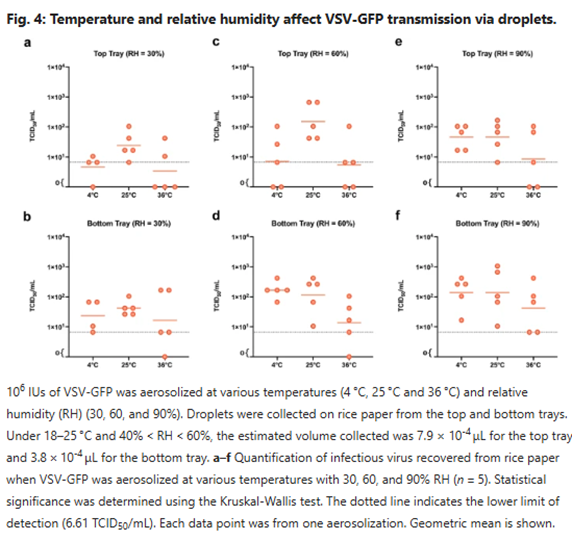
Is the difference in reported viral infectious load due to changes in infectivity or sedimentation rates? Who knows. 
Given that there is no force driving the aerosol sedimentation, the values reported here don’t seem that surprising. The larger aerosol will settle quickly while the smaller ones will remain in the air for a very long time. An equilibrium of sorts will be reached in a few minutes 
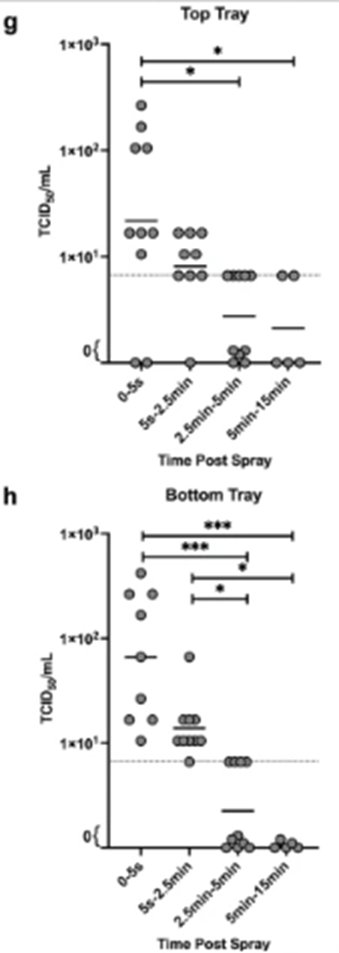
Even though the spray a tremendously high amount of aerosol into the system, the infectious viral load is always at or near the detection limit. If the larger aerosol are barely detected, than there is no chance for the smaller ones. 
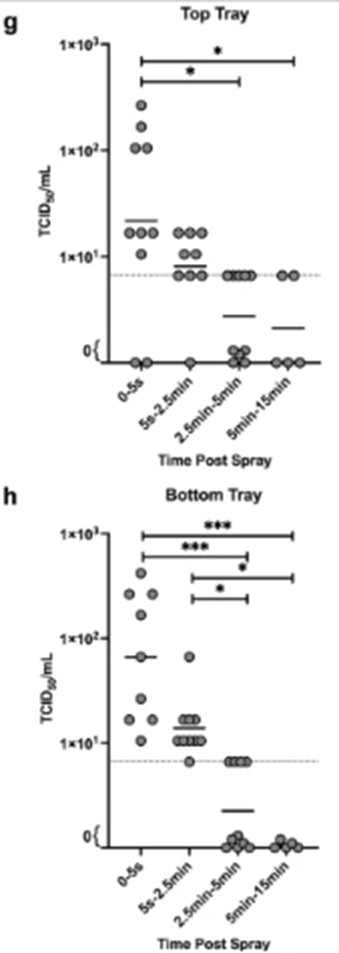
When operating near detection limits, it can become hard to interpret the findings.
A comment was made about the composition of the aerosol having an effect on the reported decay rate. Most studies use growth medium as a proxy for respiratory fluid. Given the driver of decay of SARS-CoV-2, this is a reasonable solution to use.
https://x.com/Nucleocapsoid/status/1957624862152732759
The perceived differences in this study have nothing to do with the aerosol composition and everything to do with the lack of benchmarking and controls.
Side note 1: In Figure 1 they use the same letters to denote different things. Is “h” the humidifier or the visualization pattern? As a reviewer, I find these sorts of things frustrating; the reader should not have to struggle to understand your figure. 
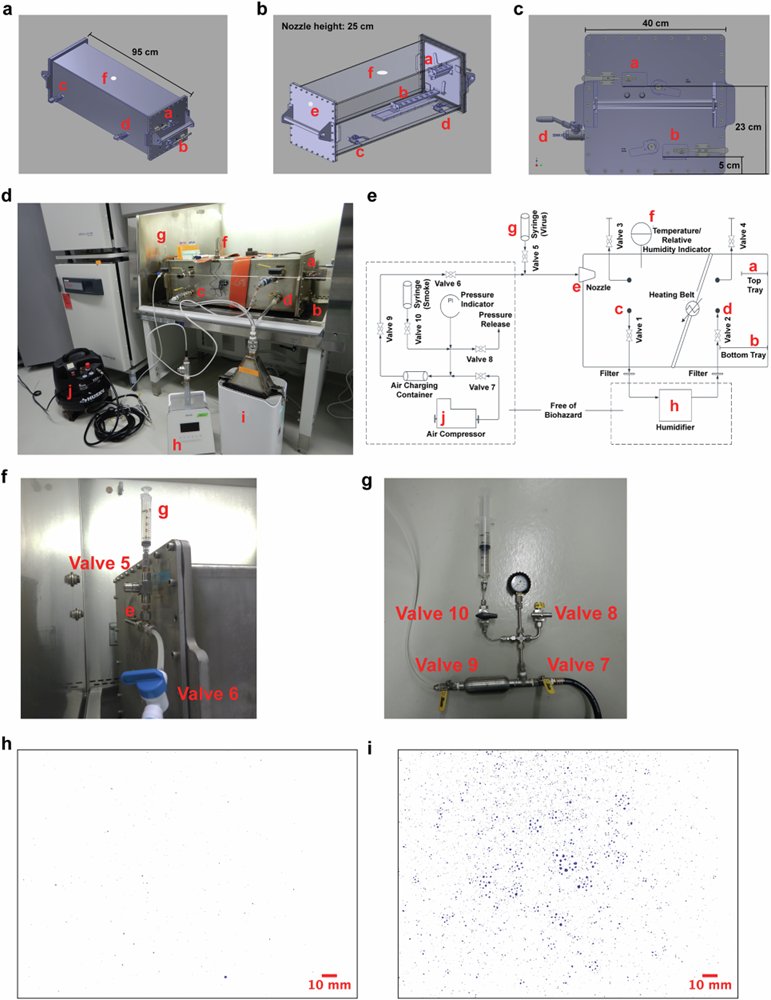
The absence of benchmarking, internal standards, and lack of control in this set up limits how one can interpret this study. Clearly, changing the conditions in the chamber does something on viral decay. Where, how and why remain unclear.
The study is literally, “we changed some factors, saw differences, not sure why.”
It’s curious that they didn’t cite our work (they cited our aerosol evaporation data, not the infectivity data). We’re the only other group to report decay rates on these time scales.
It’s curious that they didn’t cite our work (they cited our aerosol evaporation data, not the infectivity data). We’re the only other group to report decay rates on these time scales.
Anyway, those are just some of my thoughts after a first glance. The effect of aerosolisation on fomite survival is an interesting thing to explore, I'm just not sure the way it was done here answers the question
Wish they had internal standards (woulda dealt with a lot of this)
Wish they had internal standards (woulda dealt with a lot of this)
• • •
Missing some Tweet in this thread? You can try to
force a refresh


