
🧵 Re-Evaluating ULTY Performance Since the New Strategy: NAV Decline Since 7/21/25 (Post-New Strategy Peak) & 10-Year DRIP Projections
ULTY's March 2025 strategy revamp (direct holdings, protective puts, credit spreads) aimed to stabilize the fund amid high yields. But with NAV declining ~9.5% since July 21, 2025 (from ~$6.33 to $5.73 as of Aug 19), is it working? Let's re-evaluate performance, causes of the slide, and run updated 10-year projections for $100K with 100% DRIP starting July 25, 2025, in bull, stagnant, and bear markets. Hypotheticals based on data 👇
ULTY's March 2025 strategy revamp (direct holdings, protective puts, credit spreads) aimed to stabilize the fund amid high yields. But with NAV declining ~9.5% since July 21, 2025 (from ~$6.33 to $5.73 as of Aug 19), is it working? Let's re-evaluate performance, causes of the slide, and run updated 10-year projections for $100K with 100% DRIP starting July 25, 2025, in bull, stagnant, and bear markets. Hypotheticals based on data 👇
1/9. The Strategy Change: What Happened in March 2025?
Pre-March: ULTY used synthetic positions, leading to heavy NAV erosion (~70% drop from launch Feb 2024 at $20 to ~$7 by March).
Post-Change: Shifted to direct ownership of 15-30 high-vol U.S. stocks (e.g., NVDA, MSTR), added OTM puts for downside cushion (~5-10%), credit call spreads for moderate upside capture, and flexible call writing. Weekly distributions started.
Goal: Boost income (~85% yield) while reducing erosion risks.
2/9. Performance Re-Evaluation: Total Return Since March
From March 10 to Aug 19, 2025 (~5.5 months):
- Total Return (price + reinvested divs): ~27.7% (outpaced Nasdaq 100's 18.4%).
- Price Return: ~ -15% (NAV from ~$6.79 Mar 6 to $5.73).
- Annualized Return: ~60% (total, driven by divs). Vol ~33%; Sharpe ~1.10 (good for short period).
Revamp succeeded in boosting total returns via better protection, but NAV erosion (~34% ann. rate) persists due to distros.
3/9. The NAV Decline Since July 21, 2025: Causes & Context
Since July 21 (NAV $6.33) to Aug 19 ($5.73): -9.5% (~2.4% weekly).
Causes:
- Distributions: Weekly ~$0.10/share ex-div drops (ROC reduces basis, not loss).
- Market/Vol Weakness: Tech dips (NVDA etc.), low vol reduces premiums.
- Strategy: Full downside in bears (puts limited cushion).
- Broader: Election/rate vol, AI slowdown.
Context: Slower than pre-revamp (~70% drop in year), but ongoing—total return positive ~5-7% since July 21. Worry if erosion > yields long-term.
4/9. 10-Year Projection Setup: $100K with 100% DRIP from July 25, 2025
Start: July 25 NAV ~$6.25 → 16,000 shares.
Assumptions (updated from recent 85% yield, ~34% ann. erosion since March):
- Annual model (real weekly); DRIP compounds.
- Bull: 70% yield (vol sustains),
-10% NAV change (gains offset).
- Stagnant: 60% yield,
-15% NAV change.
- Bear: 50% yield, -25% NAV change (vol thin, downside hits).
No taxes (ROC defers); projections illustrative.
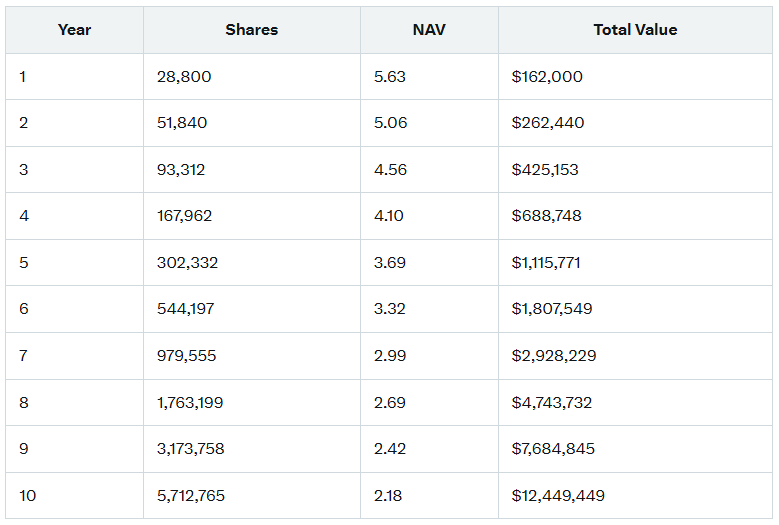
5/9. Bull Market Projection: High Vol, Upside Capture Yields strong, erosion minimal.
End: ~$12.4M.
End: ~$12.4M.
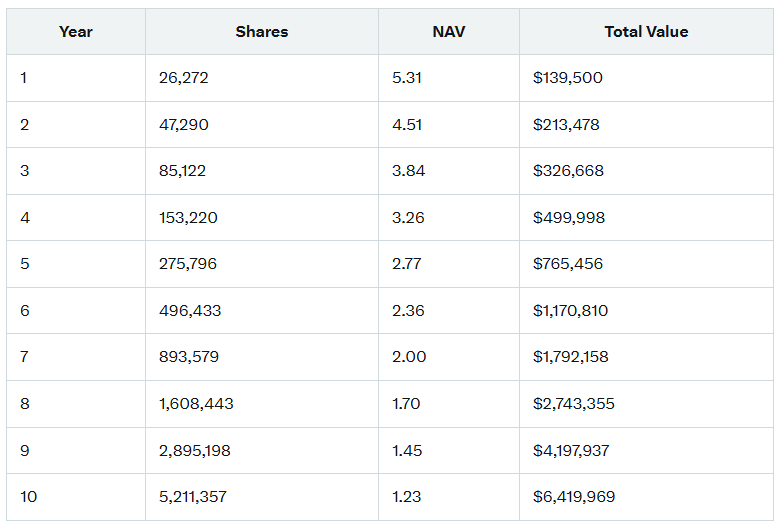
6/9. Stagnant Market Projection: Steady Vol, Mild Erosion Balanced, yields dominate erosion.
End: ~$6.4M.
End: ~$6.4M.
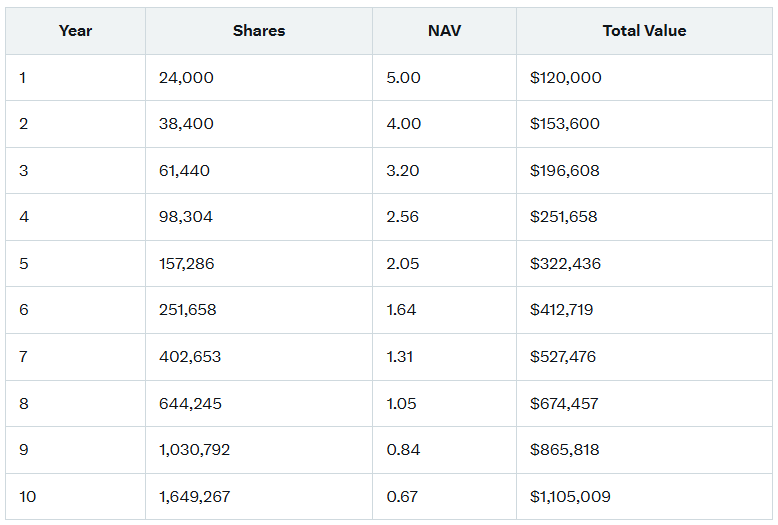
7/9. Bear Market Projection: Low Vol, Heavy Erosion Yields drop, downside amplifies.
End: ~$1.1M.
End: ~$1.1M.
8/9. Why These Projections & Realism
Model: Annual compounding (real weekly); yield from current ~85%, erosion from ~34% ann. since March.
Bull: Strong vol/gains reduce erosion.
Stagnant: Base case.
Bear: Vol dries, downside hits.
Risks: Assumptions vary; new fund history limited. DRIP offsets erosion via shares.
Model: Annual compounding (real weekly); yield from current ~85%, erosion from ~34% ann. since March.
Bull: Strong vol/gains reduce erosion.
Stagnant: Base case.
Bear: Vol dries, downside hits.
Risks: Assumptions vary; new fund history limited. DRIP offsets erosion via shares.
9/9. TLDR: ULTY since March 2025: Total return ~27.7% (strong), but NAV down ~15.6% from erosion/distros. Decline since July 21 (~9.5%) ongoing but slowed post-revamp. $100K DRIP from July 25 could grow to $1.1M (bear), $6.4M (stagnant), $12.4M (bull) over 10 years—yield powers despite slide.
📖 For Educational Purposes Only
🚨 Not Financial Advice
👉 Do Your Own Research
I drop educational threads daily. If value, ❤️ or 🔁 helps spread knowledge!
ULTY re-eval? Below!
📖 For Educational Purposes Only
🚨 Not Financial Advice
👉 Do Your Own Research
I drop educational threads daily. If value, ❤️ or 🔁 helps spread knowledge!
ULTY re-eval? Below!
• • •
Missing some Tweet in this thread? You can try to
force a refresh


