🚨 Cracks are showing in the U.S. job market.
Layoffs are rising. Continuing claims are stuck at 2021 levels.
The labor market bend is here, will it break?
(a thread)
Layoffs are rising. Continuing claims are stuck at 2021 levels.
The labor market bend is here, will it break?
(a thread)
First: what are jobless claims? They’re applications for unemployment benefits. If you get laid off, you file a claim.
Every week, the government counts how many people file.
That number = the earliest red flag on the health of the labor market.
Every week, the government counts how many people file.
That number = the earliest red flag on the health of the labor market.
Last week, initial claims rose to 235,000. That’s up 11,000 from the week before.
Economists expected 225,000. Missing forecasts by that much shows layoffs are stronger than models predicted.
Initial claims = fresh layoffs.
Economists expected 225,000. Missing forecasts by that much shows layoffs are stronger than models predicted.
Initial claims = fresh layoffs.
Here’s why direction matters. 235k isn’t catastrophic.
But when the number rises week after week, it means layoffs are spreading not just a blip at one company or one state.
That’s how a slowdown starts to snowball.
But when the number rises week after week, it means layoffs are spreading not just a blip at one company or one state.
That’s how a slowdown starts to snowball.
What about the “4-week moving average”? It’s just the average of the last 4 weeks of claims.
Why does it matter? It smooths out weird one-week spikes.
That average just rose to 226,250, the highest in a month. That’s momentum, not noise.
Why does it matter? It smooths out weird one-week spikes.
That average just rose to 226,250, the highest in a month. That’s momentum, not noise.
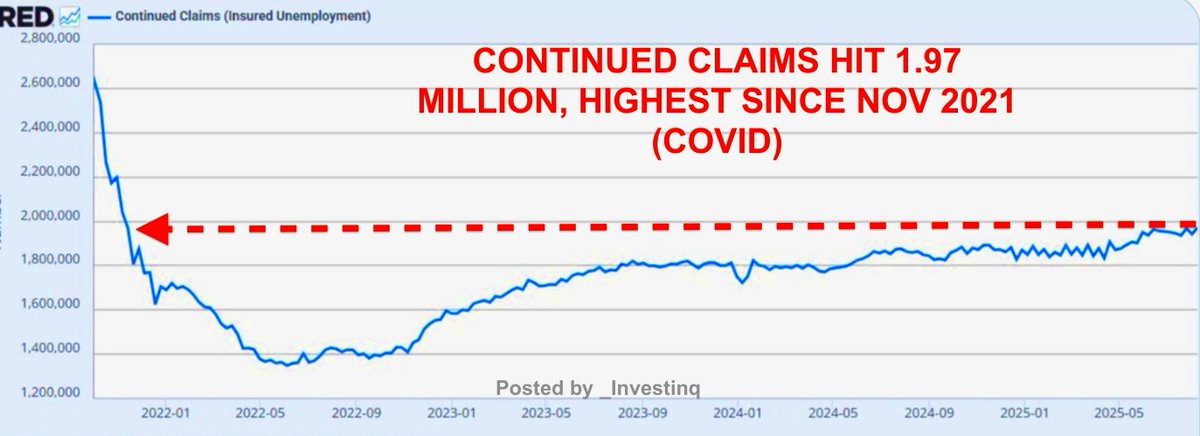
Now the real red flag: continuing claims. This tracks people still receiving benefits because they haven’t found a new job.
They just jumped to 1.97 million.
That’s the highest since November 2021. Translation: rehiring is slowing down.
They just jumped to 1.97 million.
That’s the highest since November 2021. Translation: rehiring is slowing down.
Think of the difference: Initial claims = “I just lost my job.”
Continuing claims = “I lost my job weeks ago… and I still don’t have a new one.”
When continuing claims climb, it means workers are stuck unemployed longer.
Continuing claims = “I lost my job weeks ago… and I still don’t have a new one.”
When continuing claims climb, it means workers are stuck unemployed longer.
The insured unemployment rate stayed at 1.3%.
What’s that? It’s the % of workers covered by unemployment insurance who are claiming benefits.
It sounds tiny, but it’s up from 1.2% a year ago. Creeping up = more people relying on the safety net.
What’s that? It’s the % of workers covered by unemployment insurance who are claiming benefits.
It sounds tiny, but it’s up from 1.2% a year ago. Creeping up = more people relying on the safety net.
Raw (unadjusted) claims actually fell to 194,920.
Why the difference? Because those are the actual filings before adjusting for seasonal patterns.
States like California, Michigan, and Texas saw drops But rises in Kentucky, Massachusetts, and Iowa offset them.
Why the difference? Because those are the actual filings before adjusting for seasonal patterns.
States like California, Michigan, and Texas saw drops But rises in Kentucky, Massachusetts, and Iowa offset them.
Here’s where seasonal adjustment comes in.
Claims naturally rise and fall with holidays, school calendars, and weather.
Adjusting removes those quirks so we see the true trend And adjusted claims are rising showing the labor market is cooling.
Claims naturally rise and fall with holidays, school calendars, and weather.
Adjusting removes those quirks so we see the true trend And adjusted claims are rising showing the labor market is cooling.
State breakdown: Biggest increases came from California (+741), New York (+630), Rhode Island (+570), Michigan (+527), and Maryland (+343).
Biggest decreases were Iowa (-704), Illinois (-334), and New Jersey (-251).
Layoffs are uneven, but spreading.
Biggest decreases were Iowa (-704), Illinois (-334), and New Jersey (-251).
Layoffs are uneven, but spreading.
Why does Wall Street care so much about jobless claims? Because this data comes out every Thursday at 8:30 ET.
It’s real-time.
Monthly jobs reports are lagged and revised. Claims = one of the cleanest, earliest reads on labor stress.
It’s real-time.
Monthly jobs reports are lagged and revised. Claims = one of the cleanest, earliest reads on labor stress.
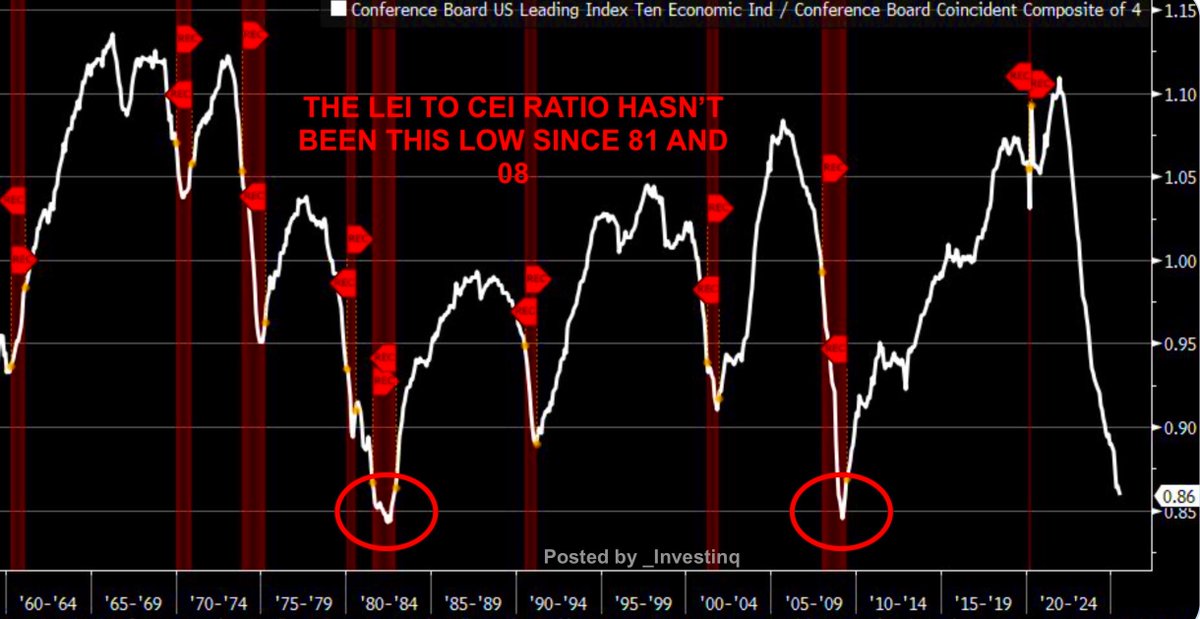
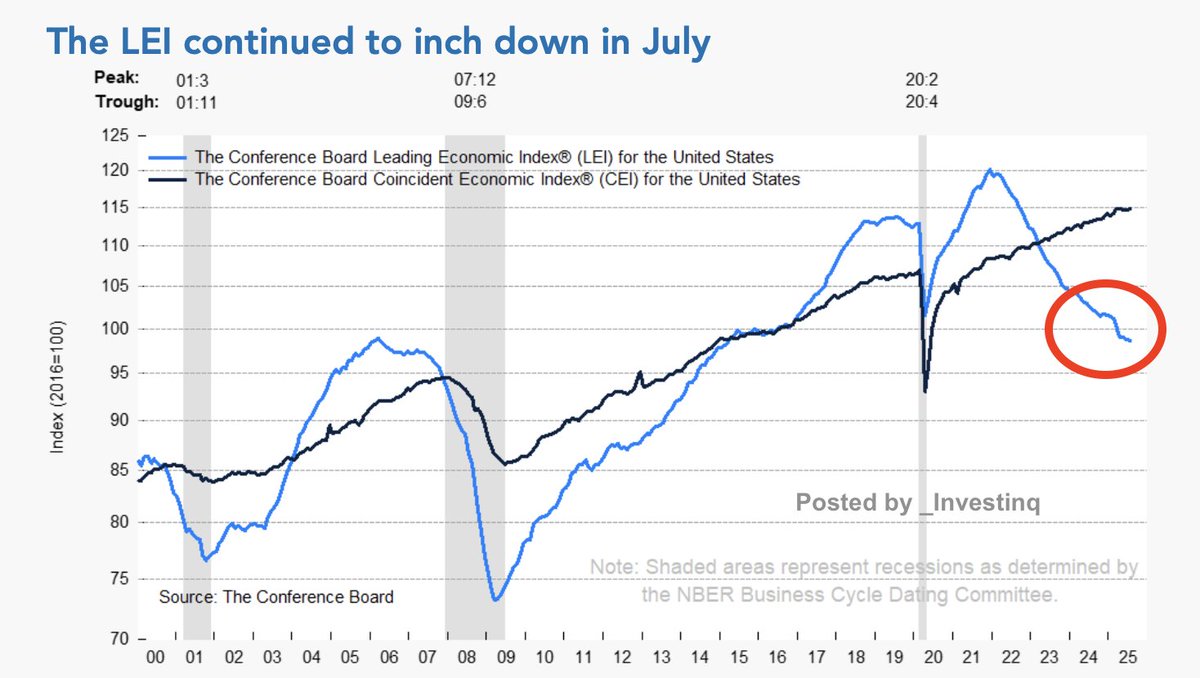
Let’s define some timing.
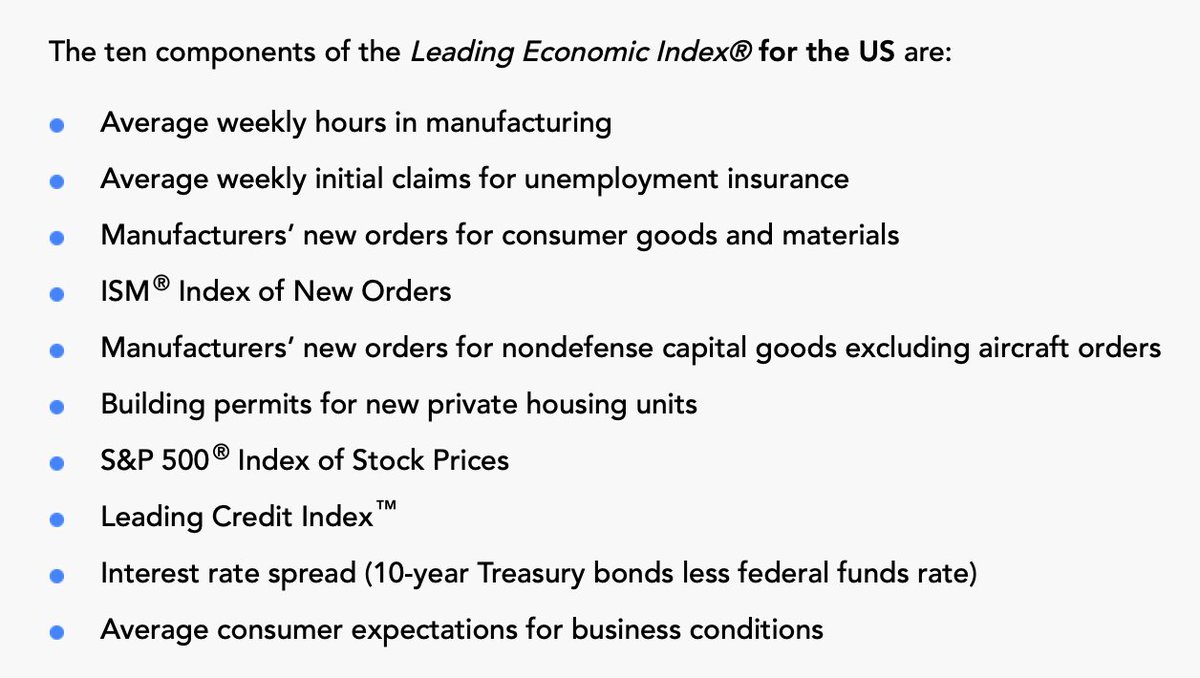
• Leading indicator = moves before the economy shifts (jobless claims).
• Coincident indicator = moves at the same time as the economy (continuing claims).
Both are now rising together, a strong signal of slowing momentum.
• Leading indicator = moves before the economy shifts (jobless claims).
• Coincident indicator = moves at the same time as the economy (continuing claims).
Both are now rising together, a strong signal of slowing momentum.
History check: When claims rise above 300,000 and stay there, recessions often follow.
We’re at 235,000 now not recessionary, but rising.
The slope matters and the slope is turning higher.
We’re at 235,000 now not recessionary, but rising.
The slope matters and the slope is turning higher.
This isn’t happening in isolation. July’s jobs report already showed slower hiring and higher unemployment.
Now weekly claims are echoing the same message.
When two datasets agree, it’s rarely random. It’s usually the beginning of a trend.
Now weekly claims are echoing the same message.
When two datasets agree, it’s rarely random. It’s usually the beginning of a trend.
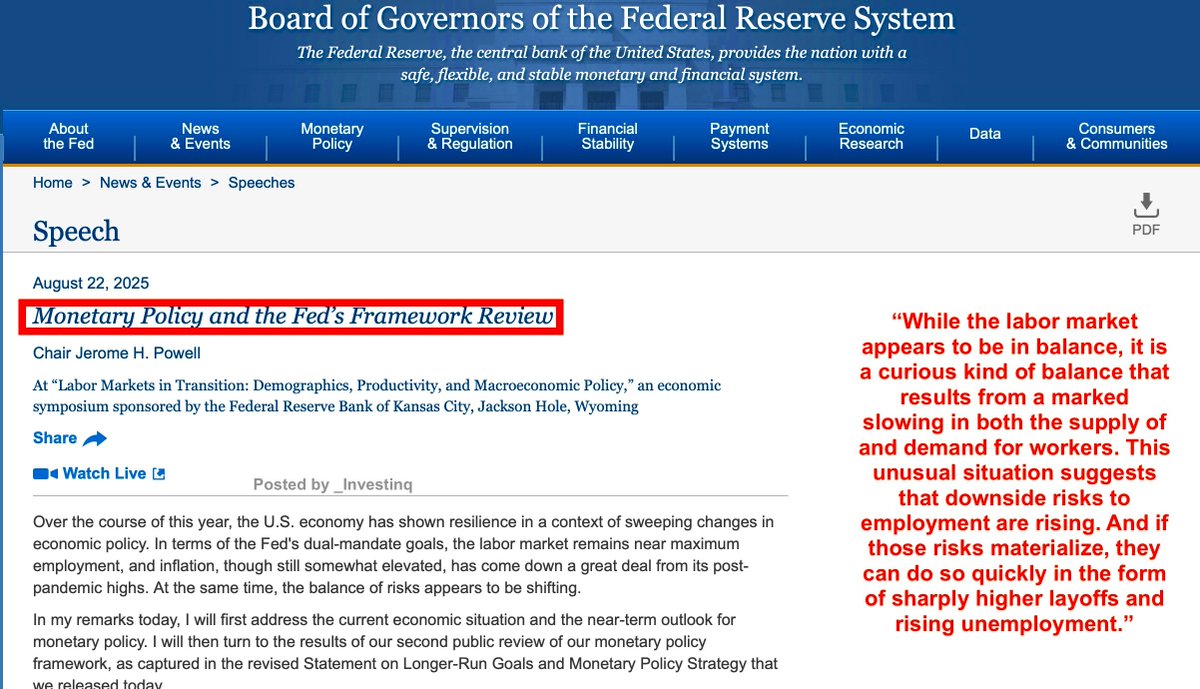
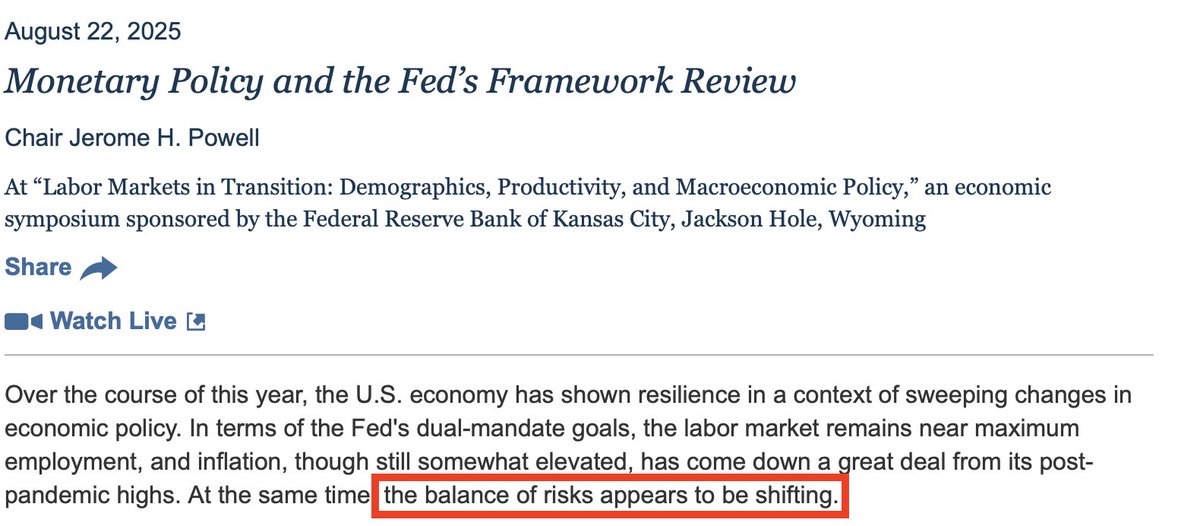
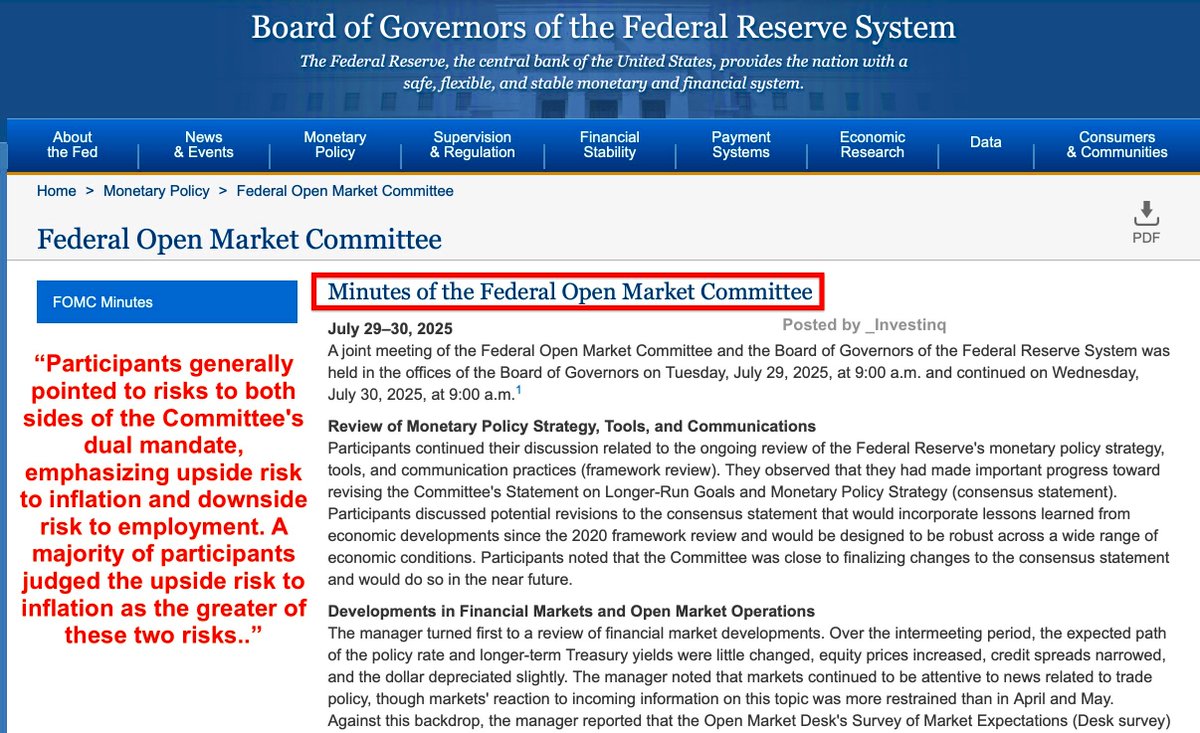
For the Fed, this is a headache. If unemployment rises while inflation cools, they’ll feel pressure to cut interest rates.
But if they cut too soon, inflation could reignite.
Wait too long, and the slowdown deepens. Claims data tips that balance.
But if they cut too soon, inflation could reignite.
Wait too long, and the slowdown deepens. Claims data tips that balance.
Why do rate cuts matter here? Lower rates = cheaper borrowing for businesses and consumers.
That can keep hiring alive and soften a slowdown.
But cuts are a double-edged sword, helping jobs while risking higher inflation.
That can keep hiring alive and soften a slowdown.
But cuts are a double-edged sword, helping jobs while risking higher inflation.
This is bigger than jobs, it’s about spending.
When people can’t find work, wage growth slows. Families cut back. Consumer spending drives 70% of U.S. GDP.
If jobless claims keep rising, the slowdown spreads beyond workers to the whole economy.
When people can’t find work, wage growth slows. Families cut back. Consumer spending drives 70% of U.S. GDP.
If jobless claims keep rising, the slowdown spreads beyond workers to the whole economy.
Compare 2021 vs 2025. Back then, jobs were everywhere. Wages were rising. Workers had leverage.
Fast forward: layoffs are sticking. Continuing claims prove it.
Employers are back in control, and bargaining power is shifting away from workers.
Fast forward: layoffs are sticking. Continuing claims prove it.
Employers are back in control, and bargaining power is shifting away from workers.
Bottom line: 235k initial claims don’t scream “recession.” but nearly 2 million continuing claims tell a deeper story.
The labor market is losing steam.
And when both numbers rise together, it’s the bend before the break.
The labor market is losing steam.
And when both numbers rise together, it’s the bend before the break.
Next week matters. If claims rise again, the story shifts from “slowing” to “slipping.”
And once the slip starts, momentum accelerates.
Jobless claims are often the first domino in a bigger economic chain reaction.
And once the slip starts, momentum accelerates.
Jobless claims are often the first domino in a bigger economic chain reaction.
Here’s a metaphor: Initial claims are the smoke. Continuing claims are the fire.
Right now, we’re seeing both.
The question is whether this sparks a small slowdown or spreads into something much bigger.
Right now, we’re seeing both.
The question is whether this sparks a small slowdown or spreads into something much bigger.
Remember: the labor market bends before the economy breaks and right now, claims are bending.
The question isn’t if this becomes a story. It already is.
The question is: how fast does it become the story?
The question isn’t if this becomes a story. It already is.
The question is: how fast does it become the story?
If you found these insights valuable: Sign up for my Weekly FREE newsletter! thestockmarket.news
I hope you've found this thread helpful.
Follow me @_Investinq for more.
Like/Repost the quote below if you can:
Follow me @_Investinq for more.
Like/Repost the quote below if you can:
https://x.com/_investinq/status/1958521814486819009?s=46
• • •
Missing some Tweet in this thread? You can try to
force a refresh