🚨 The U.S. just triggered its fourth straight recession signal.
The LEI vs. CEI ratio hasn’t been this low since ‘81 and ‘08.
The last time it looked like this? Right before the economy broke.
(a thread)
The LEI vs. CEI ratio hasn’t been this low since ‘81 and ‘08.
The last time it looked like this? Right before the economy broke.
(a thread)

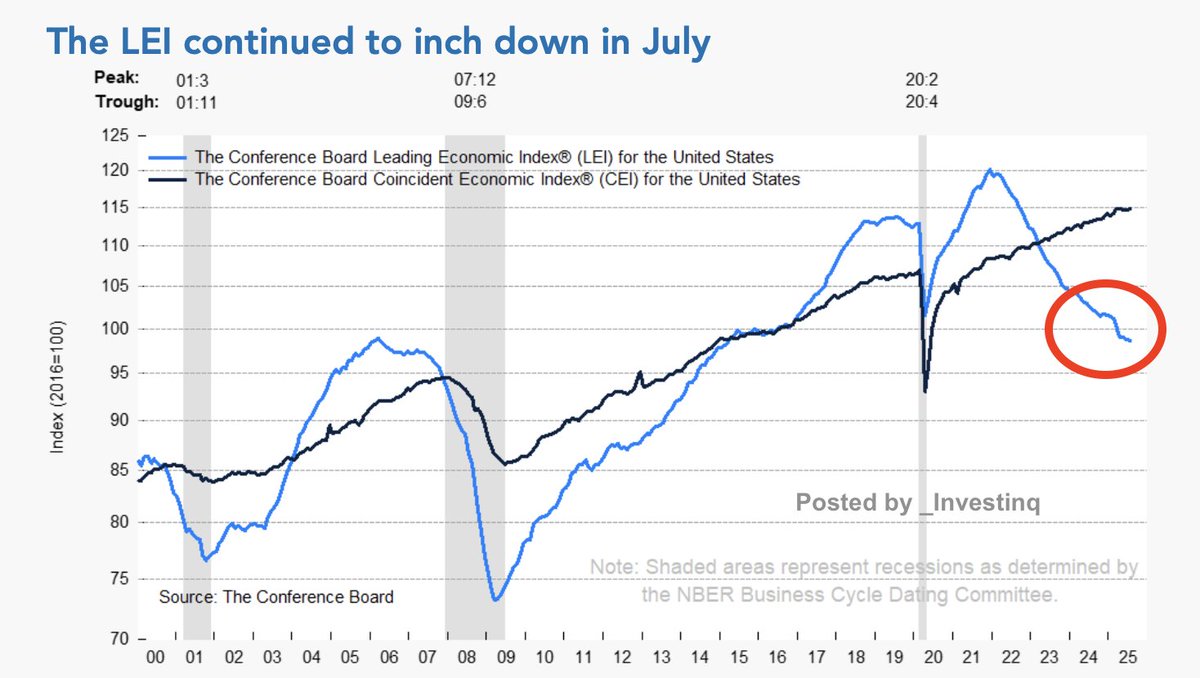
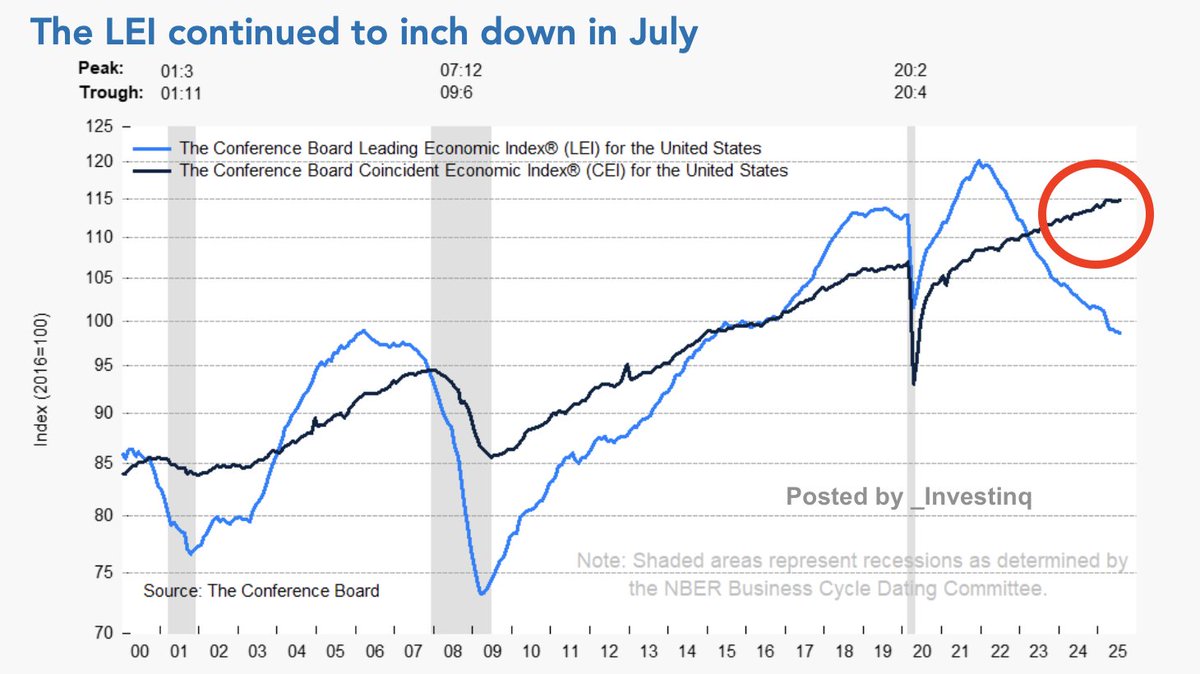
The Leading Economic Index (LEI) fell again in July, dipping by 0.1% to 98.7.
That might sound like a small move but the trend is what matters.
Over the past six months, the LEI has dropped 2.7%, signaling growing cracks beneath the surface.
That might sound like a small move but the trend is what matters.
Over the past six months, the LEI has dropped 2.7%, signaling growing cracks beneath the surface.
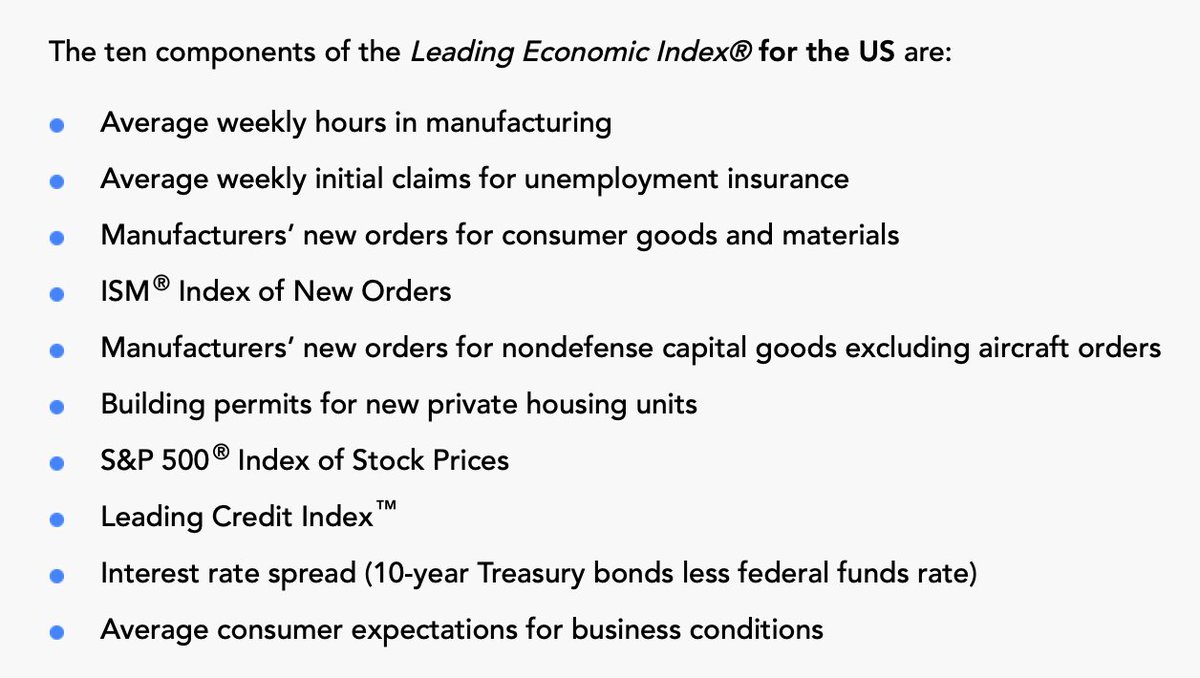
What exactly is the LEI? It’s a tool that tracks 10 economic indicators that usually start moving before the economy as a whole does.
These include things like new orders from manufacturers, consumer expectations, jobless claims, and stock prices.
It’s like a weather forecast but for the economy.
These include things like new orders from manufacturers, consumer expectations, jobless claims, and stock prices.
It’s like a weather forecast but for the economy.
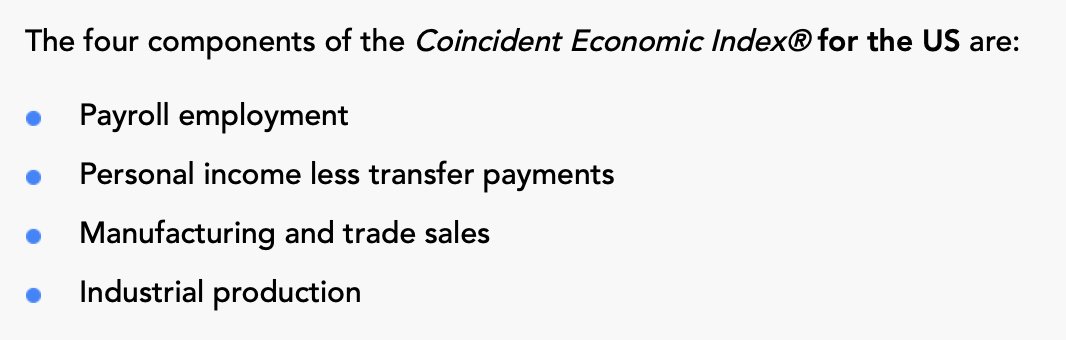
On the other side, we have the Coincident Economic Index (CEI).This is made up of four indicators that move in real time with the economy such as:
– Payroll jobs
– Real income (after subtracting government aid)
– Industrial production
– Business sales
It tells us how the economy is doing right now
– Payroll jobs
– Real income (after subtracting government aid)
– Industrial production
– Business sales
It tells us how the economy is doing right now
In July, the CEI rose by 0.2%, and over the past six months it’s up 0.9%, a sign that the economy is still growing in the moment.
But here’s the problem: when the LEI is falling while the CEI is rising, it often means we’re near a turning point.
But here’s the problem: when the LEI is falling while the CEI is rising, it often means we’re near a turning point.
That brings us to the LEI/CEI ratio, a comparison of future signals vs. present reality.
When this ratio falls sharply, it suggests that the momentum in the economy is breaking down.
Right now, that ratio is the lowest it’s been since the last two major U.S. recessions.
When this ratio falls sharply, it suggests that the momentum in the economy is breaking down.
Right now, that ratio is the lowest it’s been since the last two major U.S. recessions.
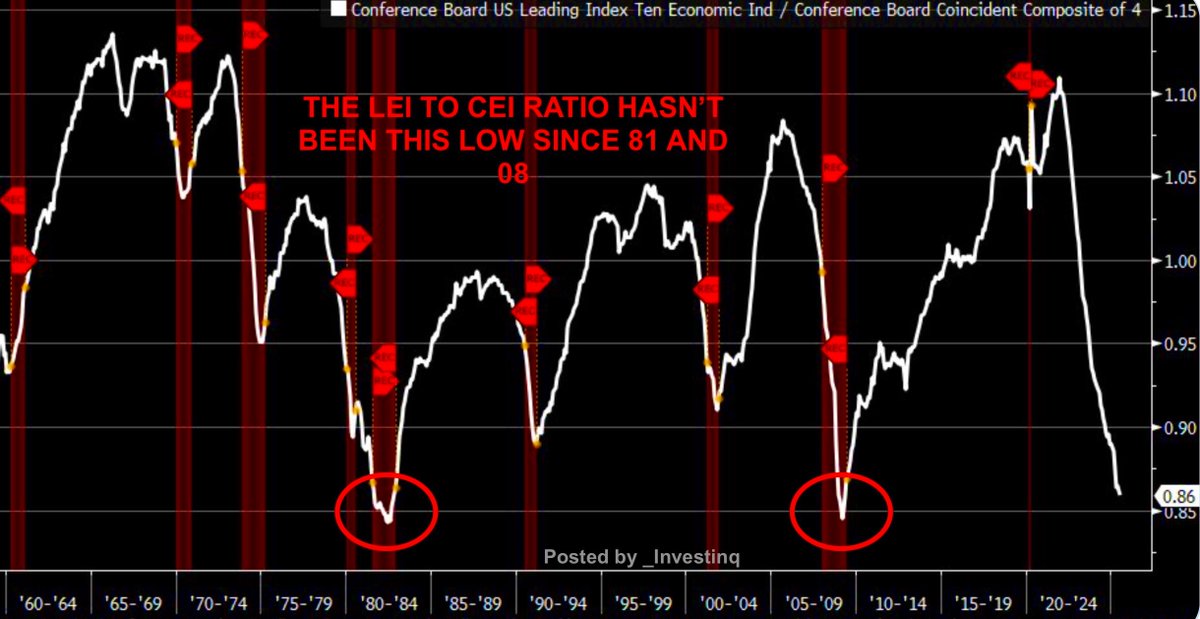
In fact, the only two times this ratio was lower:
– The 1981–82 recession, when inflation and interest rates soared
– The 2007–09 financial crisis, driven by housing and banking collapse
We’re now in that same territory again despite strong present-day data.
– The 1981–82 recession, when inflation and interest rates soared
– The 2007–09 financial crisis, driven by housing and banking collapse
We’re now in that same territory again despite strong present-day data.
So what’s dragging the LEI down?
• Weak new orders from manufacturers
• Pessimistic consumer expectations
• Soft housing data
• Stock prices are still rising
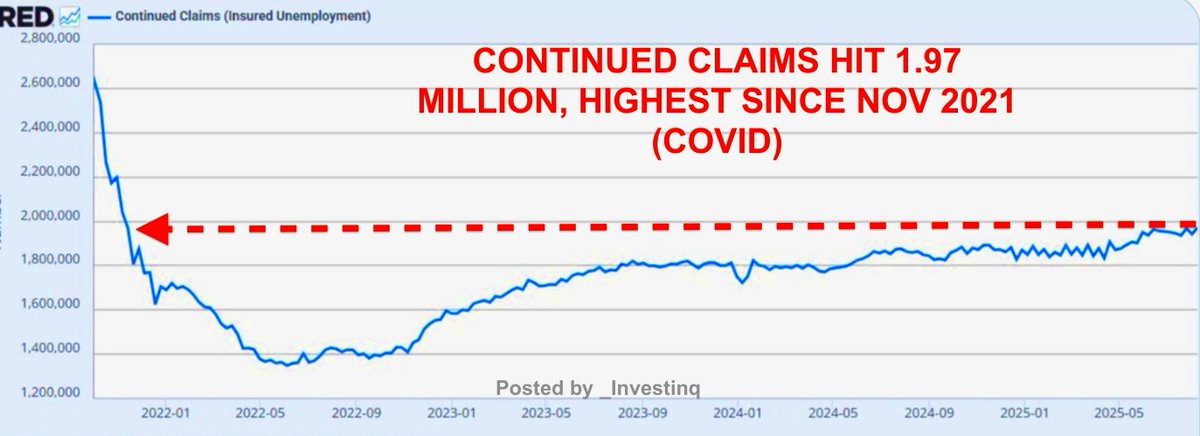
• Jobless claims improved in July
But the positives haven’t been strong enough to reverse the trend.
• Weak new orders from manufacturers
• Pessimistic consumer expectations
• Soft housing data
• Stock prices are still rising
• Jobless claims improved in July
But the positives haven’t been strong enough to reverse the trend.

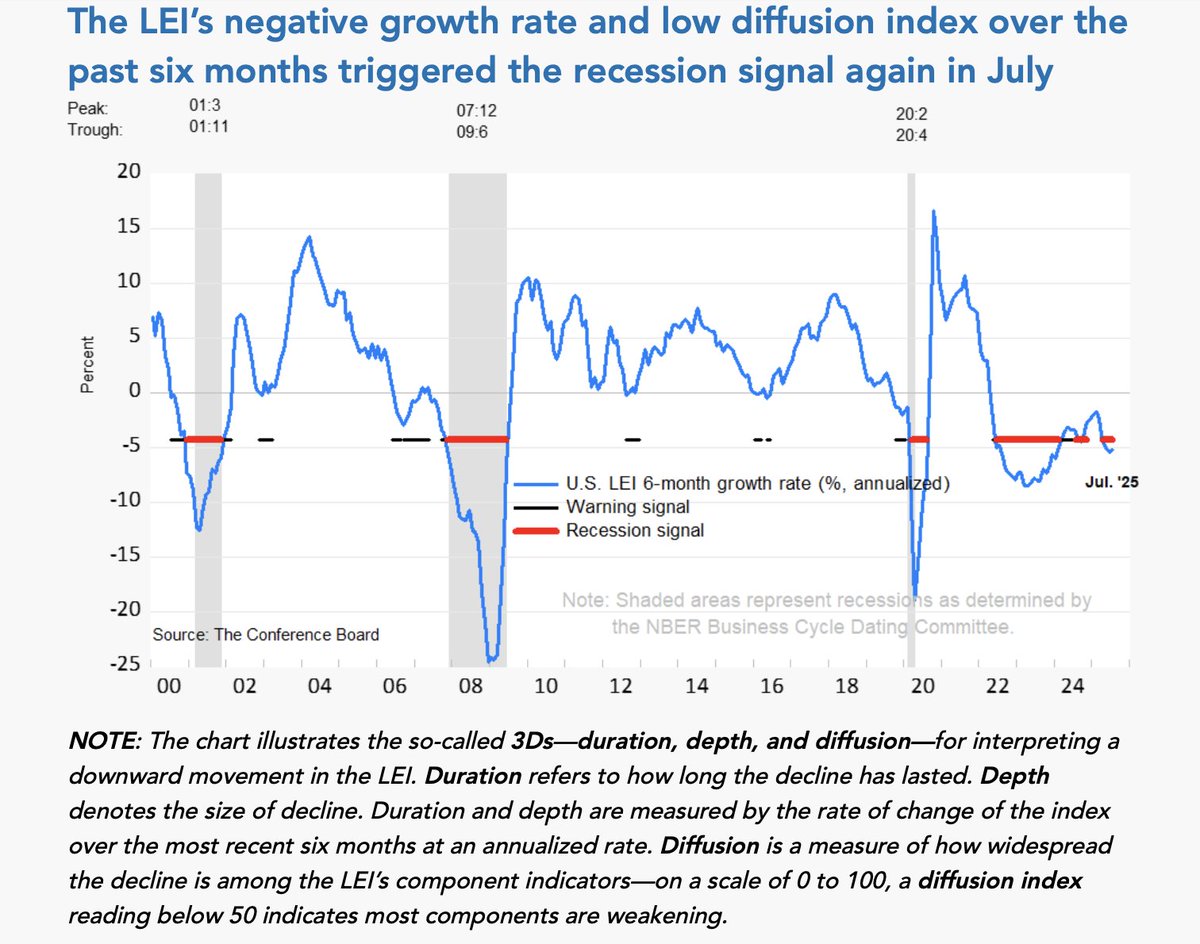
The Conference Board, which compiles these indexes, uses a method called the 3Ds Rule to determine if a recession signal has been triggered
• Duration: LEI has been falling for 6+ months ✅
• Depth: the drop is steep enough ✅
• Diffusion: most components are weakening ✅
July checks all three.
• Duration: LEI has been falling for 6+ months ✅
• Depth: the drop is steep enough ✅
• Diffusion: most components are weakening ✅
July checks all three.
Now, you might ask: if the warning signals are so strong, why aren’t we in a recession yet?
Because the economy today measured by the CEI still looks solid. Jobs are what strong. Incomes are holding up for now. Consumers are still spending.
But this is typical in late-cycle environments.
Because the economy today measured by the CEI still looks solid. Jobs are what strong. Incomes are holding up for now. Consumers are still spending.
But this is typical in late-cycle environments.
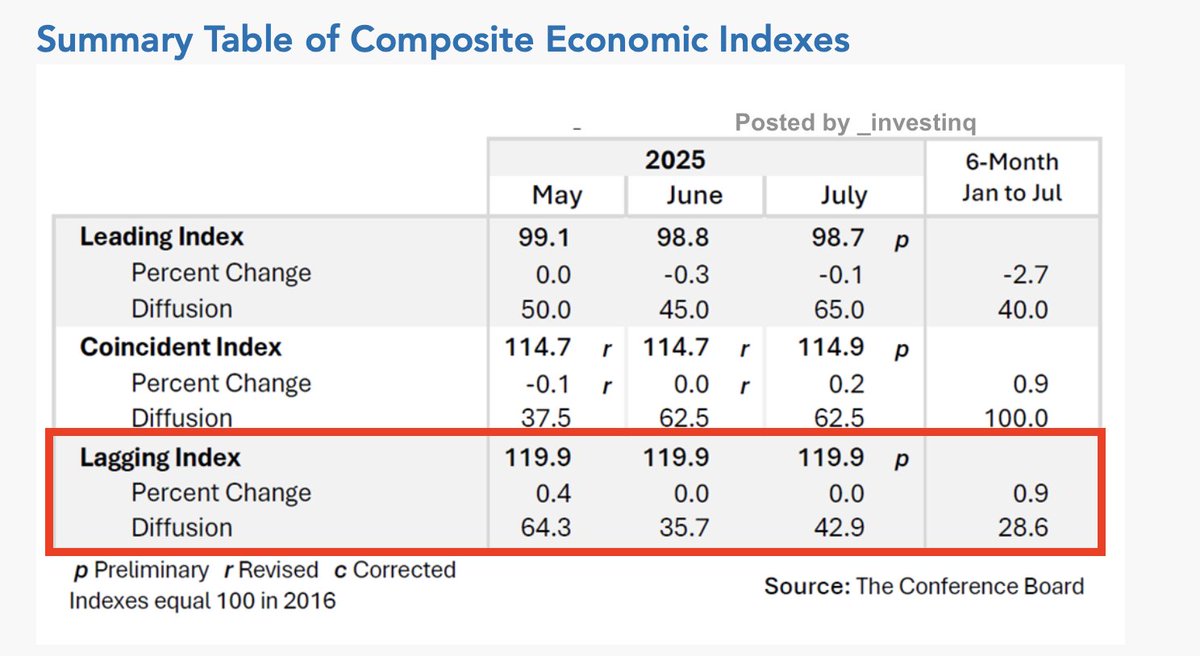
The Lagging Economic Index (LAG) which shows what’s already happened was flat in July.
It includes things like business borrowing, labor costs, and consumer debt. It tends to reflect the past more than the future.
And right now? It still looks fine. As always until it doesn’t.
It includes things like business borrowing, labor costs, and consumer debt. It tends to reflect the past more than the future.
And right now? It still looks fine. As always until it doesn’t.
So where’s all this heading? The Conference Board isn’t officially predicting a recession yet, but they are forecasting a noticeable slowdown:
– 1.6% GDP growth in 2025
– 1.3% growth in 2026
One reason? Tariffs are now pushing prices higher and slowing consumer demand.
– 1.6% GDP growth in 2025
– 1.3% growth in 2026
One reason? Tariffs are now pushing prices higher and slowing consumer demand.

Let’s zoom out:
• LEI (future): weakening
• CEI (present): still growing
• LAG (past): steady
That’s the same pattern we’ve seen at major turning points in the economy and the LEI/CEI ratio is already where it was at the ends of previous recessions not the beginning.
• LEI (future): weakening
• CEI (present): still growing
• LAG (past): steady
That’s the same pattern we’ve seen at major turning points in the economy and the LEI/CEI ratio is already where it was at the ends of previous recessions not the beginning.
Bottom line: The economy looks fine right now. But the indicators that usually predict trouble ahead are flashing red.
This doesn’t mean a crisis is imminent but it does mean the odds of a downturn are rising.
Smart observers won’t wait for the headlines.
This doesn’t mean a crisis is imminent but it does mean the odds of a downturn are rising.
Smart observers won’t wait for the headlines.
Whether you’re an investor, a policymaker, or just trying to understand what’s coming:
Pay less attention to the present and more to where the future is pointing.
And right now, the future looks uncertain.
Pay less attention to the present and more to where the future is pointing.
And right now, the future looks uncertain.
If you found these insights valuable: Sign up for my Weekly FREE newsletter! thestockmarket.news
I hope you've found this thread helpful.
Follow me @_Investinq for more.
Like/Repost the quote below if you can:
Follow me @_Investinq for more.
Like/Repost the quote below if you can:
https://x.com/_investinq/status/1958980549160145391?s=46
@FinanceLancelot you may like this :)
@StealthQE4 @VladTheInflator
• • •
Missing some Tweet in this thread? You can try to
force a refresh