🚨 Buckle up: Wall Street’s biggest test of the summer is here.
Housing, confidence, GDP, jobs, inflation, and Nvidia earnings all hit in one week.
The outcome could decide whether September brings cuts or chaos.
(a thread)
Housing, confidence, GDP, jobs, inflation, and Nvidia earnings all hit in one week.
The outcome could decide whether September brings cuts or chaos.
(a thread)

On Monday, we get July New Home Sales data.
This report tracks how many contracts Americans signed for new single-family homes in a month, even if the house isn’t finished.
Think of it as the housing market’s pulse, it shows demand, affordability, and consumer confidence all in one number.
This report tracks how many contracts Americans signed for new single-family homes in a month, even if the house isn’t finished.
Think of it as the housing market’s pulse, it shows demand, affordability, and consumer confidence all in one number.
The last report wasn’t pretty.
627,000 homes sold barely better than May, but 6.6% fewer than last year.
Inventory climbed to its highest since 2007, nearly a 10-month supply. Prices slipped to $401,800, a sign that high mortgage rates are biting hard and buyers are hesitant.
627,000 homes sold barely better than May, but 6.6% fewer than last year.
Inventory climbed to its highest since 2007, nearly a 10-month supply. Prices slipped to $401,800, a sign that high mortgage rates are biting hard and buyers are hesitant.
If sales show strength, it suggests consumers are still willing to borrow and spend despite high rates
That boosts housing stocks, firms up the dollar, & keeps the Fed cautious on cuts
If sales sag, it highlights affordability stress pushing investors toward bonds and reviving talk of rate relief
That boosts housing stocks, firms up the dollar, & keeps the Fed cautious on cuts
If sales sag, it highlights affordability stress pushing investors toward bonds and reviving talk of rate relief
Tuesday starts with Durable Goods Orders for July.
These are long-lasting products like cars, appliances, and aircraft.
Orders measure how much businesses are investing and households are willing to spend on big-ticket items.
These are long-lasting products like cars, appliances, and aircraft.
Orders measure how much businesses are investing and households are willing to spend on big-ticket items.
June’s report showed a wild swing.
Headline orders fell 9.3% after a May surge, but most of that came from aircraft. Excluding transport, orders rose modestly.
Core capital goods business investment actually fell 0.7%, surprising markets.
Headline orders fell 9.3% after a May surge, but most of that came from aircraft. Excluding transport, orders rose modestly.
Core capital goods business investment actually fell 0.7%, surprising markets.
A strong number shows firms are still investing in equipment and machinery, reassuring investors about growth.
A weak print sparks concern about slowing business activity, feeding into bond rallies and dovish expectations.
A weak print sparks concern about slowing business activity, feeding into bond rallies and dovish expectations.
Later Tuesday, we also get August Consumer Confidence.
This survey asks households how they see the economy now and how they expect it to look six months from now.
Above 100 means expansion, while expectations below 80 often point to recession risk.
This survey asks households how they see the economy now and how they expect it to look six months from now.
Above 100 means expansion, while expectations below 80 often point to recession risk.
In July, the headline rose to 97.2, but expectations stayed under 80 for the sixth straight month.
Job availability fell to its lowest since 2021.
Inflation expectations eased slightly, but consumers clearly remain uneasy.
Job availability fell to its lowest since 2021.
Inflation expectations eased slightly, but consumers clearly remain uneasy.
If confidence improves, it reassures markets that spending will hold up, which supports equities and yields.
If it weakens, investors rotate into safer assets and start pressing harder for Fed easing.
If it weakens, investors rotate into safer assets and start pressing harder for Fed easing.
On Wednesday, the spotlight shifts to Nvidia earnings. The AI chipmaker has carried the stock market all year.
Its GPUs power data centers and AI models, and its valuation now rivals entire sectors.
Nvidia’s earnings move more than just its own stock, they can swing the entire S&P 500.
Its GPUs power data centers and AI models, and its valuation now rivals entire sectors.
Nvidia’s earnings move more than just its own stock, they can swing the entire S&P 500.
If AI demand looks unstoppable, it lifts tech and the broader market.
If guidance disappoints, it could spark a selloff across indexes, exposing just how dependent this rally has been on a handful of mega-cap names.
Nvidia’s print is the ultimate AI stress test.
If guidance disappoints, it could spark a selloff across indexes, exposing just how dependent this rally has been on a handful of mega-cap names.
Nvidia’s print is the ultimate AI stress test.
Also Wednesday: the EIA Crude Oil Inventories report.
It tracks weekly changes in U.S. commercial crude stockpiles (excluding the Strategic Reserve).
A big draw signals tighter supply, lifting oil prices and energy stocks. A surprise build points to weaker demand or rising supply.
It tracks weekly changes in U.S. commercial crude stockpiles (excluding the Strategic Reserve).
A big draw signals tighter supply, lifting oil prices and energy stocks. A surprise build points to weaker demand or rising supply.
Thursday brings Q2 GDP (second estimate). GDP measures the total value of goods and services produced in the economy.
The first estimate showed 3% growth, but much of that was due to falling imports, not stronger domestic demand
Final sales to private buyers grew just 1.2%, the weakest since 2022
The first estimate showed 3% growth, but much of that was due to falling imports, not stronger domestic demand
Final sales to private buyers grew just 1.2%, the weakest since 2022
The inflation side of the report was cooler: GDP prices up 1.9%, consumer inflation 2.1%, and core consumer inflation 2.5%.
On the surface, that looks like progress.
But the soft underlying demand shows growth isn’t as firm as the headline suggested.
On the surface, that looks like progress.
But the soft underlying demand shows growth isn’t as firm as the headline suggested.
Stronger revisions would reinforce resilience, boosting equities and yields.
Softer numbers would push bonds higher, weaken the dollar, and increase dovish pressure on the Fed.
Softer numbers would push bonds higher, weaken the dollar, and increase dovish pressure on the Fed.
Also Thursday, we get weekly jobless claims.
Initial claims show new unemployment filings.
Continued claims show how many people remain on benefits. Together, they’re one of the fastest-moving signals on the labor market.
Initial claims show new unemployment filings.
Continued claims show how many people remain on benefits. Together, they’re one of the fastest-moving signals on the labor market.
If claims rise, it points to weakening labor conditions, a red flag for the Fed.
If they stay low, it signals resilience and gives the Fed cover to hold rates longer.
If they stay low, it signals resilience and gives the Fed cover to hold rates longer.
Friday is the real showdown.
First: Michigan Consumer Sentiment (final August).
The preliminary print plunged to 58.6, the lowest in three months. Inflation expectations jumped, 1-year at 4.9% and 5-year at 3.9%.
First: Michigan Consumer Sentiment (final August).
The preliminary print plunged to 58.6, the lowest in three months. Inflation expectations jumped, 1-year at 4.9% and 5-year at 3.9%.
That combination falling sentiment with rising inflation fears creates stagflation worries, one of the toughest environments for markets.
Improvement would calm nerves, but higher expectations would spook both bonds and equities.
Improvement would calm nerves, but higher expectations would spook both bonds and equities.
Then comes the heavyweight: July PCE Inflation.
The Personal Consumption Expenditures Index tracks what households actually spend including things like employer health benefits. It’s the Fed’s preferred inflation gauge.
Core PCE strips out food and energy to show underlying trends.
The Personal Consumption Expenditures Index tracks what households actually spend including things like employer health benefits. It’s the Fed’s preferred inflation gauge.
Core PCE strips out food and energy to show underlying trends.
June showed headline inflation at 2.6% and core at 2.8%.
Both remain above target, with tariffs increasingly pushing prices higher.
That persistence is why PCE matters more than CPI, it’s the measure the Fed uses when setting policy.
Both remain above target, with tariffs increasingly pushing prices higher.
That persistence is why PCE matters more than CPI, it’s the measure the Fed uses when setting policy.
If PCE runs hot, expect yields and the dollar to climb while equities wobble.
A softer print would lift bonds, give stocks relief, and open the door to earlier rate cuts.
A softer print would lift bonds, give stocks relief, and open the door to earlier rate cuts.
So here’s the lineup:
• Monday = housing.
• Tuesday = durable goods + consumer confidence.
• Wednesday = oil + Nvidia.
• Thursday = GDP + jobless claims.
• Friday = PCE + sentiment.
Every release feeds into the same question, does the Fed cut soon, or stay put?
• Monday = housing.
• Tuesday = durable goods + consumer confidence.
• Wednesday = oil + Nvidia.
• Thursday = GDP + jobless claims.
• Friday = PCE + sentiment.
Every release feeds into the same question, does the Fed cut soon, or stay put?
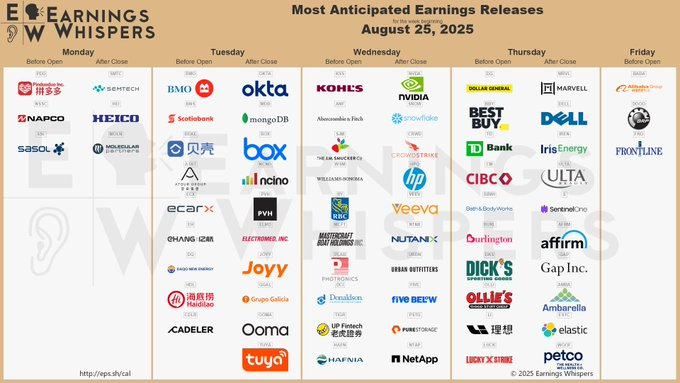
Beyond Nvidia, earnings will also color the story:
• Monday: Heico, NAPCO.
• Tuesday: Okta, Box, PVH, MongoDB.
• Wednesday: Nvidia, Kohl’s, HP, Veeva, NetApp, Nutanix, Five Below.
• Thursday: Dell, Best Buy, Dollar General, Ulta, Gap, Affirm, Dick’s, Ollie’s, Petco.
• Friday: Frontline.
• Monday: Heico, NAPCO.
• Tuesday: Okta, Box, PVH, MongoDB.
• Wednesday: Nvidia, Kohl’s, HP, Veeva, NetApp, Nutanix, Five Below.
• Thursday: Dell, Best Buy, Dollar General, Ulta, Gap, Affirm, Dick’s, Ollie’s, Petco.
• Friday: Frontline.
One weak report or earnings miss is noise but pile up soft consumer data, sticky inflation, and weak results, and markets wobble.
Flip it, strong housing, resilient growth, cooler inflation, and solid earnings and the “soft landing” story comes alive.
August rarely ends quietly.
Flip it, strong housing, resilient growth, cooler inflation, and solid earnings and the “soft landing” story comes alive.
August rarely ends quietly.
If you found these insights valuable: Sign up for my Weekly FREE newsletter! thestockmarket.news
I hope you've found this thread helpful.
Follow me @_Investinq for more.
Like/Repost the quote below if you can:
Follow me @_Investinq for more.
Like/Repost the quote below if you can:
https://x.com/_investinq/status/1959632904901865723?s=46
• • •
Missing some Tweet in this thread? You can try to
force a refresh