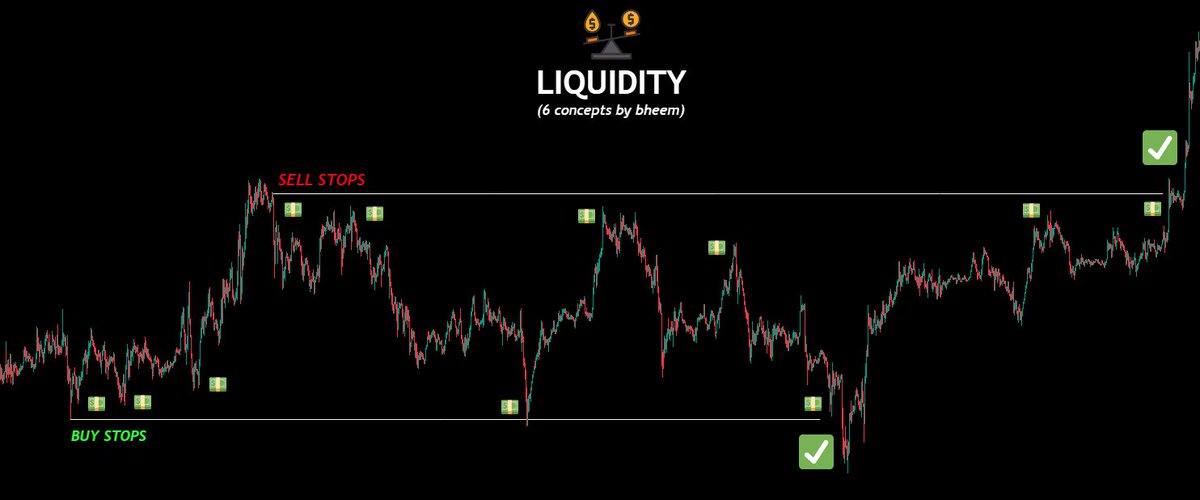
If you can’t identify the Liquidity- You will be the Exit Liquidity🩸
In this thread, you will learn about all 6 forms of liquidity without having to purchase a mentorship course from any influencer ever again🧵
In this thread, you will learn about all 6 forms of liquidity without having to purchase a mentorship course from any influencer ever again🧵
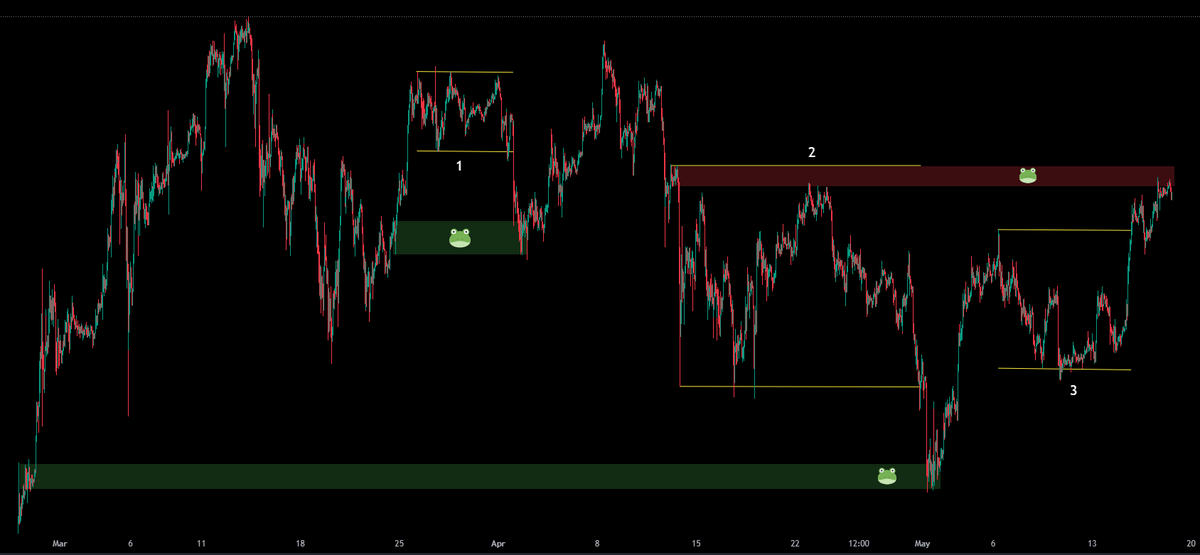
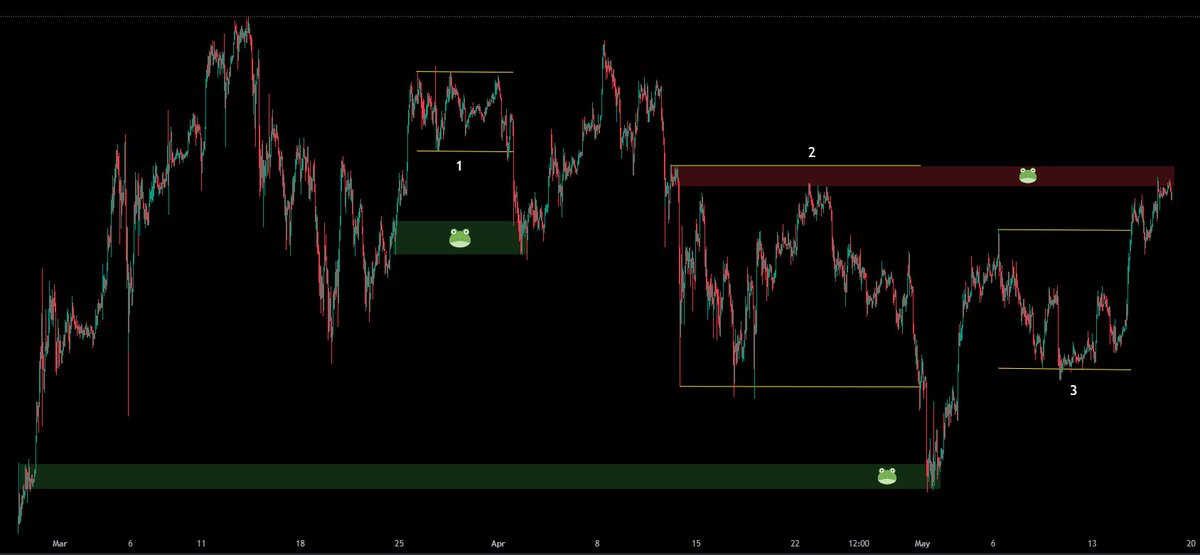
1. Range Bound Liquidity:
Understanding how price moves within and around trading ranges is key to making smart decisions and avoiding common mistakes. This concept, known as range-bound liquidity, helps you identify where other traders might be "puking" their positions, creating opportunities for those who wait patiently.
🧐 The Core Idea: What Is It?
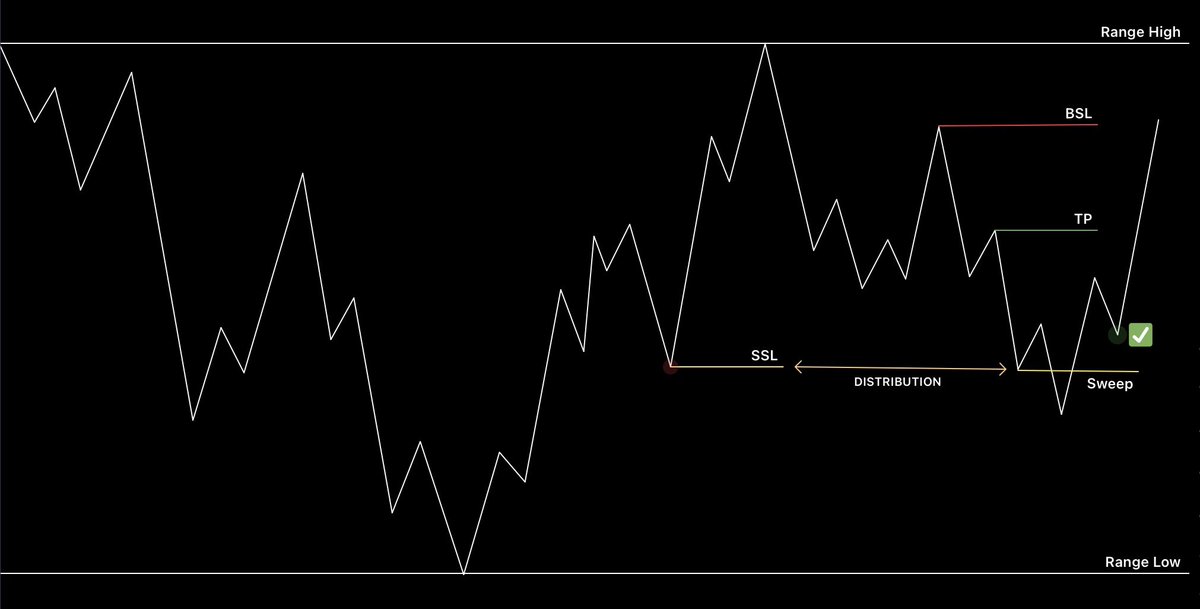
Imagine a price range, defined by a high and a low. Most traders see these clear levels and place their orders right there. We, however, want to do the opposite: we look for liquidity just outside the range's boundaries to "fade" or go against the immediate herd.
Why? Because these immediate, obvious levels are what we call "retail liquidity"—the easy-to-see targets that many traders chase. The real opportunity lies in the "latent" or hidden liquidity beyond these levels, which a patient trader can use to their advantage.
🎯 The Rule of Thumb: Patience Pays
A crucial principle to remember: before price makes a significant move in one direction, it will almost always sweep the liquidity above or below its current range pivots (the range high/low). This is a deliberate move to "trap" traders who enter too early.
Think of it this way: everyone sees the same thing. Everyone who rushes in gets stopped out when the price briefly moves against their intended direction. Your job is to wait for this predictable "liquidity sweep" and then enter the trade.
📉 Traps to Avoid: The Double Tap
History shows that if price "taps" or "raids" a pivot level more than twice, it's a signal that the initial move is likely to fail. This happens because the majority of traders who bet on that initial direction are getting stopped out, or "puking" their positions, into latent levels like Order Blocks, Demand, or Supply zones.
You have two choices here:
Passive Liquidity: Place a limit order into the "fade" (the move against the initial direction) and wait.
Active Liquidity: Wait for the price to reclaim the range pivot after the sweep. This is a much safer, more confident entry. By waiting for confirmation, you are entering with the new momentum, not against it.
👶 The "Developing Range" Problem
The third type of range I mentioned is a "developing range" that forms right next to a higher time frame (HTF) range. This is a common trap! When a new range "smooches" or overlaps with an existing one, it often creates a confusing, choppy environment where it's hard to establish a clear bias.
This is where most traders, including myself, get faked out and lose money. The best move here is to do nothing. Wait for a confirmed area of interest (POI) to form before taking any action.
💡 Putting It All Together: A Real Example
Consider the example I shared:
Price first swept the low because there was a lot of obvious, "visible" liquidity there.
Even if you missed that initial low, there was still an opportunity to enter on the continuation higher.
This is because the overall trend-based liquidity was still in place. The main trend was still up, and the sweep of the low was just a temporary hunt for liquidity before continuing the main move.
The lesson? Don't get fixated on catching the absolute low or high. By understanding the overall liquidity flow and the trend, you can still make substantial profit even if you miss the perfect entry. The key is to have a clear bias and wait for confirmation.
Understanding how price moves within and around trading ranges is key to making smart decisions and avoiding common mistakes. This concept, known as range-bound liquidity, helps you identify where other traders might be "puking" their positions, creating opportunities for those who wait patiently.
🧐 The Core Idea: What Is It?
Imagine a price range, defined by a high and a low. Most traders see these clear levels and place their orders right there. We, however, want to do the opposite: we look for liquidity just outside the range's boundaries to "fade" or go against the immediate herd.
Why? Because these immediate, obvious levels are what we call "retail liquidity"—the easy-to-see targets that many traders chase. The real opportunity lies in the "latent" or hidden liquidity beyond these levels, which a patient trader can use to their advantage.
🎯 The Rule of Thumb: Patience Pays
A crucial principle to remember: before price makes a significant move in one direction, it will almost always sweep the liquidity above or below its current range pivots (the range high/low). This is a deliberate move to "trap" traders who enter too early.
Think of it this way: everyone sees the same thing. Everyone who rushes in gets stopped out when the price briefly moves against their intended direction. Your job is to wait for this predictable "liquidity sweep" and then enter the trade.
📉 Traps to Avoid: The Double Tap
History shows that if price "taps" or "raids" a pivot level more than twice, it's a signal that the initial move is likely to fail. This happens because the majority of traders who bet on that initial direction are getting stopped out, or "puking" their positions, into latent levels like Order Blocks, Demand, or Supply zones.
You have two choices here:
Passive Liquidity: Place a limit order into the "fade" (the move against the initial direction) and wait.
Active Liquidity: Wait for the price to reclaim the range pivot after the sweep. This is a much safer, more confident entry. By waiting for confirmation, you are entering with the new momentum, not against it.
👶 The "Developing Range" Problem
The third type of range I mentioned is a "developing range" that forms right next to a higher time frame (HTF) range. This is a common trap! When a new range "smooches" or overlaps with an existing one, it often creates a confusing, choppy environment where it's hard to establish a clear bias.
This is where most traders, including myself, get faked out and lose money. The best move here is to do nothing. Wait for a confirmed area of interest (POI) to form before taking any action.
💡 Putting It All Together: A Real Example
Consider the example I shared:
Price first swept the low because there was a lot of obvious, "visible" liquidity there.
Even if you missed that initial low, there was still an opportunity to enter on the continuation higher.
This is because the overall trend-based liquidity was still in place. The main trend was still up, and the sweep of the low was just a temporary hunt for liquidity before continuing the main move.
The lesson? Don't get fixated on catching the absolute low or high. By understanding the overall liquidity flow and the trend, you can still make substantial profit even if you miss the perfect entry. The key is to have a clear bias and wait for confirmation.
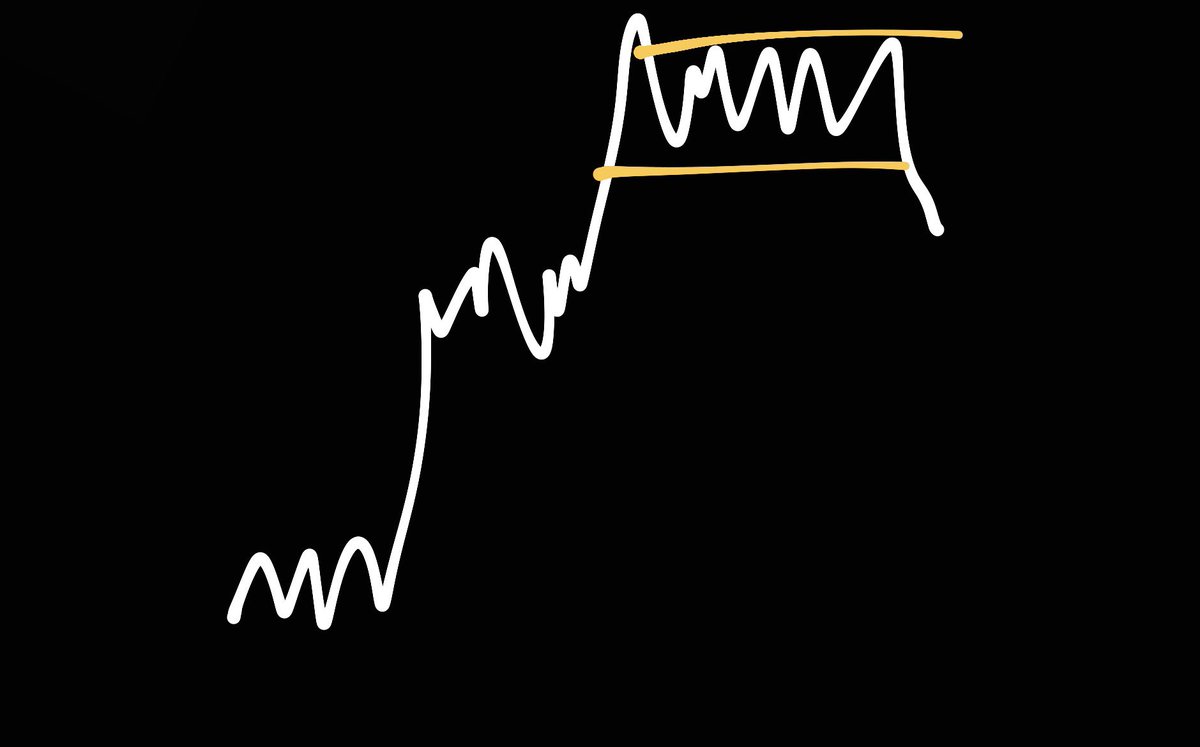
2. Trend Based Liquidity:
After understanding how price moves in a range, the next crucial step is to recognize how it behaves within a trend. This concept, known as trend-based liquidity, helps you find the perfect entry points when a market is moving consistently in one direction.
🧐 The Core Idea: Where's the Liquidity?
Even within a strong trend, price doesn't move in a straight line. It has periods of compression (sideways movement or shallow pullbacks) before its final expansion (a strong move in the direction of the trend). The key is to find the point where this compression is happening, as that's where the active liquidity is building up.
The easiest way to spot this is by looking for "vertical accumulation or distribution," which are periods where price consolidates before a big move.
📉 Example Breakdown: When and How to Enter
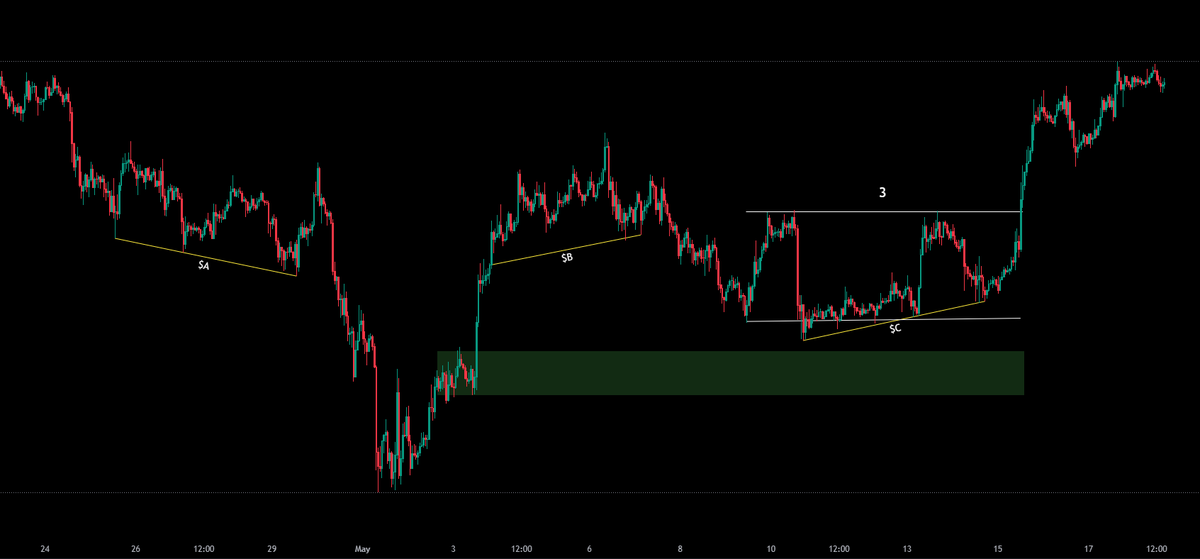
Let's break down the examples from my chart:
Scenario A ($A): In a downtrend, price finally "pukes" or makes a sharp move down, hitting a key level. This is often an order block from a much higher timeframe. Many traders who were shorting this trend from earlier levels get stopped out here, creating a flush of liquidity.
Scenario B ($B): In an uptrend, price has a pullback, but it doesn't retest the expected order block. This is a common trap! Many traders waiting for that perfect entry miss the move. What do you do? You wait for confluence.
Scenario C ($C): The wait continues. Price makes another move up, but you still don't get your ideal entry. This is when you combine your analysis with other factors. For example, if Range 3 (from our previous example) was a key level, you might wait for a retest of its high. When it sells off from there into a freshly created demand zone, you get a new opportunity.
💡 Putting It All Together: The Big Picture
The goal isn't to catch the absolute lowest price. It's to find a high-probability entry based on confluence. You had multiple chances to enter this trade, and even if you missed the first or second, you could still get in on the third.
The key takeaway is to stop focusing on exact percentage movements. The real win is achieving a good Risk-to-Reward Ratio (R). Whether you entered at the first, second, or third opportunity, the net result was the same: a profitable trade with a good R. Patience is your most valuable tool.
After understanding how price moves in a range, the next crucial step is to recognize how it behaves within a trend. This concept, known as trend-based liquidity, helps you find the perfect entry points when a market is moving consistently in one direction.
🧐 The Core Idea: Where's the Liquidity?
Even within a strong trend, price doesn't move in a straight line. It has periods of compression (sideways movement or shallow pullbacks) before its final expansion (a strong move in the direction of the trend). The key is to find the point where this compression is happening, as that's where the active liquidity is building up.
The easiest way to spot this is by looking for "vertical accumulation or distribution," which are periods where price consolidates before a big move.
📉 Example Breakdown: When and How to Enter
Let's break down the examples from my chart:
Scenario A ($A): In a downtrend, price finally "pukes" or makes a sharp move down, hitting a key level. This is often an order block from a much higher timeframe. Many traders who were shorting this trend from earlier levels get stopped out here, creating a flush of liquidity.
Scenario B ($B): In an uptrend, price has a pullback, but it doesn't retest the expected order block. This is a common trap! Many traders waiting for that perfect entry miss the move. What do you do? You wait for confluence.
Scenario C ($C): The wait continues. Price makes another move up, but you still don't get your ideal entry. This is when you combine your analysis with other factors. For example, if Range 3 (from our previous example) was a key level, you might wait for a retest of its high. When it sells off from there into a freshly created demand zone, you get a new opportunity.
💡 Putting It All Together: The Big Picture
The goal isn't to catch the absolute lowest price. It's to find a high-probability entry based on confluence. You had multiple chances to enter this trade, and even if you missed the first or second, you could still get in on the third.
The key takeaway is to stop focusing on exact percentage movements. The real win is achieving a good Risk-to-Reward Ratio (R). Whether you entered at the first, second, or third opportunity, the net result was the same: a profitable trade with a good R. Patience is your most valuable tool.

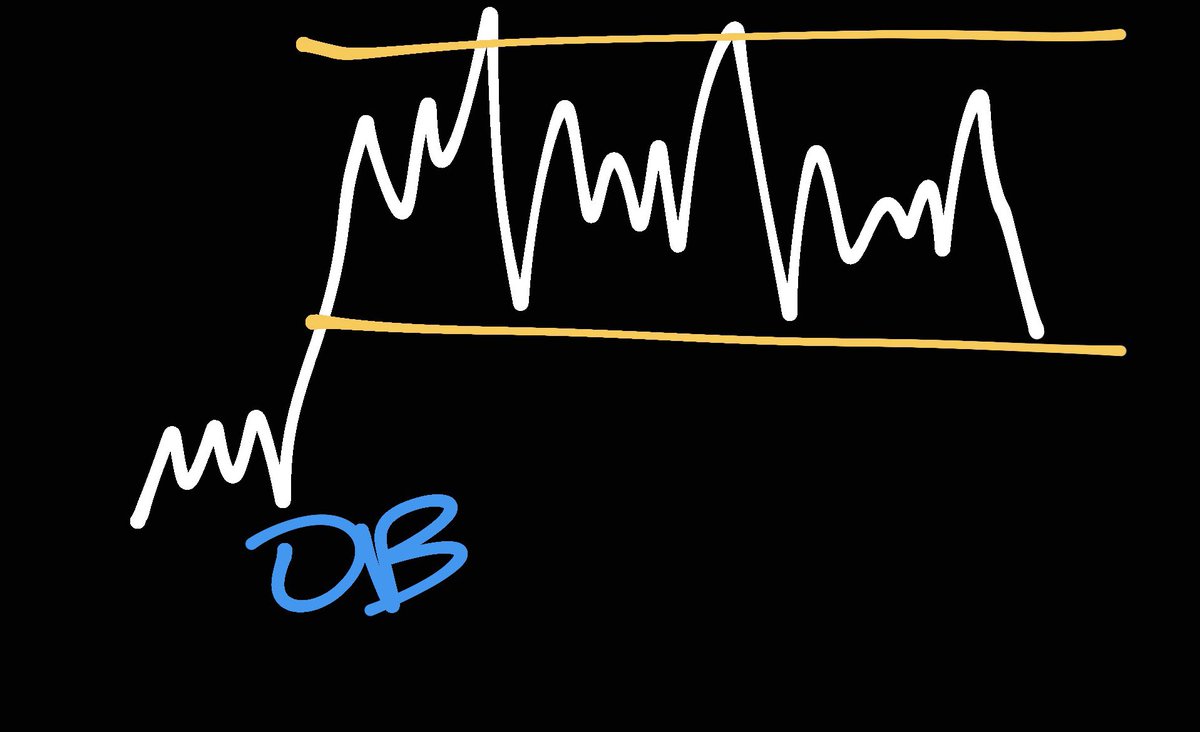
3. Internal & External Liquidity:
Before I get into the details, I want to clarify a couple of terms I use: Internal and External liquidity. Internal liquidity is everything that happens within a price range or trend, from the highest point to the lowest. This includes all the small price movements and minor zones I see on a lower timeframe. External liquidity, on the other hand, is what I look for outside the current range, like a major demand or supply zone. I like to think of it as the ultimate goal the market is trying to reach.
🧐 My Rule of Thumb: Trading the Extremes
In my experience, the market always travels from one extreme of External Liquidity to another. I find this rule incredibly useful for my trading. On my chart, I've marked an order block in green and a supply zone in red. In this case, price has already moved down and taken out the order block. My expectation is that over the next few days, it will continue to move up to take out the supply zone.
Because of this, I'll continue to trade with the overall trend. I'll stay long, but I'll start to be more cautious as price gets closer to that external supply.
💡 The Takeaway: How I Swing Trade
For me, this is the core of swing trading. I focus less on the noisy, internal liquidity and more on the major, external levels. I could try to scalp the hundreds of small moves inside a range, but I've found that it's safer and more profitable to focus on the bigger picture. Liquidity isn't just about where stop losses are; it's where the big money is being targeted. I follow that money and align my trades with the overall direction it's headed.

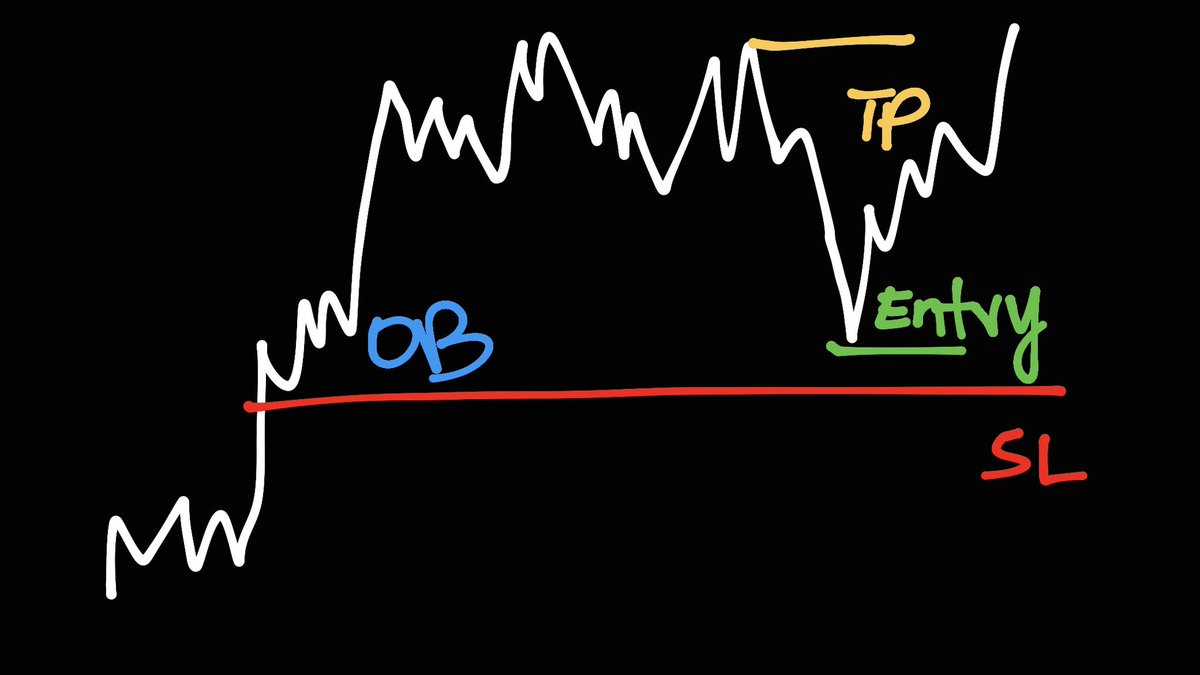
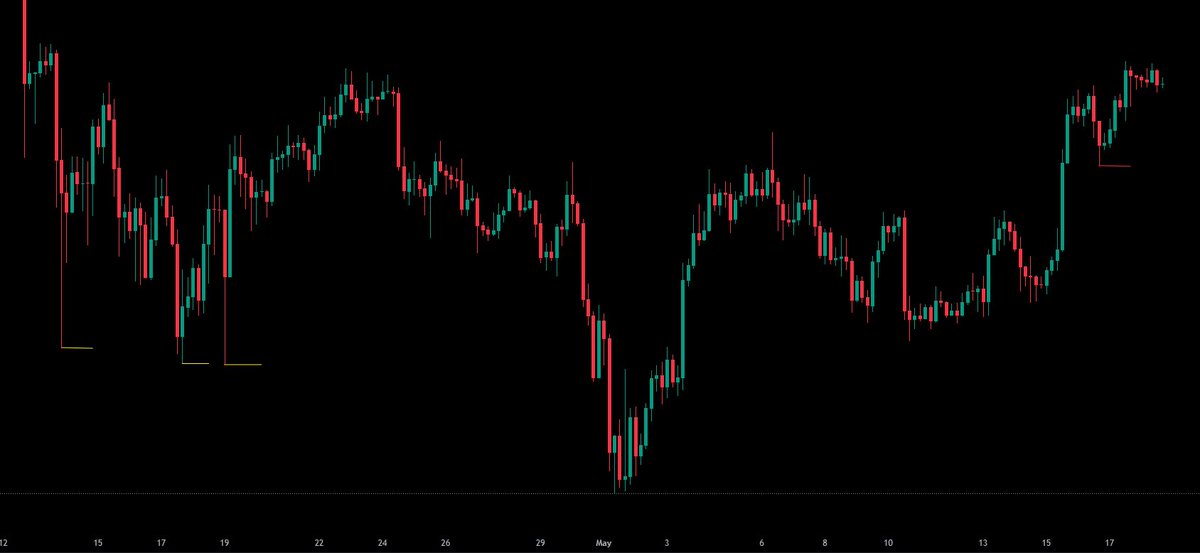
4. Sell Side Liquidity:
Most of you might already know this, but I'll give a quick overview. Sell Side Liquidity (SSL) is created at a low on the chart, usually with a prominent wick that extends below neighboring candles. This is where buy-stop and resting buy limit orders are waiting. I've found that this passive liquidity is then sought by larger players who want to enter the market. When they do, they "front-run" everyone else, and that passive liquidity becomes active liquidity as their orders are filled and price moves away.
🧐 My Example: The Traps I Saw
I looked closely at this recent price action. I saw that SSL was created three times to push the price up before everyone was finally trapped in that major dump. What I find most interesting is that this dump went on to sweep the very order block I've been discussing in my other threads. This really proves the point that if I can't identify the liquidity, I'm going to become the liquidity.
💡 The Takeaway: How I'll Trade It
The most recent SSL is the one I've marked with a red line. Now that I understand the concepts I've shared, I know when this level will likely be swept and how low the price might go. This gives me a clear plan: I can either place a limit order at a specific level below it or wait for the price to sweep that liquidity and then trade the reclaim. This is how I turn a potentially dangerous zone into a profitable opportunity.
5. Buy Side Liquidity:
Just the opposite of SSL.
Just the opposite of SSL.

6. Active, Passive and Latent Liquidity:
Before I wrap up this thread, let's talk about three final words I use to describe liquidity. I've used these concepts throughout my posts, and understanding them will help you see the market in a new way.
These words are all related to the order book, which is simply where orders are placed. By understanding them, I've found I don't need to read complex order flow to understand what the market is doing.
🟢 Active Liquidity
Active liquidity is inserted into the market suddenly, seemingly out of nowhere. This is what causes those rapid pumps and dumps we see on the charts. If you link this to my previous posts, you'll see that this is how SSL and BSL (Sell and Buy Side Liquidity) originate. It's immediate and aggressive.
⚪ Passive Liquidity
Passive liquidity is publicly available data, like the limit orders you see on a trading platform. I've found that entities use this to strategically push and pull the price between their spot and futures orders, which creates what we call discountsand premiums in the market. Passive liquidity is usually done with the intention to "fade" or go against a strong move.
⚫ Latent Liquidity
Latent liquidity is the hidden stuff. It's liquidity that isn't publicly visible but can become active at any moment. Think of it as a pool of orders that were once visible but have been pulled, waiting to be reactivated.
💡 My Example: Bringing It All Together
On my chart, I've used the same order block as our main example. I know from looking back that right after the first pump on February 28th, passive liquidity was created as traders placed limit orders to sell. Then, on March 5th, active liquidity pushed the price down, but because passive liquidity is designed to fade, it led to a further expansion upward after that.
After all that price action, the majority of traders likely pulled their orders from that passive level, thinking price would never return. But a few stubborn ones like me left our orders there. This is when that passive liquidity turned into latent liquidity.
Eventually, price returned to this hidden level, and those few of us who were waiting there were rewarded with a bounce. This shows how understanding these concepts helps me anticipate the market's next moves.

If you found these concepts helpful, I encourage you to bookmark this thread and practice them on your own charts.
I've also created a Discord community to share more valuable knowledge and connect with other traders. Feel free to join and ask any questions you have.
discord.gg/3UdEKFFh3h
I've also created a Discord community to share more valuable knowledge and connect with other traders. Feel free to join and ask any questions you have.
discord.gg/3UdEKFFh3h
• • •
Missing some Tweet in this thread? You can try to
force a refresh