🚨 Something strange is happening in China.
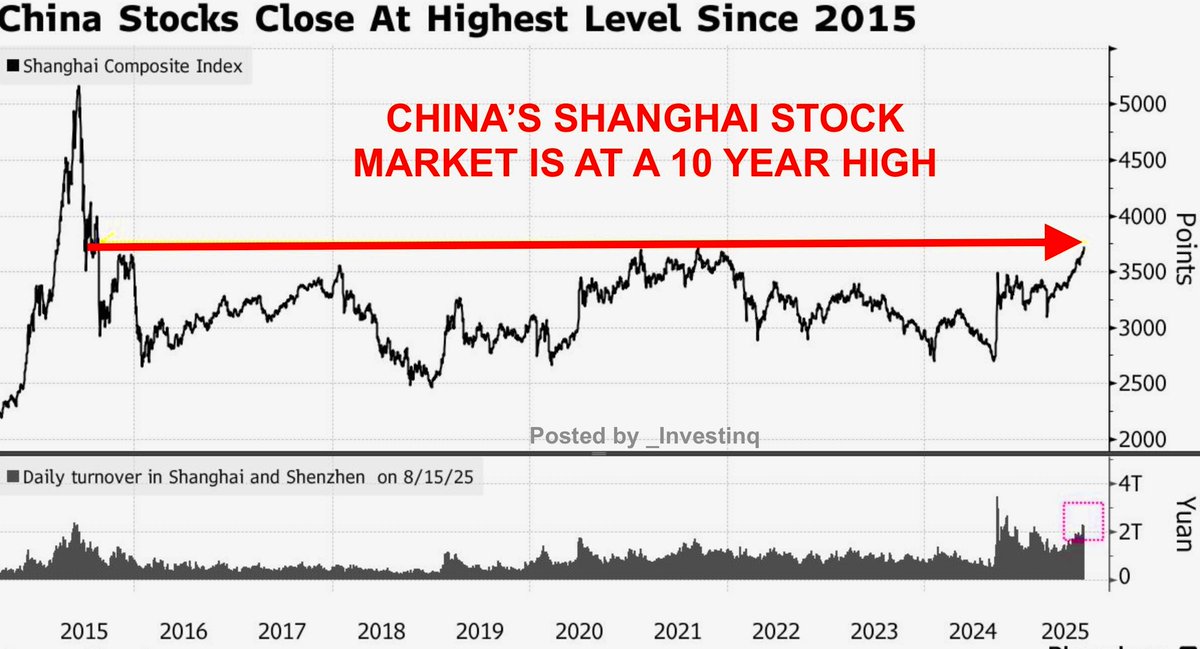
Stocks just hit a 10-year high while the economy slumps.
And the U.S. market is showing the exact same split.
(a thread)
Stocks just hit a 10-year high while the economy slumps.
And the U.S. market is showing the exact same split.
(a thread)
China’s economy looks weak.
Consumers are spending less. Home prices keep falling. Inflation is near zero. Inflation = how fast prices of goods and services rise. Near zero means demand is weak.
So why are stocks booming when the economy looks so fragile?
Consumers are spending less. Home prices keep falling. Inflation is near zero. Inflation = how fast prices of goods and services rise. Near zero means demand is weak.
So why are stocks booming when the economy looks so fragile?
The answer is liquidity. Liquidity = how much cash is available to invest.
With few safe or profitable alternatives, investors are flooding into stocks.
This “wall of money” is lifting prices higher even though company profits aren’t.
With few safe or profitable alternatives, investors are flooding into stocks.
This “wall of money” is lifting prices higher even though company profits aren’t.
This creates what Nomura, Japan’s biggest investment bank calls “irrational exuberance,” when investors buy stocks without caring about fundamentals.
TS Lombard, a global research firm, frames it as bulls vs bears.
Bulls bet on recovery. Bears see deeper pain. One side will lose.
TS Lombard, a global research firm, frames it as bulls vs bears.
Bulls bet on recovery. Bears see deeper pain. One side will lose.
The fundamentals look bad.
Consumer prices are flat. Producer prices (what factories charge) are down for the 34th straight month. The GDP deflator (a broad inflation gauge) is negative.
Translation: companies can’t raise prices. Profits are shrinking.
Consumer prices are flat. Producer prices (what factories charge) are down for the 34th straight month. The GDP deflator (a broad inflation gauge) is negative.
Translation: companies can’t raise prices. Profits are shrinking.
Earnings outlooks are falling too. Forward earnings for CSI 300 companies are down 2.5% from this year’s highs.
CSI 300 = China’s main stock index of large companies.
So analysts expect profits to decline… yet stocks keep climbing. That’s a red flag.
CSI 300 = China’s main stock index of large companies.
So analysts expect profits to decline… yet stocks keep climbing. That’s a red flag.
Policy adds another twist.
In 2015, Beijing unleashed massive stimulus cheap credit, government spending, and easy money. Stocks skyrocketed but when regulators cracked down on risk, the market collapsed.
Today leaders are more cautious but bubbles don’t need much fuel.
In 2015, Beijing unleashed massive stimulus cheap credit, government spending, and easy money. Stocks skyrocketed but when regulators cracked down on risk, the market collapsed.
Today leaders are more cautious but bubbles don’t need much fuel.
The biggest warning sign? Margin debt.
Margin debt = money borrowed to buy stocks. It magnifies gains when stocks rise but causes panic selling when they fall.
Today margin debt is 2.1 trillion yuan. The 2015 peak was 2.3 trillion. That’s dangerously close.
Margin debt = money borrowed to buy stocks. It magnifies gains when stocks rise but causes panic selling when they fall.
Today margin debt is 2.1 trillion yuan. The 2015 peak was 2.3 trillion. That’s dangerously close.
In 2015, margin debt sent stocks vertical. When regulators stepped in, the market imploded.
Billions in wealth were wiped out. Global markets shook.
Today’s rally looks eerily familiar. The only difference? The hype is now around AI and chips not “Internet Plus.”
Billions in wealth were wiped out. Global markets shook.
Today’s rally looks eerily familiar. The only difference? The hype is now around AI and chips not “Internet Plus.”
Bulls argue this time is different. China has stronger tech companies, larger deposit bases, and better rescue tools.
And the rally has spread beyond chipmakers.
Momentum looks broad-based but the big question: how long can it last?
And the rally has spread beyond chipmakers.
Momentum looks broad-based but the big question: how long can it last?
Deflation is the wildcard.
Deflation = when prices fall over time. Sounds good for shoppers, but it’s deadly for companies.
Falling prices crush profits, make debts harder to pay, and discourage spending. If deflation lingers, no bull market can survive.
Deflation = when prices fall over time. Sounds good for shoppers, but it’s deadly for companies.
Falling prices crush profits, make debts harder to pay, and discourage spending. If deflation lingers, no bull market can survive.
Smart money is cautious.
RBC’s Jasmine Duan avoids sectors hit hardest by deflation and brutal competition.
Translation: not every stock is safe. Some sectors could collapse under shrinking margins and price wars. Even in a bull run, selectivity matters.
RBC’s Jasmine Duan avoids sectors hit hardest by deflation and brutal competition.
Translation: not every stock is safe. Some sectors could collapse under shrinking margins and price wars. Even in a bull run, selectivity matters.
Psychology is fueling much of this rally.
Hao Hong says “animal spirits” investor excitement and risk-taking are back but Hebe Chen warns China’s bull run is a “mystery box.”
It works while investors believe… but when faith fades, it unravels fast.
Hao Hong says “animal spirits” investor excitement and risk-taking are back but Hebe Chen warns China’s bull run is a “mystery box.”
It works while investors believe… but when faith fades, it unravels fast.
At its core, China’s bull run is a paradox.
A weak economy. A roaring market. Either fundamentals improve and justify the rally or stocks crash back to reality.
One side is wrong. And when the truth comes out, the impact won’t stay in China.
A weak economy. A roaring market. Either fundamentals improve and justify the rally or stocks crash back to reality.
One side is wrong. And when the truth comes out, the impact won’t stay in China.
Now, let’s zoom out.
Because this isn’t just a China story.
The U.S. is showing the same disconnect: a slowing economy and a soaring stock market.
Because this isn’t just a China story.
The U.S. is showing the same disconnect: a slowing economy and a soaring stock market.
Look at the U.S. economy: growth is slowing, job data is softening, consumers are stretched.
Yet Wall Street keeps hitting highs.
Why? The same forces: liquidity, hype, and concentration in a few mega-stocks.
Yet Wall Street keeps hitting highs.
Why? The same forces: liquidity, hype, and concentration in a few mega-stocks.
Big Tech is carrying the U.S. market.
Nvidia, Apple, Microsoft, Amazon, Alphabet—just a handful of firms are driving the S&P 500 higher.
Outside tech, earnings are much weaker. That’s a fragile foundation just like China’s chip-led rally.
Nvidia, Apple, Microsoft, Amazon, Alphabet—just a handful of firms are driving the S&P 500 higher.
Outside tech, earnings are much weaker. That’s a fragile foundation just like China’s chip-led rally.
This is the paradox: weak economy, strong stocks.
In China, investors pile into equities because alternatives look bleak. In the U.S., investors chase Big Tech because it’s seen as the only growth story.
Two different markets. The same psychology.
In China, investors pile into equities because alternatives look bleak. In the U.S., investors chase Big Tech because it’s seen as the only growth story.
Two different markets. The same psychology.
Margin debt connects both stories.
In the U.S., margin debt surged in 2021–22, fueling the boom before the Fed’s hikes caused a correction.
China is now repeating that cycle with debt levels already back near the 2015 danger zone.
In the U.S., margin debt surged in 2021–22, fueling the boom before the Fed’s hikes caused a correction.
China is now repeating that cycle with debt levels already back near the 2015 danger zone.
Policy risk connects them too. In China, investors bet Beijing will eventually bail them out.
In the U.S., markets bet the Fed will cut rates if things get shaky.
Both rallies are built on faith in policymakers, not fundamentals.
In the U.S., markets bet the Fed will cut rates if things get shaky.
Both rallies are built on faith in policymakers, not fundamentals.
And liquidity is global.
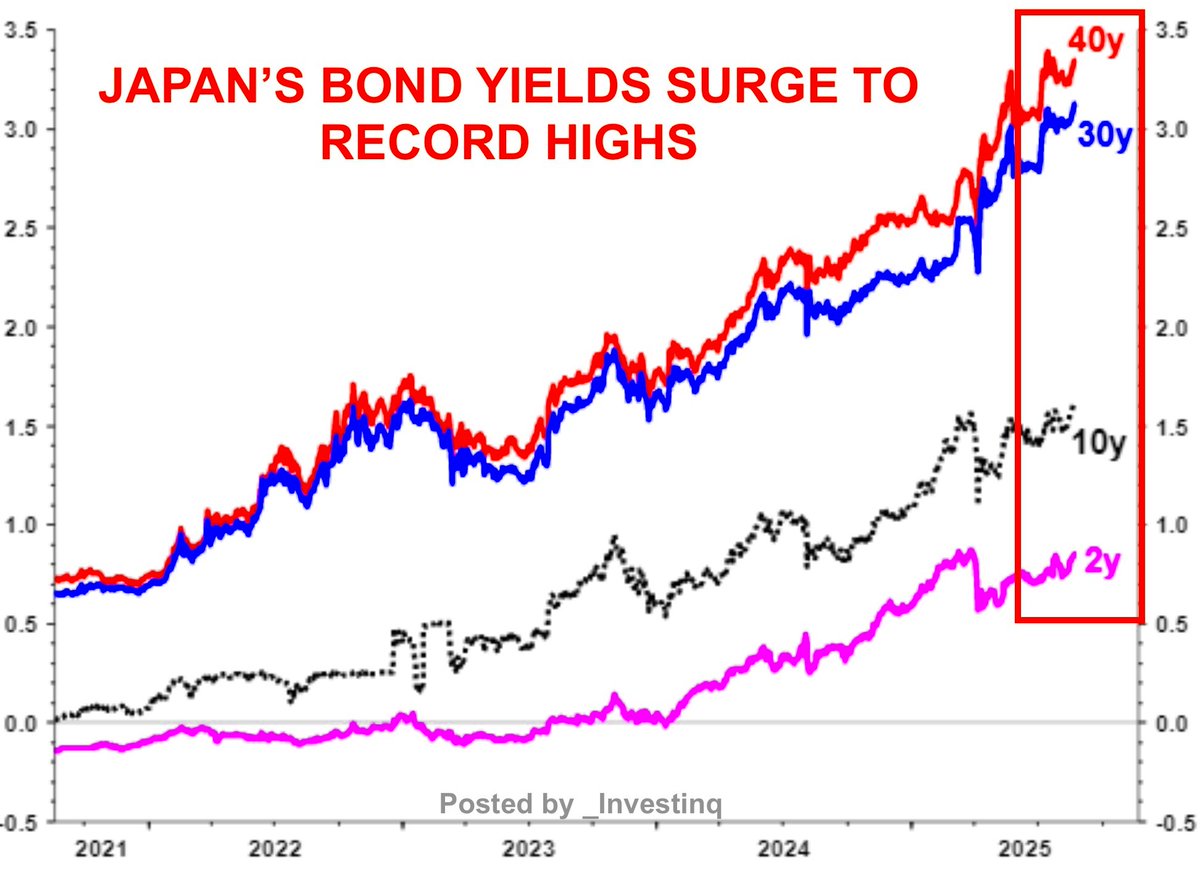
Money flowing into Chinese stocks is money not flowing into U.S. Treasuries.
That matters because the U.S. must refinance trillions in debt. If foreign demand weakens, yields rise raising borrowing costs for everyone.
Money flowing into Chinese stocks is money not flowing into U.S. Treasuries.
That matters because the U.S. must refinance trillions in debt. If foreign demand weakens, yields rise raising borrowing costs for everyone.
Deflation is another global link.
If China exports deflation cheaper goods, lower import prices, it pressures the Fed’s inflation battle.
That may sound good for shoppers, but it complicates policy and can hurt U.S. growth.
If China exports deflation cheaper goods, lower import prices, it pressures the Fed’s inflation battle.
That may sound good for shoppers, but it complicates policy and can hurt U.S. growth.
Tariffs tie them together as well.
Trump’s tariffs hurt China’s exports but they also raise costs for U.S. importers and consumers.
The result? Both economies take damage, while stock markets float higher on liquidity.
Trump’s tariffs hurt China’s exports but they also raise costs for U.S. importers and consumers.
The result? Both economies take damage, while stock markets float higher on liquidity.
The parallels to 2015 are chilling.
Back then, China’s stock boom turned into a bust that rocked global markets. The Fed even delayed rate hikes.
Today, the same ingredients margin debt, tech hype, policy bets are back on the table.
Back then, China’s stock boom turned into a bust that rocked global markets. The Fed even delayed rate hikes.
Today, the same ingredients margin debt, tech hype, policy bets are back on the table.
Both China and the U.S. are running on the same fuel: liquidity, leverage, and animal spirits.
The economies are weak, but stocks are soaring. History says this gap doesn’t last forever.
When it closes, the fallout will be global.
The economies are weak, but stocks are soaring. History says this gap doesn’t last forever.
When it closes, the fallout will be global.
If you found these insights valuable: Sign up for my Weekly FREE newsletter! thestockmarket.news
I hope you've found this thread helpful.
Follow me @_Investinq for more.
Like/Repost the quote below if you can:
Follow me @_Investinq for more.
Like/Repost the quote below if you can:
https://x.com/_investinq/status/1960081539686977674?s=46
• • •
Missing some Tweet in this thread? You can try to
force a refresh