Stoic Profile picture
Aug 26 4 tweets 2 min read Read on X
Shifting Value & Value Area Range

Not rocket science but something to look for when it comes to $BTC slowing down on a sell-off and attempting to spot a break in one sided momentum:

1. consecutive days with value shifting lower (little to no over lap) into a few tight sessions sideways.

2. wide days followed by a tighter value area range - observe participation at lows.

ideally trapped sellers can lead to a temporary bounce - if temporary bounce occurs observe buying aggression followed by passive behavior.

i.e. is there follow through on the bounce? is aggression stepping in higher? are dips being cushioned through passive buying gradually shifting higher?

btw a break in the trend could just be a breather for continuation in the same direction but this is the first sign to pay attention to what session value looks like in the succeeding days.

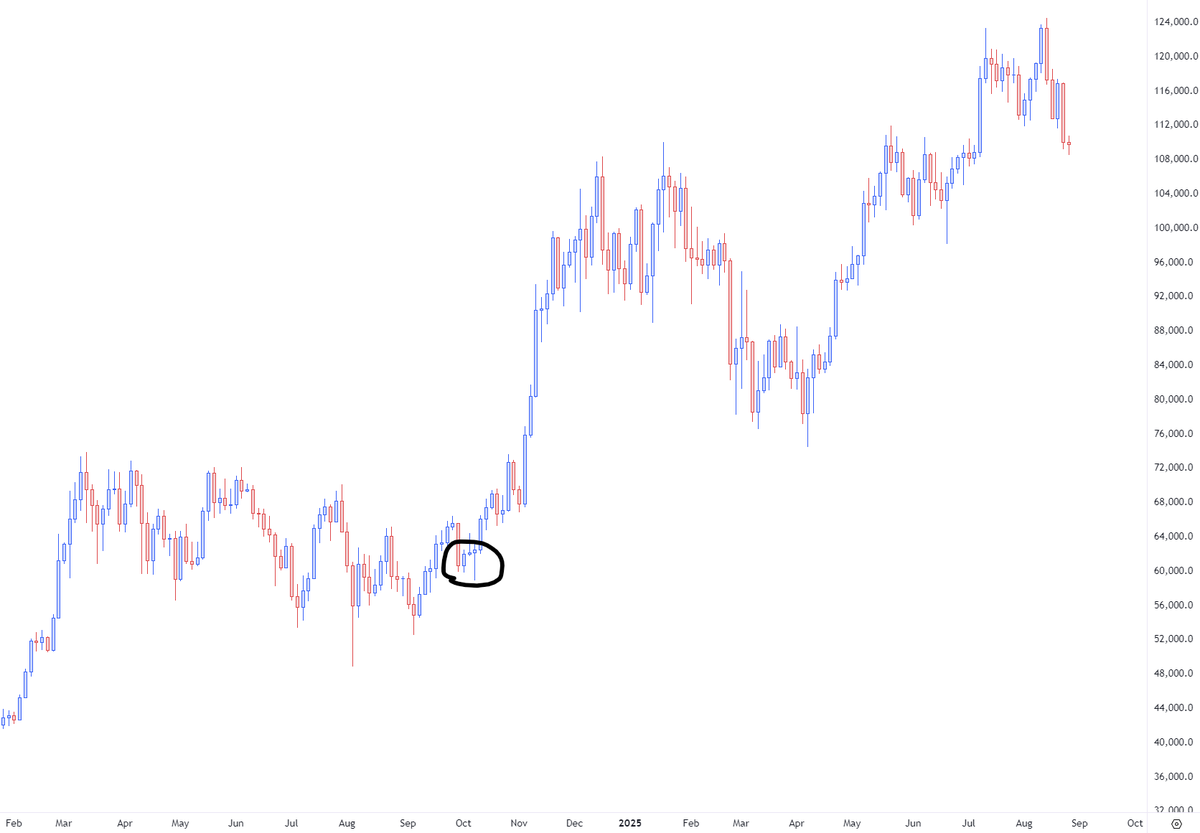
If action starting to slowdown into a key contextual area - pay more attention (additional example below).Image
the quoted example happened to be a major turning point (this wasn't forecasted at the time but just showing an example that I mentioned at the time). Image
Image
few.

• • •

Missing some Tweet in this thread? You can try to force a refresh
 

Keep Current with Stoic

Stoic Profile picture

Stay in touch and get notified when new unrolls are available from this author!

Read all threads

This Thread may be Removed Anytime!

PDF

Twitter may remove this content at anytime! Save it as PDF for later use!

Try unrolling a thread yourself!

how to unroll video
  1. Follow @ThreadReaderApp to mention us!

  2. From a Twitter thread mention us with a keyword "unroll"
@threadreaderapp unroll

Practice here first or read more on our help page!

More from @Stoiiic

Aug 25
Stop Runs SimplifiedImage
2. Weight Building - Spring Compressing Image
3. Initial Trigger - Spring Releasing Image
Read 8 tweets
Aug 19
“… time regulates price opportunity…” – Dalton

TPO (time price opportunity) 101
a detailed thread-:

> what are the f*ck are the tetris looking charts?

> why consider using time-based distributions?

> anomalies - what they mean and potential use

> compositesImage
Before we get to TPO- Auction Market Theory in a Nutshell Image
Before we get to TPO- Point of Control Image
Read 13 tweets
May 19
$BTC Detailed Overview

Daily

> monthly profile - Jan point of control - ~105 unable to reclaim + multiple rejections so far.

> imbalance (untested conviction) between ~97-100.

> to keep it simple, 105 has remained a key area to flip to rotate towards ATH. However, repeated sell pressure + spot asks stacking every time price approaches this area indicating this has remained a premium for participants thus far. i.e. significant aggression required for turnover.

> note previous balance established here with value between 101 and 93. if acceptance back inside this expecting some reflexivity to the downside (this posture is aided by the aggressive positioning on the way up which lends well to unraveling).

TPO

> 10 day composite bracketing value b/w ~104 and 102.6 with breakout vwap providing reactions thus far.

> price currently trading into low side of composite value and discretionary vwap once again.

> on ltf (1 min), looks like perps are attempting to get aggressive while there is continued spot selling pressure currently.

> look for this general area for continued weakness or ltf bounce (need spot follow through for another attempt at rotating higher).

$BTC Spot

> 2.5% spot depth tells the story of 105+ remaining expensive (ask side skew moving to 100+ Ms in stacking when price approaches this area).

> currently slightly skewed towards the bid side - ~70Ms.

TLDR:

> 105 - key pivot for continuation to ATH - continued sell pressure above thus far.

> low to mid 102s aligned with balance value + breakout vwap (trading here currently).

> imbalance under here = potential reflexivity to the down-side with aggressive positioning established on the way up.

> 100 is a major milestone for $BTC so spending a lot of time under this area = sign to remain cautious and be flexible with posture.Image
Image
Image
tldr - im tired boss. price rugging with haste as I'm typing out the update and having to modify lol

anyway hope this helps.
Image
Read 6 tweets
Mar 7
“… time regulates price opportunity…” – Dalton

Everything TPO (time price opportunity)-
a detailed thread

> what are the tetris looking charts?
> why use time-based distributions?
> anomalies - what they mean and potential use
> composites
etc.Image
> how does time fit into applied auction market theory?
> what is tpo? (click on thread)
> what are potential benefits of incorporating tpo?

Image
TPO on TradingView Image
Read 10 tweets
Feb 24
$BTC Detailed Outlook

> time-based composite (Feb 2nd - current) value bracketed b/w 98.35 & 95.45.

> rotational regime continues w/ participants confirming price to be at a discount below & premium above value.Image
Looking at the last 6 sessions offered a rotation from the low to high, high to low of the established value.

recent poor low cleaned up with an ltf bounce (current).

to the upside, note naked vpoc left behind on the Friday sell-off (+ledge = resistance) at ~98.1. Image
passive spot continuing to quote price b/w low to mid 90s on the low side & high 90s to 100 on the high side. Image
Read 6 tweets
Feb 20
Range Trading & Value (Part 2) - 🧵
Auction Market Theory + Flow

Part 2 covers practical frameworks including examples & discussion for trading in a range.

Rotational regimes are great for trading if you are patient and know what you're looking for.

Here's how that can look:Image
In a range-bound environment the question I'm looking to answer when price navigates towards extremes of value established in a ranging environment:

is the advertised discount or premium still considered a discount or premium by participants once price moves towards & away from extremes of value?

can deploy a two-pronged approach to attempt to answer this question:

1. passive flow
2. aggressive flowImage
1. Passive Flow

What does passive flow mean?
Why consider looking at aggregate spot behavior?
A recent $BTC example Image
Read 7 tweets

Did Thread Reader help you today?

Support us! We are indie developers!


This site is made by just two indie developers on a laptop doing marketing, support and development! Read more about the story.

Become a Premium Member ($3/month or $30/year) and get exclusive features!

Become Premium

Don't want to be a Premium member but still want to support us?

Make a small donation by buying us coffee ($5) or help with server cost ($10)

Donate via Paypal

Or Donate anonymously using crypto!

Ethereum

0xfe58350B80634f60Fa6Dc149a72b4DFbc17D341E copy

Bitcoin

3ATGMxNzCUFzxpMCHL5sWSt4DVtS8UqXpi copy

Thank you for your support!

Follow Us!

:(