Logistic Regression is the most important foundational algorithm in Classification Modeling.
In 2 minutes, I'll crush your confusion.
Let's dive in:
In 2 minutes, I'll crush your confusion.
Let's dive in:

1. Logistic regression is a statistical method used for analyzing a dataset in which there are one or more independent variables that determine a binary outcome (in which there are only two possible outcomes). This is commonly called a binary classification problem.
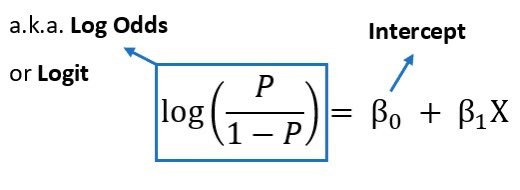
2. The Logit (Log-Odds):
The formula estimates the log-odds or logit. The right-hand side is the same as the form for linear regression. But the left-hand side is the logit function, which is the natural log of the odds ratio. The logit function is what distinguishes logistic regression from other types of regression.
The formula estimates the log-odds or logit. The right-hand side is the same as the form for linear regression. But the left-hand side is the logit function, which is the natural log of the odds ratio. The logit function is what distinguishes logistic regression from other types of regression.
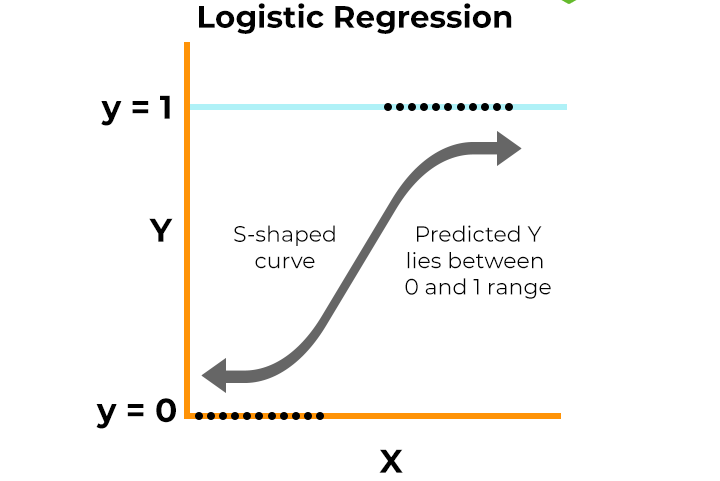
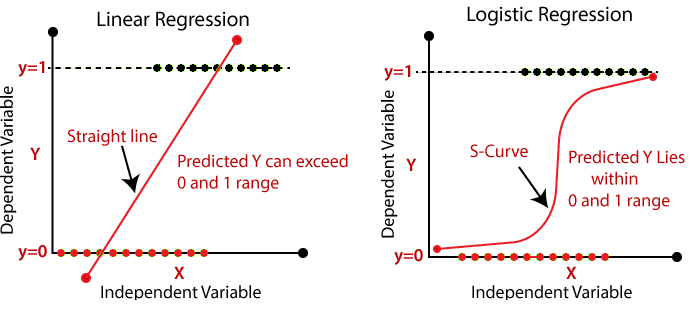
3. The S-Curve:
Logistic regression uses a sigmoid (or logistic) function to model the data. This function maps any real-valued number into a value between 0 and 1, making it suitable for a probability estimation. This is where the S-curve shape comes in.
Logistic regression uses a sigmoid (or logistic) function to model the data. This function maps any real-valued number into a value between 0 and 1, making it suitable for a probability estimation. This is where the S-curve shape comes in.
4. Why not Linear Regression?
The shape of the S-curve often fits the binary outcome better than a linear regression. Linear regression assumes the relationship is linear, which often does not hold for binary outcomes, where the relationship between the independent variables and the probability of the outcome is typically not linear but sigmoidal (S-shaped).
The shape of the S-curve often fits the binary outcome better than a linear regression. Linear regression assumes the relationship is linear, which often does not hold for binary outcomes, where the relationship between the independent variables and the probability of the outcome is typically not linear but sigmoidal (S-shaped).
5. Coefficient Estimation:
Like linear regression, logistic regression calculates coefficients for each independent variable. However, these coefficients are in the log-odds scale.
Like linear regression, logistic regression calculates coefficients for each independent variable. However, these coefficients are in the log-odds scale.
6. Coefficient Interpretation (Log-Odds to Odds):
Exponentiating a coefficient converts it from log odds to odds. For example, if a coefficient is 0.5, the odds ratio is exp(0.5), which is approximately 1.65. This means that with a one-unit increase in the predictor, the odds of the outcome increase by a factor of 1.65.
Exponentiating a coefficient converts it from log odds to odds. For example, if a coefficient is 0.5, the odds ratio is exp(0.5), which is approximately 1.65. This means that with a one-unit increase in the predictor, the odds of the outcome increase by a factor of 1.65.
Want to become a Generative AI Data Scientist in 2025 ($200,000 career)?
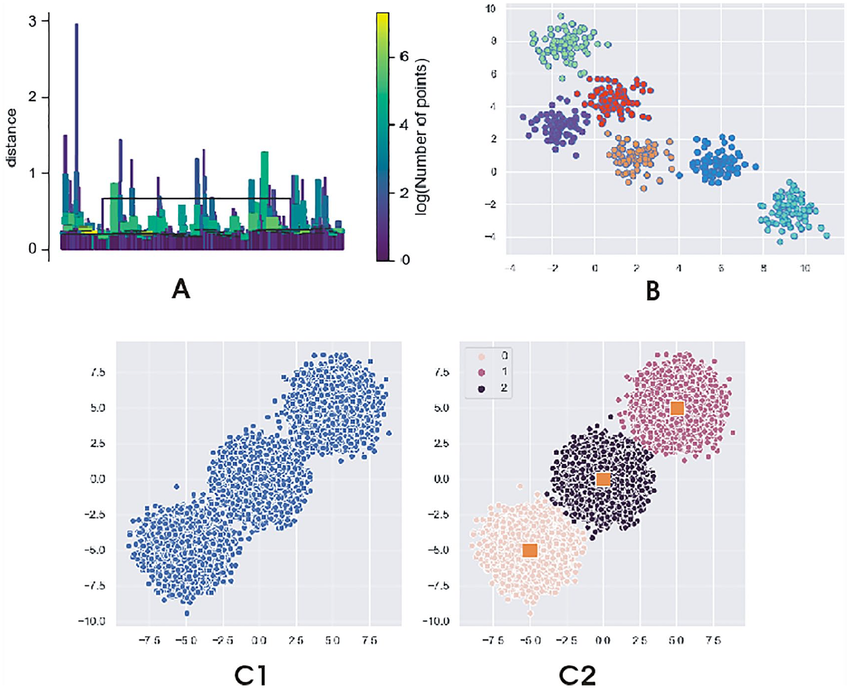
On Wednesday, Sept 3rd, I'm sharing one of my best AI Projects: How I built an AI Customer Segmentation Agent with Python
Register here (limit 500 seats): learn.business-science.io/ai-register
On Wednesday, Sept 3rd, I'm sharing one of my best AI Projects: How I built an AI Customer Segmentation Agent with Python
Register here (limit 500 seats): learn.business-science.io/ai-register
That's a wrap! Over the next 24 days, I'm sharing the 24 concepts that helped me become an AI data scientist.
If you enjoyed this thread:
1. Follow me @mdancho84 for more of these
2. RT the tweet below to share this thread with your audience
If you enjoyed this thread:
1. Follow me @mdancho84 for more of these
2. RT the tweet below to share this thread with your audience
https://twitter.com/815555071517872128/status/1960666950633169067
• • •
Missing some Tweet in this thread? You can try to
force a refresh