🚨USA - your babies are dying.
This is a professional deep dive into the official data.
It explains the alarming numbers of deaths of under 1 year olds.
It’s time the authorities took notice and they won’t unless you make them.
These babies did NOT need to die 🚨
This is a professional deep dive into the official data.
It explains the alarming numbers of deaths of under 1 year olds.
It’s time the authorities took notice and they won’t unless you make them.
These babies did NOT need to die 🚨
The green dots show the annual mortality rate for babies under 1 year old in USA each year.
These are too high in the last three years ('21-'23).
People draw different baselines to claim these deaths can be ignored but I will show you why they cannot be.
These are too high in the last three years ('21-'23).
People draw different baselines to claim these deaths can be ignored but I will show you why they cannot be.

Data from '24 and '25 are incomplete but we can take a closer look at when the deaths increased.
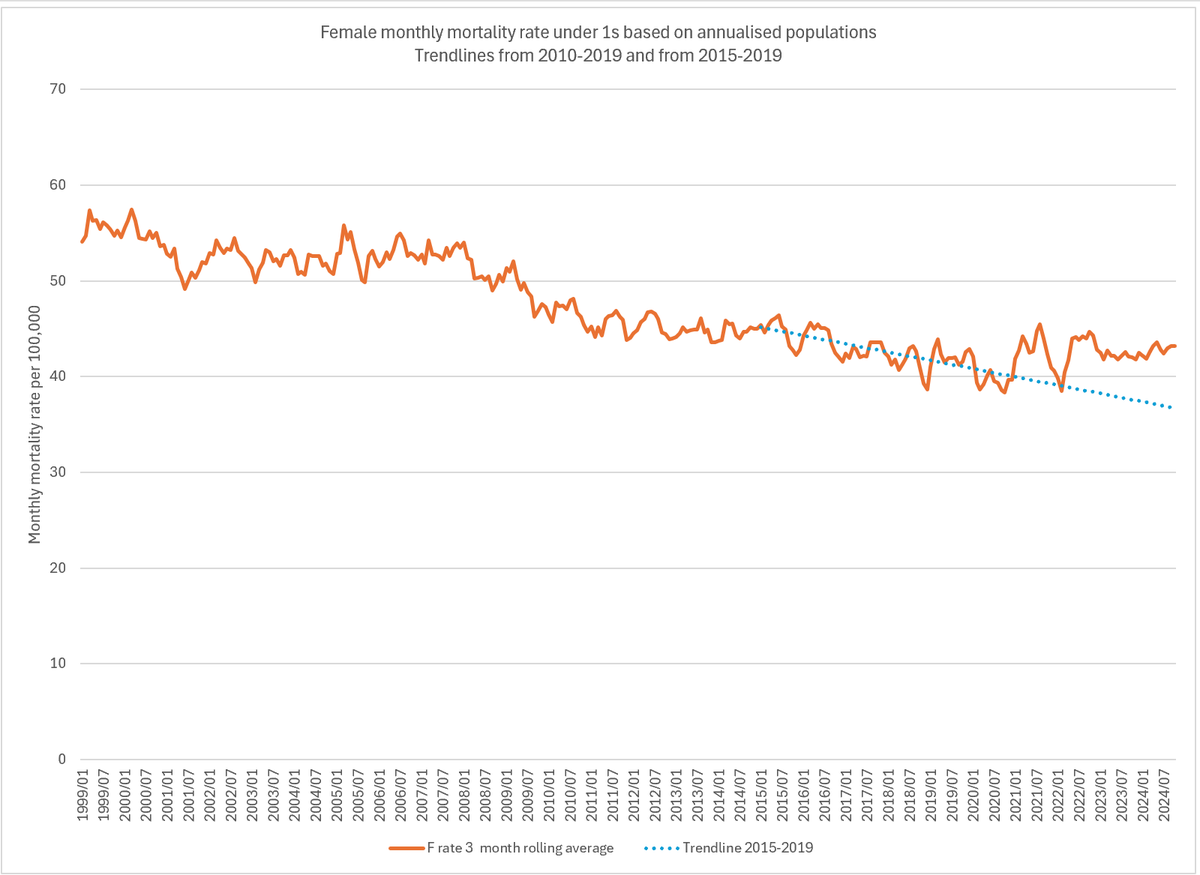
Here are deaths in US baby girls.
Nothing happens from March '20 to March '21. From April '21 the babies start dying.
There is a winter reprieve in '21-'22 then it returns.
Here are deaths in US baby girls.
Nothing happens from March '20 to March '21. From April '21 the babies start dying.
There is a winter reprieve in '21-'22 then it returns.
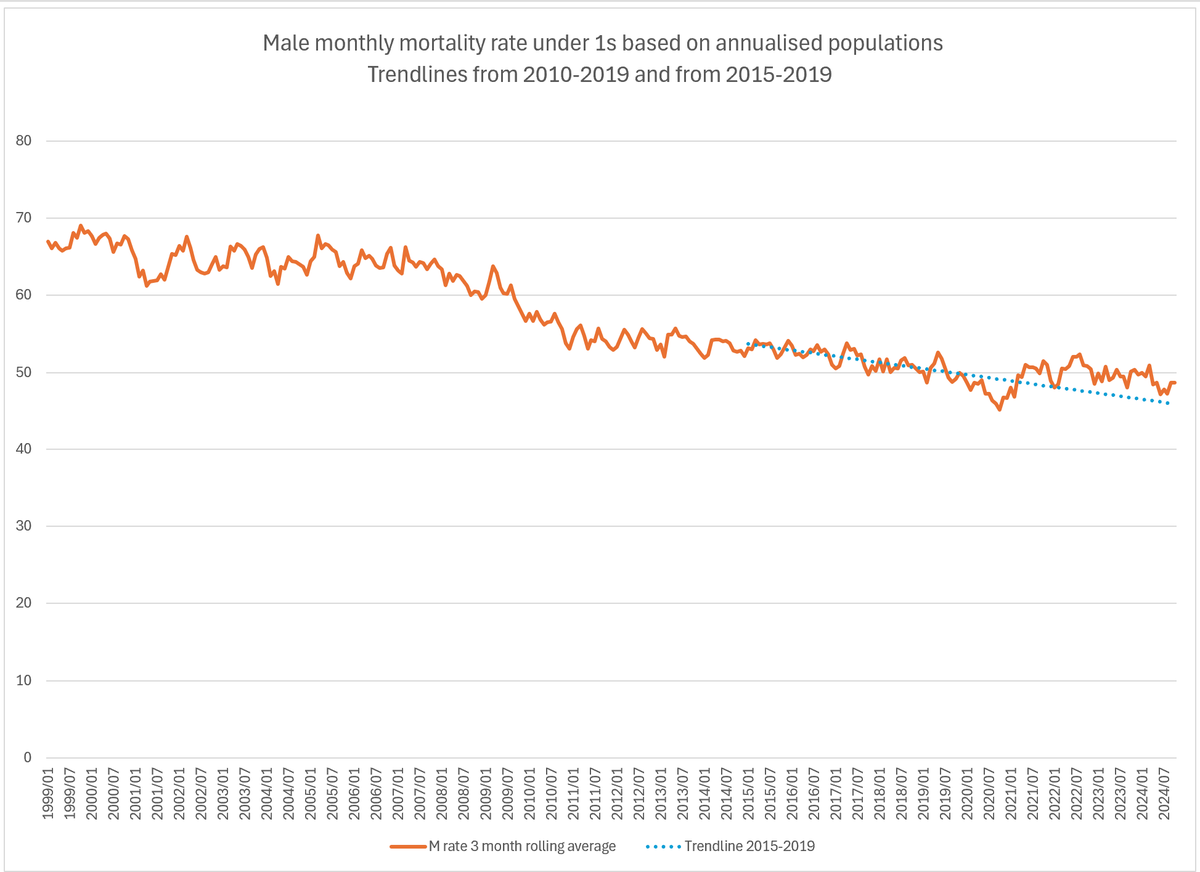
Here are the baby boys.
They start dying too much at the exact same time but the increase is less dramatic.
That matters.
Total excess baby girl deaths '21-'23 = 1523
Total excess baby boy deaths '21-'23 = 890
They start dying too much at the exact same time but the increase is less dramatic.
That matters.
Total excess baby girl deaths '21-'23 = 1523
Total excess baby boy deaths '21-'23 = 890
Boys die more than girls from natural causes.
Having more girls than boys die is a signal that there is a new pathology around.
This pathology was not present in 2020 - the year of the virus.
The % of female deaths has rocketed and the rise is statistically significant.
Having more girls than boys die is a signal that there is a new pathology around.
This pathology was not present in 2020 - the year of the virus.
The % of female deaths has rocketed and the rise is statistically significant.

Next, I looked at cause of death.
Sudden Infant Death Syndrome - SIDS was 76% of deaths of unknown cause in under 1s in '99 but only half by '19.
Therefore, I looked at all deaths of unknown cause.
Again there is a highly statistically significant rise from '21 on.
Sudden Infant Death Syndrome - SIDS was 76% of deaths of unknown cause in under 1s in '99 but only half by '19.
Therefore, I looked at all deaths of unknown cause.
Again there is a highly statistically significant rise from '21 on.

Lastly, I looked at race differences.
It turns out that black / afro-carribean babies (while they sadly die more overall) have not seen an increase since 2021.
The increase is in white babies.
Females:
It turns out that black / afro-carribean babies (while they sadly die more overall) have not seen an increase since 2021.
The increase is in white babies.
Females:

Males:

The ratio of white to black babies dying has, like the other markers, rocketed since 2021.
It is statistically significant but worse for females.
Males:
It is statistically significant but worse for females.
Males:

Females:

This is not covid.
These deaths include deaths attributed to covid (a total of about 350) - but notably the same age group did not see many deaths in 2020.
Unlike for other age groups children saw worse covid mortality than 2020 only after vaccines were introduced.
These deaths include deaths attributed to covid (a total of about 350) - but notably the same age group did not see many deaths in 2020.
Unlike for other age groups children saw worse covid mortality than 2020 only after vaccines were introduced.
Here are covid deaths
'23>'21
'23>'21

So what could cause:
1. A rise in death starting April 2021?
2. More deaths in females than males?
3. Deaths with no features of known natural causes?
4. More white baby deaths than black deaths?
1. A rise in death starting April 2021?
2. More deaths in females than males?
3. Deaths with no features of known natural causes?
4. More white baby deaths than black deaths?
Trying to fob these off as due to stress or economic difficulties does not wash.
The primse suspect must be the injections given to and pushed on pregnant women from 2021 onwards.
Until proven otherwise the injections must be stopped before more babies die.
The primse suspect must be the injections given to and pushed on pregnant women from 2021 onwards.
Until proven otherwise the injections must be stopped before more babies die.
• • •
Missing some Tweet in this thread? You can try to
force a refresh