Linear Regression is one of the most important tools in a Data Scientist's toolbox.
Yet it's super confusing for beginners.
Let's fix that: 🧵
Yet it's super confusing for beginners.
Let's fix that: 🧵

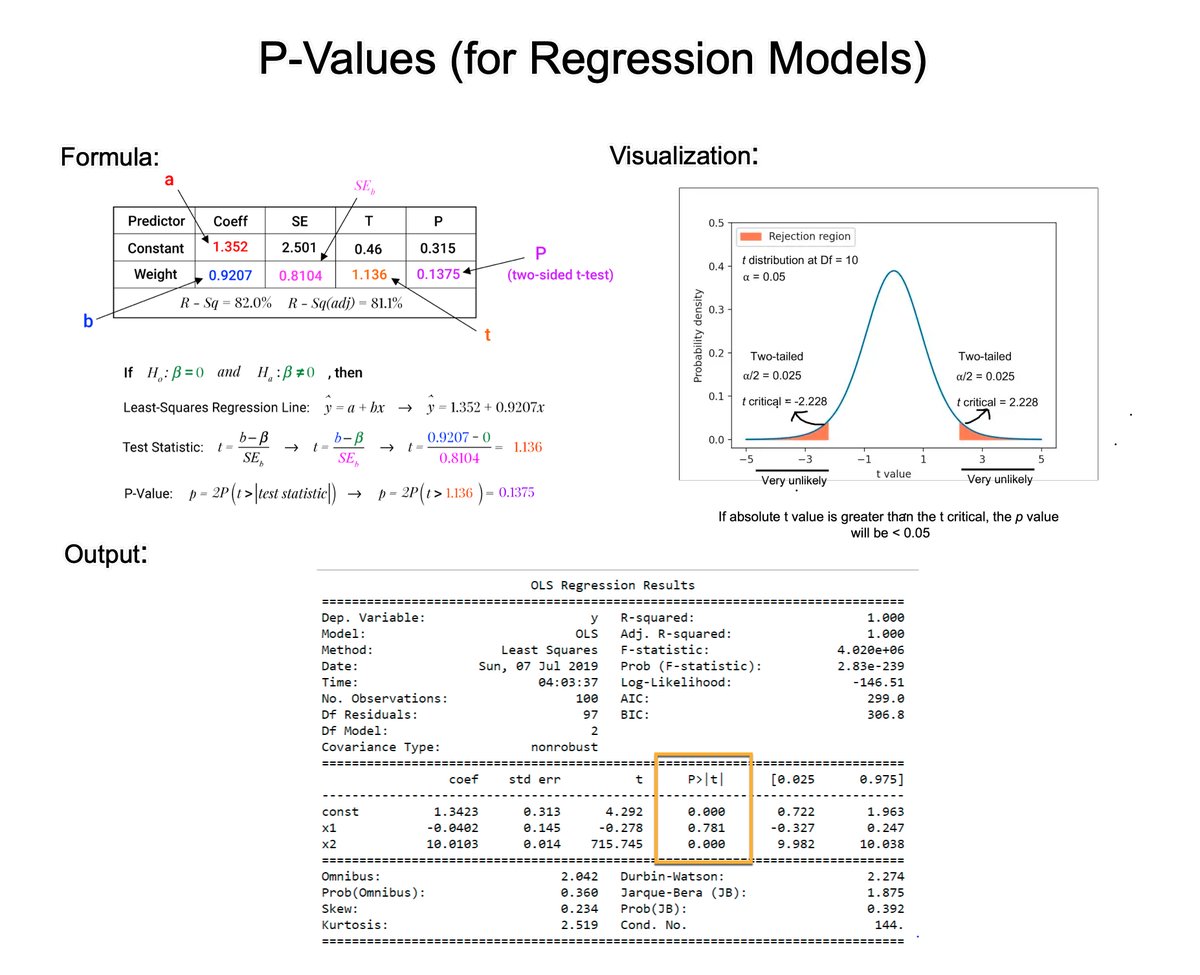
1. Ordinary Least Squares (OLS) Regression
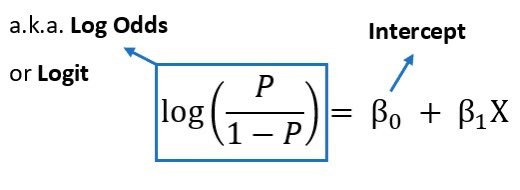
Most common form of Linear Regression. OLS regression aims to find the best-fitting linear equation that describes the relationship between the dependent variable (often denoted as Y) and independent variables (denoted as X1, X2, ..., Xn).
Most common form of Linear Regression. OLS regression aims to find the best-fitting linear equation that describes the relationship between the dependent variable (often denoted as Y) and independent variables (denoted as X1, X2, ..., Xn).
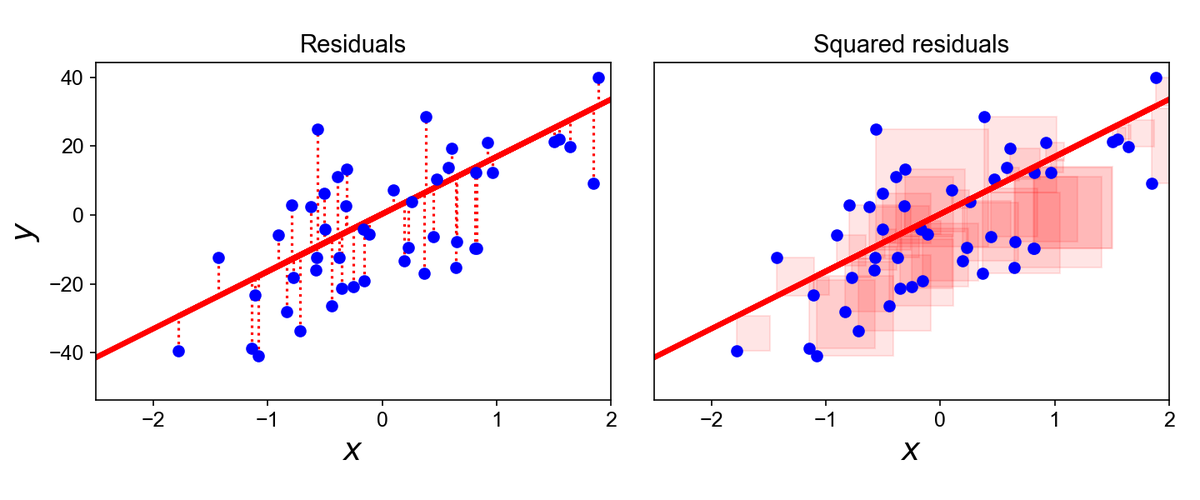
2. Minimize the Sum of Squares
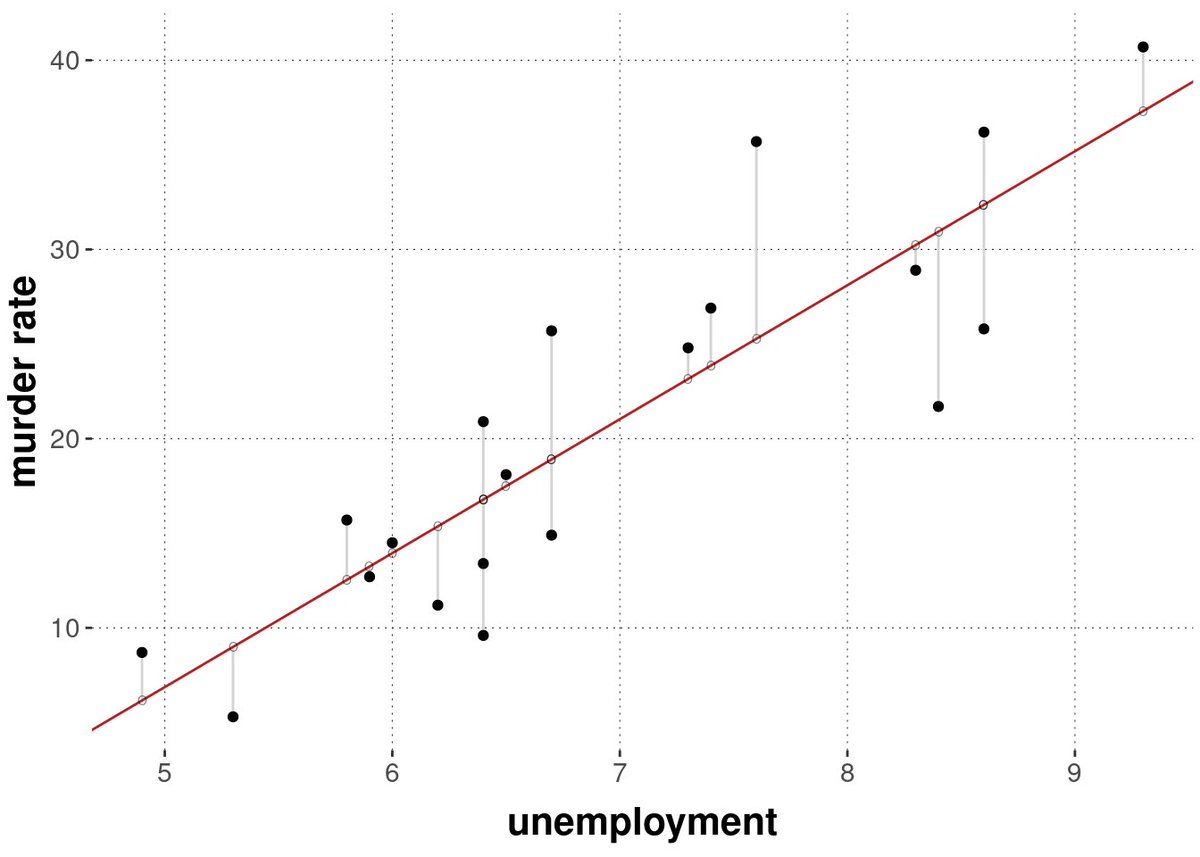
OLS does this by minimizing the sum of the squares of the differences between the observed dependent variable values and those predicted by the linear model. These differences are called "residuals."
OLS does this by minimizing the sum of the squares of the differences between the observed dependent variable values and those predicted by the linear model. These differences are called "residuals."
3. Best Fit
"Best fit" in the context of OLS means that the sum of the squares of the residuals is as small as possible. Mathematically, it's about finding the values of β0, β1, ..., βn that minimize this sum.
"Best fit" in the context of OLS means that the sum of the squares of the residuals is as small as possible. Mathematically, it's about finding the values of β0, β1, ..., βn that minimize this sum.
4. Coefficients (β1, β2, ..., βn):
These coefficients represent the change in the dependent variable for a one-unit change in the corresponding independent variable, holding other variables constant.
These coefficients represent the change in the dependent variable for a one-unit change in the corresponding independent variable, holding other variables constant.
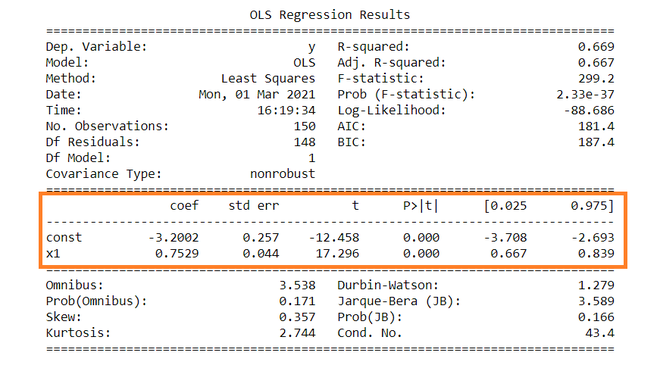
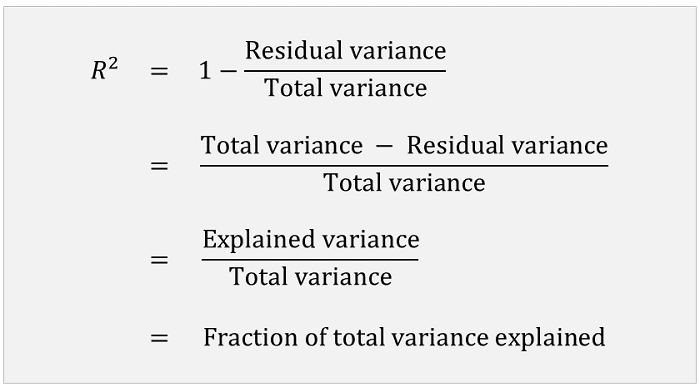
5. R-squared (R²):
This statistic measures the proportion of variance in the dependent variable that is predictable from the independent variables. It ranges from 0 to 1, with higher values indicating a better fit of the model to the data.
This statistic measures the proportion of variance in the dependent variable that is predictable from the independent variables. It ranges from 0 to 1, with higher values indicating a better fit of the model to the data.
6. t-Statistics and p-Values:
For each coefficient, the t-statistic and its associated p-value test the null hypothesis that the coefficient is equal to zero (no effect). A small p-value (< 0.05) suggests that you can reject the null hypothesis.
For each coefficient, the t-statistic and its associated p-value test the null hypothesis that the coefficient is equal to zero (no effect). A small p-value (< 0.05) suggests that you can reject the null hypothesis.
7. Confidence Intervals:
These intervals provide a range of plausible values for each coefficient (usually at the 95% confidence level).
These intervals provide a range of plausible values for each coefficient (usually at the 95% confidence level).
8. There's a new problem that has surfaced -- Companies NOW want AI.
AI is the single biggest force of our decade. Yet 99% of data scientists are ignoring it.
That's a huge advantage to you. I'd like to help.
AI is the single biggest force of our decade. Yet 99% of data scientists are ignoring it.
That's a huge advantage to you. I'd like to help.
Want to become a Generative AI Data Scientist in 2025 ($200,000 career)?
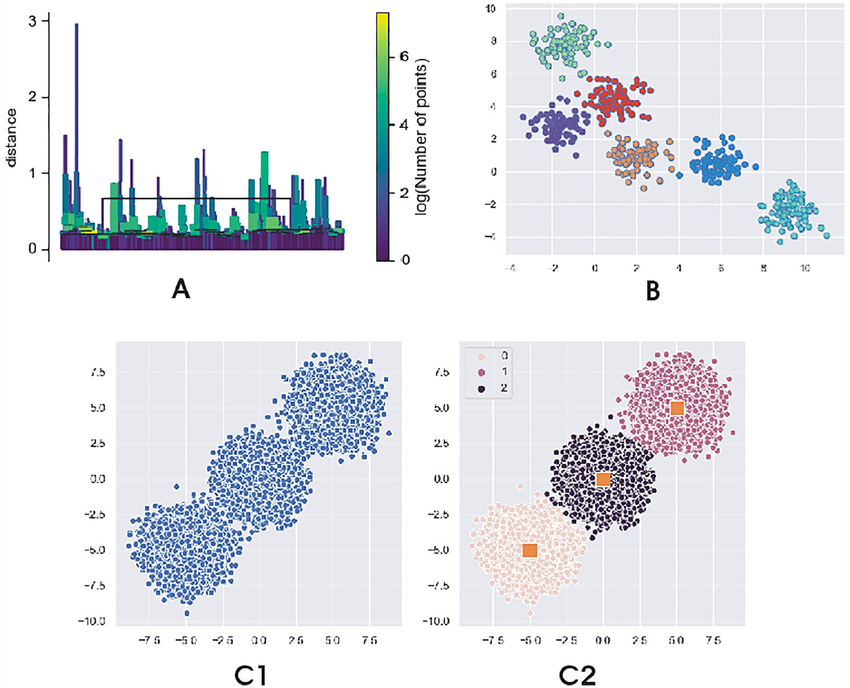
On Wednesday, Sept 3rd, I'm sharing one of my best AI Projects: How I built an AI Customer Segmentation Agent with Python
Register here (limit 500 seats): learn.business-science.io/ai-register
On Wednesday, Sept 3rd, I'm sharing one of my best AI Projects: How I built an AI Customer Segmentation Agent with Python
Register here (limit 500 seats): learn.business-science.io/ai-register
That's a wrap! Over the next 24 days, I'm sharing the 24 concepts that helped me become an AI data scientist.
If you enjoyed this thread:
1. Follow me @mdancho84 for more of these
2. RT the tweet below to share this thread with your audience
If you enjoyed this thread:
1. Follow me @mdancho84 for more of these
2. RT the tweet below to share this thread with your audience
https://twitter.com/815555071517872128/status/1961816517978333292
P.S. I create AI + Data Science tutorials and share them for free. Your 👍 like and ♻️ repost helps keep me going.
• • •
Missing some Tweet in this thread? You can try to
force a refresh