This is the definition of broken:
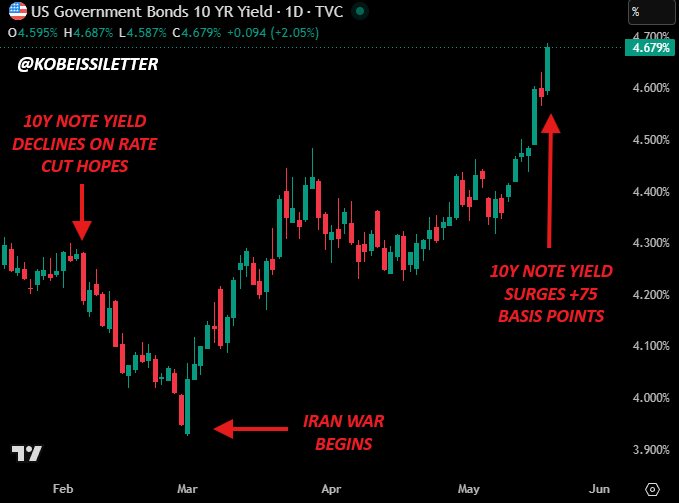
In 15 days, the Fed will cut rates for the first time in 2025, yet the 30Y Treasury Yield is now near 5.00%.
We have RISING interest rates as markets "price-in" Fed interest rate CUTS.
Do you realize what's happening?
(a thread)
In 15 days, the Fed will cut rates for the first time in 2025, yet the 30Y Treasury Yield is now near 5.00%.
We have RISING interest rates as markets "price-in" Fed interest rate CUTS.
Do you realize what's happening?
(a thread)

There is now a 90% chance that the Fed cuts rates by 25 basis points on September 17th.
AND, the market sees a BASE-CASE of 50 basis points of rate cuts in 2025.
There's even a 34% chance of 75 basis points of rate cuts this year.
Finally, some relief for consumers, right?
AND, the market sees a BASE-CASE of 50 basis points of rate cuts in 2025.
There's even a 34% chance of 75 basis points of rate cuts this year.
Finally, some relief for consumers, right?

Wrong.
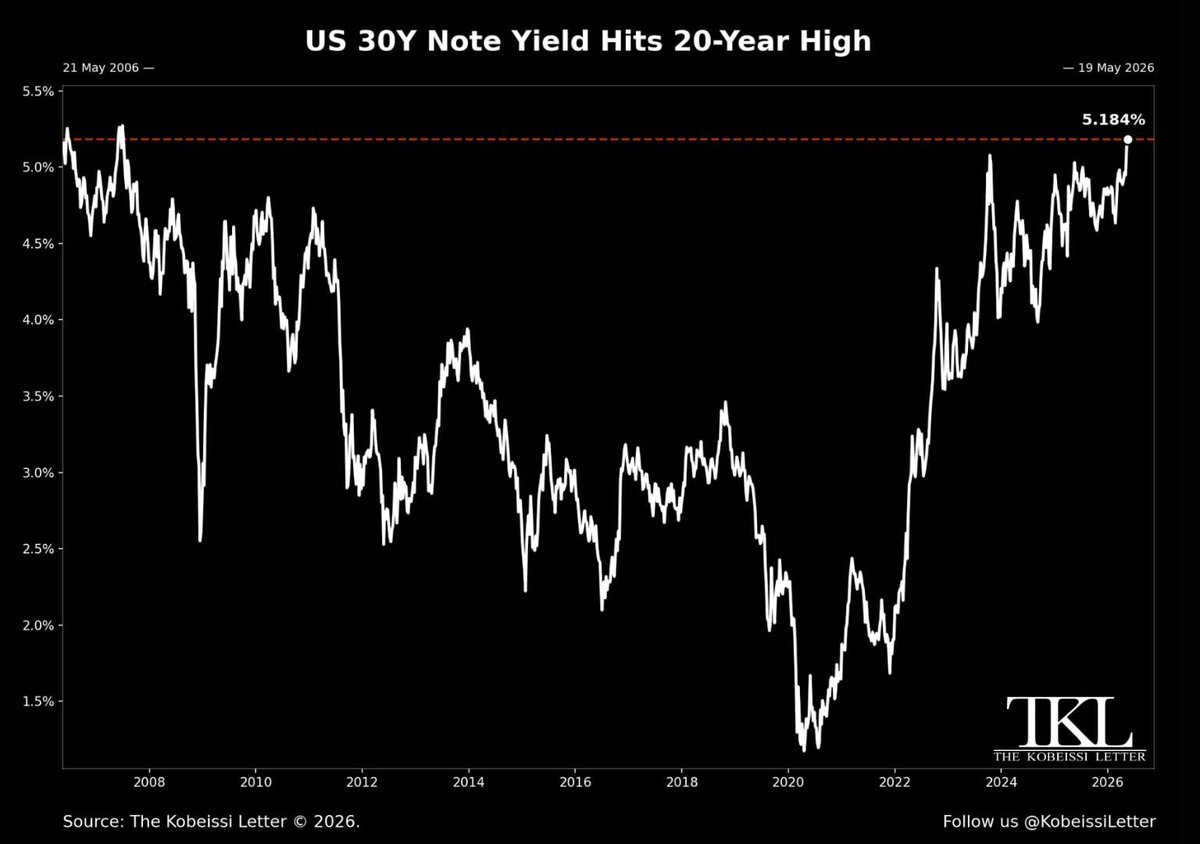
Treasury yields are surging in the US today with the 30Y Note Yield back at 5%.
These are the same levels seen in 2008, amidst the biggest financial crisis in US history.
Interest rates are literally rising as the market prepares for rate cuts to begin.
Treasury yields are surging in the US today with the 30Y Note Yield back at 5%.
These are the same levels seen in 2008, amidst the biggest financial crisis in US history.
Interest rates are literally rising as the market prepares for rate cuts to begin.

Deficit spending has gone so far out of control, that the Fed is losing control of interest rates.
The US has issued over $200 BILLION of bonds in just 5 weeks.
We are reaching a point where investors simply do not want to buy US government debt at current yields.
The US has issued over $200 BILLION of bonds in just 5 weeks.
We are reaching a point where investors simply do not want to buy US government debt at current yields.

How do we know this is the case?
Take a look at "Term Premiums" on US 10Y Government bonds.
The term premium is the extra yield investors demand to hold a long-term bond, generally due to the "perceived risk" of holding these bonds.
This is near its highest level since 2014.
Take a look at "Term Premiums" on US 10Y Government bonds.
The term premium is the extra yield investors demand to hold a long-term bond, generally due to the "perceived risk" of holding these bonds.
This is near its highest level since 2014.

Meanwhile, with rate cuts just 2 weeks away, US Core inflation is back above 3% and on the rise.
At 3% annual inflation, the US Dollar will lose over 25% of its purchasing power over the next 10 years.
It has already lost ~25% since 2020, only compounding inflation.
At 3% annual inflation, the US Dollar will lose over 25% of its purchasing power over the next 10 years.
It has already lost ~25% since 2020, only compounding inflation.

Our premium members have capitalized on this collapse of bond prices.
On August 20th, we posted this alert as we held shorts in $TLT and called for a drop to $85.00.
Today, $TLT is down sharply and nearing $85.00.
Subscribe to access our alerts:
thekobeissiletter.com/subscribe
On August 20th, we posted this alert as we held shorts in $TLT and called for a drop to $85.00.
Today, $TLT is down sharply and nearing $85.00.
Subscribe to access our alerts:
thekobeissiletter.com/subscribe

The US must take a look at what is happening in the UK before going down the same path.
The Bank of England has cut interest rates FIVE TIMES in 12 months.
Despite rising inflation, they blamed a weaker economy and labor market.
This is the SAME EXACT route the Fed is taking.
The Bank of England has cut interest rates FIVE TIMES in 12 months.
Despite rising inflation, they blamed a weaker economy and labor market.
This is the SAME EXACT route the Fed is taking.
Today, the UK's 30Y Bond yield officially broke above 5.70% for the first time since April 1998.
That's right. The BOE cut rates 5 times and ended up with rates at a 27-year high.
The market is quite literally rejecting interest rate cuts due to deficit spending and inflation.
That's right. The BOE cut rates 5 times and ended up with rates at a 27-year high.
The market is quite literally rejecting interest rate cuts due to deficit spending and inflation.

This is all just a preview of what the situation can turn into.
Take a look at Japan which now has its 30Y Government Bond yield above 3.20%.
Not only have yields never been this high, but they are over 30 TIMES higher than 2019 levels.
The market is crystal clear.
Take a look at Japan which now has its 30Y Government Bond yield above 3.20%.
Not only have yields never been this high, but they are over 30 TIMES higher than 2019 levels.
The market is crystal clear.

It also explains why gold has been rising in a straight-line higher.
Here's a comparison of Japanese Government Bond Yields and gold prices.
They are trading with near-perfect correlation.
Gold knows this is just the beginning of the global deficit spending crisis.
Here's a comparison of Japanese Government Bond Yields and gold prices.
They are trading with near-perfect correlation.
Gold knows this is just the beginning of the global deficit spending crisis.

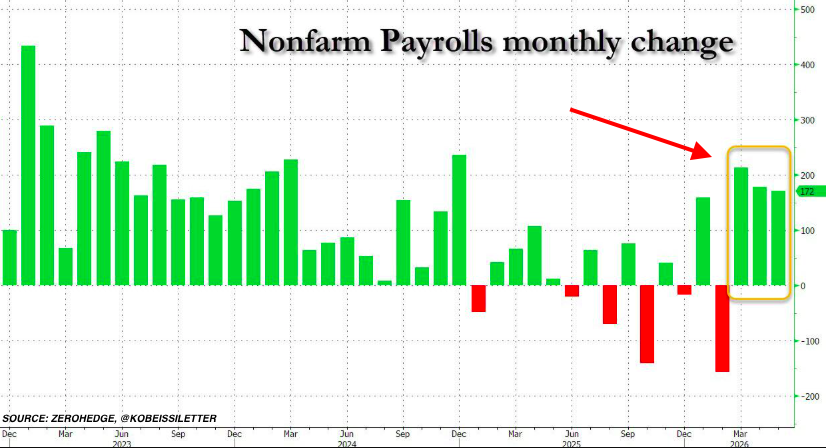
In 2 weeks, the Fed will cut rates and "blame" a weak labor market.
The US unemployment rate for 16-24 year-olds is up to 10%.
The labor market is weakening into rising inflation.
Stagflation is here.
Follow us @KobeissiLetter for real time analysis as this develops.
The US unemployment rate for 16-24 year-olds is up to 10%.
The labor market is weakening into rising inflation.
Stagflation is here.
Follow us @KobeissiLetter for real time analysis as this develops.

• • •
Missing some Tweet in this thread? You can try to
force a refresh